Cities with the Largest Portuguese Community in California
RELATED REPORTS & OPTIONS
Portuguese
California
Compare Cities
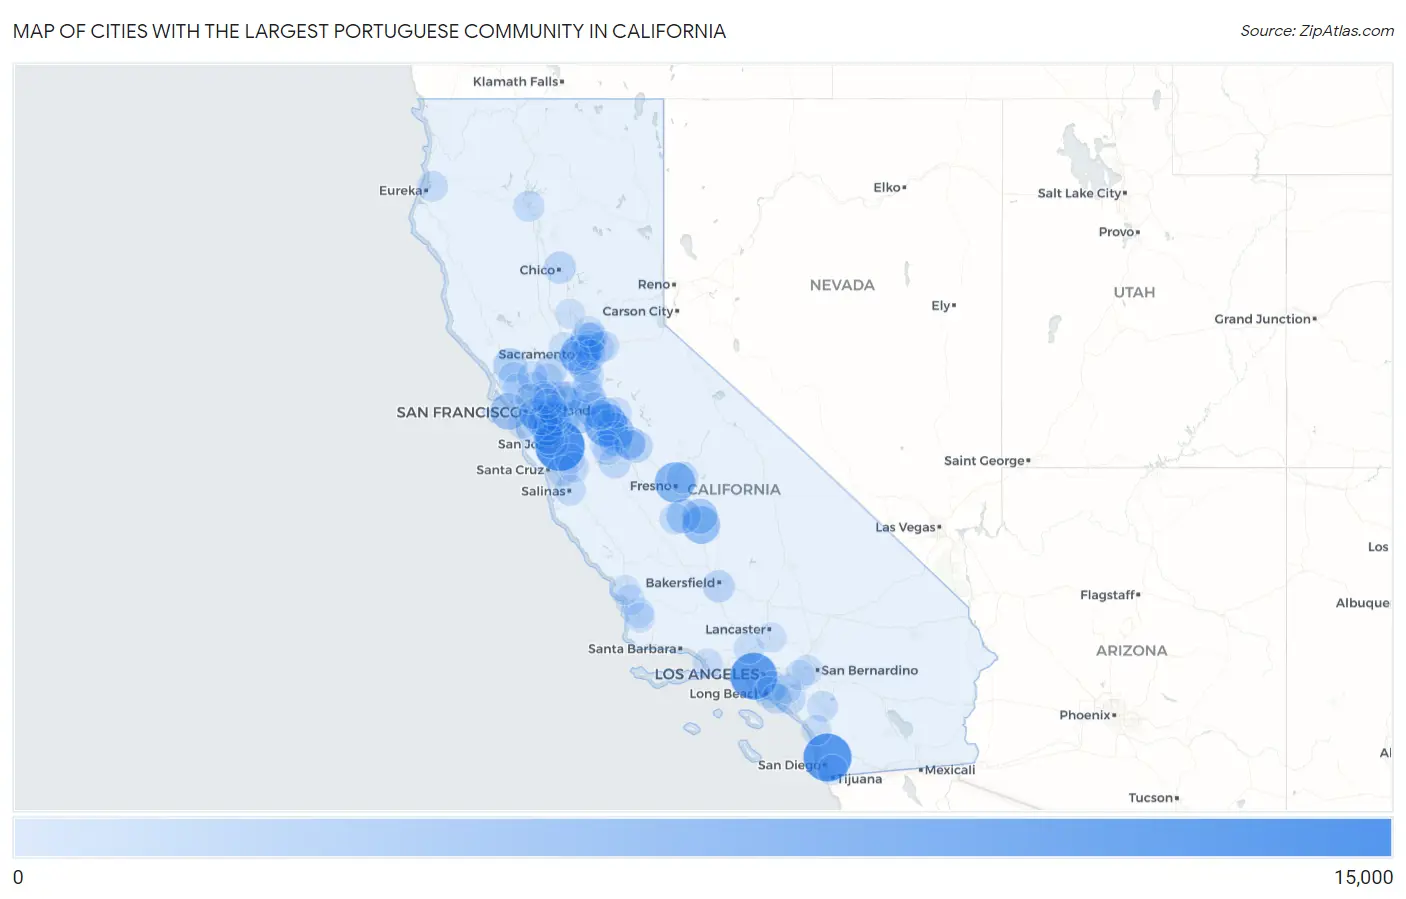
Map of Cities with the Largest Portuguese Community in California
0
15,000
Cities with the Largest Portuguese Community in California
| City | Portuguese | vs State | vs National | |
| 1. | San Jose | 10,501 | 316,347(3.32%)#1 | 1,351,314(0.78%)#6 |
| 2. | San Diego | 9,676 | 316,347(3.06%)#2 | 1,351,314(0.72%)#7 |
| 3. | Los Angeles | 9,077 | 316,347(2.87%)#3 | 1,351,314(0.67%)#8 |
| 4. | Modesto | 6,877 | 316,347(2.17%)#4 | 1,351,314(0.51%)#10 |
| 5. | Fresno | 5,721 | 316,347(1.81%)#5 | 1,351,314(0.42%)#16 |
| 6. | Sacramento | 5,482 | 316,347(1.73%)#6 | 1,351,314(0.41%)#17 |
| 7. | Tulare | 4,373 | 316,347(1.38%)#7 | 1,351,314(0.32%)#20 |
| 8. | Turlock | 4,140 | 316,347(1.31%)#8 | 1,351,314(0.31%)#22 |
| 9. | San Francisco | 4,025 | 316,347(1.27%)#9 | 1,351,314(0.30%)#24 |
| 10. | Visalia | 3,077 | 316,347(0.97%)#10 | 1,351,314(0.23%)#33 |
| 11. | Manteca | 2,987 | 316,347(0.94%)#11 | 1,351,314(0.22%)#36 |
| 12. | San Leandro | 2,967 | 316,347(0.94%)#12 | 1,351,314(0.22%)#37 |
| 13. | Roseville | 2,906 | 316,347(0.92%)#13 | 1,351,314(0.22%)#38 |
| 14. | Stockton | 2,866 | 316,347(0.91%)#14 | 1,351,314(0.21%)#40 |
| 15. | Hanford | 2,819 | 316,347(0.89%)#15 | 1,351,314(0.21%)#42 |
| 16. | Livermore | 2,744 | 316,347(0.87%)#16 | 1,351,314(0.20%)#44 |
| 17. | Tracy | 2,742 | 316,347(0.87%)#17 | 1,351,314(0.20%)#45 |
| 18. | Fremont | 2,679 | 316,347(0.85%)#18 | 1,351,314(0.20%)#47 |
| 19. | Hilmar Irwin | 2,538 | 316,347(0.80%)#19 | 1,351,314(0.19%)#50 |
| 20. | Hayward | 2,421 | 316,347(0.77%)#20 | 1,351,314(0.18%)#52 |
| 21. | Santa Clara | 2,415 | 316,347(0.76%)#21 | 1,351,314(0.18%)#54 |
| 22. | Santa Rosa | 2,393 | 316,347(0.76%)#22 | 1,351,314(0.18%)#57 |
| 23. | Elk Grove | 2,315 | 316,347(0.73%)#23 | 1,351,314(0.17%)#59 |
| 24. | Oakland | 2,288 | 316,347(0.72%)#24 | 1,351,314(0.17%)#60 |
| 25. | Castro Valley | 2,094 | 316,347(0.66%)#25 | 1,351,314(0.15%)#65 |
| 26. | Merced | 2,001 | 316,347(0.63%)#26 | 1,351,314(0.15%)#67 |
| 27. | Bakersfield | 1,727 | 316,347(0.55%)#27 | 1,351,314(0.13%)#81 |
| 28. | Pleasanton | 1,665 | 316,347(0.53%)#28 | 1,351,314(0.12%)#83 |
| 29. | Concord | 1,645 | 316,347(0.52%)#29 | 1,351,314(0.12%)#84 |
| 30. | Chico | 1,640 | 316,347(0.52%)#30 | 1,351,314(0.12%)#85 |
| 31. | Atwater | 1,637 | 316,347(0.52%)#31 | 1,351,314(0.12%)#86 |
| 32. | San Ramon | 1,580 | 316,347(0.50%)#32 | 1,351,314(0.12%)#91 |
| 33. | Antioch | 1,575 | 316,347(0.50%)#33 | 1,351,314(0.12%)#92 |
| 34. | Vacaville | 1,575 | 316,347(0.50%)#34 | 1,351,314(0.12%)#93 |
| 35. | Clovis | 1,529 | 316,347(0.48%)#35 | 1,351,314(0.11%)#96 |
| 36. | Los Banos | 1,466 | 316,347(0.46%)#36 | 1,351,314(0.11%)#100 |
| 37. | Brentwood | 1,355 | 316,347(0.43%)#37 | 1,351,314(0.10%)#110 |
| 38. | Long Beach | 1,313 | 316,347(0.42%)#38 | 1,351,314(0.10%)#114 |
| 39. | Irvine | 1,244 | 316,347(0.39%)#39 | 1,351,314(0.09%)#120 |
| 40. | Salinas | 1,220 | 316,347(0.39%)#40 | 1,351,314(0.09%)#121 |
| 41. | Arden Arcade | 1,184 | 316,347(0.37%)#41 | 1,351,314(0.09%)#126 |
| 42. | Lemoore | 1,177 | 316,347(0.37%)#42 | 1,351,314(0.09%)#127 |
| 43. | Citrus Heights | 1,156 | 316,347(0.37%)#43 | 1,351,314(0.09%)#130 |
| 44. | Carmichael | 1,154 | 316,347(0.36%)#44 | 1,351,314(0.09%)#131 |
| 45. | Ceres | 1,147 | 316,347(0.36%)#45 | 1,351,314(0.08%)#134 |
| 46. | Vallejo | 1,144 | 316,347(0.36%)#46 | 1,351,314(0.08%)#135 |
| 47. | Redding | 1,107 | 316,347(0.35%)#47 | 1,351,314(0.08%)#139 |
| 48. | Petaluma | 1,100 | 316,347(0.35%)#48 | 1,351,314(0.08%)#140 |
| 49. | Folsom | 1,070 | 316,347(0.34%)#49 | 1,351,314(0.08%)#143 |
| 50. | Watsonville | 1,064 | 316,347(0.34%)#50 | 1,351,314(0.08%)#147 |
| 51. | Fairfield | 1,059 | 316,347(0.33%)#51 | 1,351,314(0.08%)#149 |
| 52. | Murrieta | 1,038 | 316,347(0.33%)#52 | 1,351,314(0.08%)#155 |
| 53. | Rocklin | 1,029 | 316,347(0.33%)#53 | 1,351,314(0.08%)#157 |
| 54. | Union City | 989 | 316,347(0.31%)#54 | 1,351,314(0.07%)#170 |
| 55. | Artesia | 971 | 316,347(0.31%)#55 | 1,351,314(0.07%)#174 |
| 56. | Arcata | 964 | 316,347(0.30%)#56 | 1,351,314(0.07%)#175 |
| 57. | El Dorado Hills | 961 | 316,347(0.30%)#57 | 1,351,314(0.07%)#176 |
| 58. | Newark | 954 | 316,347(0.30%)#58 | 1,351,314(0.07%)#179 |
| 59. | Dublin | 939 | 316,347(0.30%)#59 | 1,351,314(0.07%)#182 |
| 60. | Gilroy | 933 | 316,347(0.29%)#60 | 1,351,314(0.07%)#183 |
| 61. | Mcswain | 928 | 316,347(0.29%)#61 | 1,351,314(0.07%)#186 |
| 62. | Oakley | 917 | 316,347(0.29%)#62 | 1,351,314(0.07%)#188 |
| 63. | Huntington Beach | 915 | 316,347(0.29%)#63 | 1,351,314(0.07%)#191 |
| 64. | Martinez | 912 | 316,347(0.29%)#64 | 1,351,314(0.07%)#193 |
| 65. | Oakdale | 899 | 316,347(0.28%)#65 | 1,351,314(0.07%)#195 |
| 66. | San Mateo | 897 | 316,347(0.28%)#66 | 1,351,314(0.07%)#196 |
| 67. | Galt | 896 | 316,347(0.28%)#67 | 1,351,314(0.07%)#198 |
| 68. | Rancho Cordova | 883 | 316,347(0.28%)#68 | 1,351,314(0.07%)#200 |
| 69. | Newman | 867 | 316,347(0.27%)#69 | 1,351,314(0.06%)#202 |
| 70. | Escalon | 850 | 316,347(0.27%)#70 | 1,351,314(0.06%)#204 |
| 71. | Novato | 848 | 316,347(0.27%)#71 | 1,351,314(0.06%)#205 |
| 72. | Oceanside | 822 | 316,347(0.26%)#72 | 1,351,314(0.06%)#211 |
| 73. | Napa | 822 | 316,347(0.26%)#73 | 1,351,314(0.06%)#212 |
| 74. | Morgan Hill | 818 | 316,347(0.26%)#74 | 1,351,314(0.06%)#214 |
| 75. | Oxnard | 812 | 316,347(0.26%)#75 | 1,351,314(0.06%)#216 |
| 76. | Chula Vista | 811 | 316,347(0.26%)#76 | 1,351,314(0.06%)#217 |
| 77. | Sunnyvale | 808 | 316,347(0.26%)#77 | 1,351,314(0.06%)#220 |
| 78. | Alameda | 805 | 316,347(0.25%)#78 | 1,351,314(0.06%)#222 |
| 79. | Fontana | 795 | 316,347(0.25%)#79 | 1,351,314(0.06%)#225 |
| 80. | West Sacramento | 795 | 316,347(0.25%)#80 | 1,351,314(0.06%)#226 |
| 81. | Lincoln | 795 | 316,347(0.25%)#81 | 1,351,314(0.06%)#227 |
| 82. | San Lorenzo | 792 | 316,347(0.25%)#82 | 1,351,314(0.06%)#229 |
| 83. | Anaheim | 778 | 316,347(0.25%)#83 | 1,351,314(0.06%)#231 |
| 84. | Santa Clarita | 764 | 316,347(0.24%)#84 | 1,351,314(0.06%)#233 |
| 85. | Ripon | 760 | 316,347(0.24%)#85 | 1,351,314(0.06%)#235 |
| 86. | Lodi | 752 | 316,347(0.24%)#86 | 1,351,314(0.06%)#237 |
| 87. | Arroyo Grande | 747 | 316,347(0.24%)#87 | 1,351,314(0.06%)#240 |
| 88. | Woodland | 741 | 316,347(0.23%)#88 | 1,351,314(0.05%)#245 |
| 89. | Santa Maria | 730 | 316,347(0.23%)#89 | 1,351,314(0.05%)#250 |
| 90. | Danville | 730 | 316,347(0.23%)#90 | 1,351,314(0.05%)#251 |
| 91. | Pleasant Hill | 724 | 316,347(0.23%)#91 | 1,351,314(0.05%)#254 |
| 92. | San Luis Obispo | 720 | 316,347(0.23%)#92 | 1,351,314(0.05%)#258 |
| 93. | Ontario | 712 | 316,347(0.23%)#93 | 1,351,314(0.05%)#261 |
| 94. | Pacifica | 708 | 316,347(0.22%)#94 | 1,351,314(0.05%)#263 |
| 95. | Palmdale | 696 | 316,347(0.22%)#95 | 1,351,314(0.05%)#266 |
| 96. | Gustine | 696 | 316,347(0.22%)#96 | 1,351,314(0.05%)#268 |
| 97. | Yuba City | 688 | 316,347(0.22%)#97 | 1,351,314(0.05%)#271 |
| 98. | Orcutt | 680 | 316,347(0.21%)#98 | 1,351,314(0.05%)#275 |
| 99. | Walnut Creek | 676 | 316,347(0.21%)#99 | 1,351,314(0.05%)#276 |
| 100. | Richmond | 669 | 316,347(0.21%)#100 | 1,351,314(0.05%)#278 |
Common Questions
What are the Top 10 Cities with the Largest Portuguese Community in California?
Top 10 Cities with the Largest Portuguese Community in California are:
#1
10,501
#2
9,676
#3
9,077
#4
6,877
#5
5,721
#6
5,482
#7
4,373
#8
4,140
#9
4,025
#10
3,077
What city has the Largest Portuguese Community in California?
San Jose has the Largest Portuguese Community in California with 10,501.
What is the Total Portuguese Population in the State of California?
Total Portuguese Population in California is 316,347.
What is the Total Portuguese Population in the United States?
Total Portuguese Population in the United States is 1,351,314.