Cities with the Highest Percentage of Population Employed in Health Technologists in California
RELATED REPORTS & OPTIONS
Health Technologists
California
Compare Cities
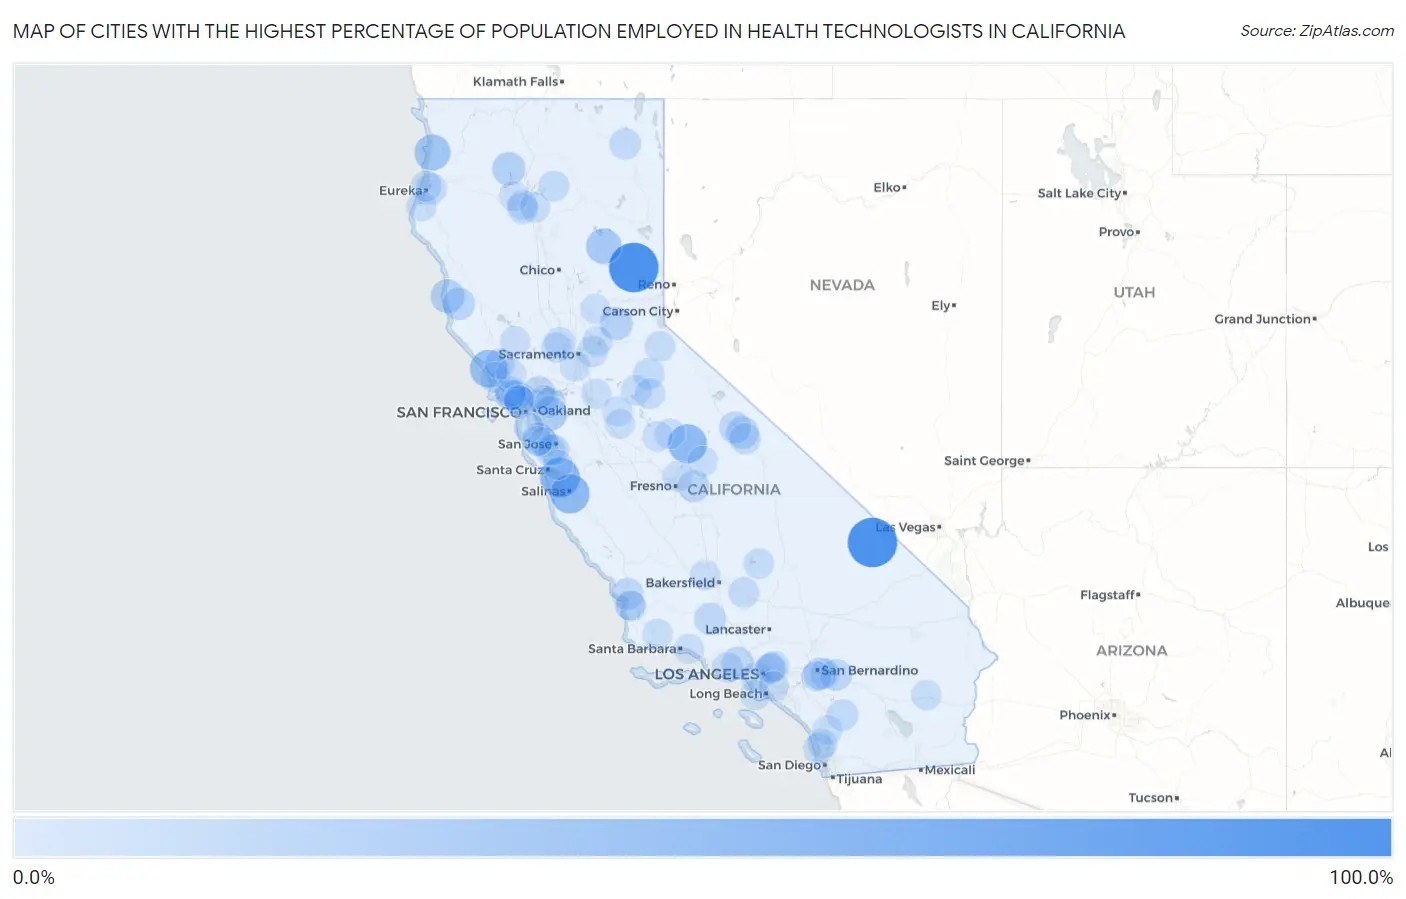
Map of Cities with the Highest Percentage of Population Employed in Health Technologists in California
0.0%
100.0%
Cities with the Highest Percentage of Population Employed in Health Technologists in California
| City | % Employed | vs State | vs National | |
| 1. | Gold Mountain | 100.0% | 3.7%(+96.3)#1 | 4.3%(+95.7)#4 |
| 2. | Shoshone | 100.0% | 3.7%(+96.3)#2 | 4.3%(+95.7)#11 |
| 3. | Pajaro Dunes | 53.3% | 3.7%(+49.7)#3 | 4.3%(+49.0)#32 |
| 4. | Spreckels | 50.8% | 3.7%(+47.1)#4 | 4.3%(+46.5)#40 |
| 5. | Bass Lake | 50.5% | 3.7%(+46.8)#5 | 4.3%(+46.2)#41 |
| 6. | Sereno Del Mar | 44.4% | 3.7%(+40.8)#6 | 4.3%(+40.2)#57 |
| 7. | Rumsey | 42.3% | 3.7%(+38.6)#7 | 4.3%(+38.0)#67 |
| 8. | Orick | 35.9% | 3.7%(+32.3)#8 | 4.3%(+31.6)#96 |
| 9. | Twain | 33.3% | 3.7%(+29.7)#9 | 4.3%(+29.0)#112 |
| 10. | Norris Canyon | 27.1% | 3.7%(+23.4)#10 | 4.3%(+22.8)#189 |
| 11. | Caspar | 25.3% | 3.7%(+21.6)#11 | 4.3%(+21.0)#213 |
| 12. | Coffee Creek | 24.2% | 3.7%(+20.5)#12 | 4.3%(+19.9)#239 |
| 13. | Foresthill | 22.7% | 3.7%(+19.0)#13 | 4.3%(+18.4)#279 |
| 14. | Port Costa | 20.3% | 3.7%(+16.6)#14 | 4.3%(+16.0)#352 |
| 15. | Paradise | 20.2% | 3.7%(+16.5)#15 | 4.3%(+15.9)#354 |
| 16. | Ladera | 20.2% | 3.7%(+16.5)#16 | 4.3%(+15.9)#356 |
| 17. | Comptche | 20.0% | 3.7%(+16.3)#17 | 4.3%(+15.7)#367 |
| 18. | El Macero | 19.8% | 3.7%(+16.1)#18 | 4.3%(+15.5)#373 |
| 19. | Loma Linda | 19.6% | 3.7%(+16.0)#19 | 4.3%(+15.3)#378 |
| 20. | Alto | 19.1% | 3.7%(+15.4)#20 | 4.3%(+14.8)#410 |
| 21. | Minkler | 17.9% | 3.7%(+14.2)#21 | 4.3%(+13.6)#475 |
| 22. | Bell Canyon | 17.3% | 3.7%(+13.6)#22 | 4.3%(+13.0)#500 |
| 23. | Pine Mountain Club | 17.1% | 3.7%(+13.5)#23 | 4.3%(+12.8)#515 |
| 24. | Crowley Lake | 17.1% | 3.7%(+13.4)#24 | 4.3%(+12.8)#517 |
| 25. | Los Ranchos | 16.7% | 3.7%(+13.1)#25 | 4.3%(+12.4)#539 |
| 26. | Oak Glen | 16.4% | 3.7%(+12.7)#26 | 4.3%(+12.1)#571 |
| 27. | Aguanga | 15.7% | 3.7%(+12.1)#27 | 4.3%(+11.4)#622 |
| 28. | Round Valley | 15.6% | 3.7%(+12.0)#28 | 4.3%(+11.3)#631 |
| 29. | California Pines | 15.6% | 3.7%(+11.9)#29 | 4.3%(+11.3)#634 |
| 30. | Dorrington | 15.3% | 3.7%(+11.7)#30 | 4.3%(+11.1)#660 |
| 31. | Elfin Forest | 14.6% | 3.7%(+11.0)#31 | 4.3%(+10.3)#739 |
| 32. | Indianola | 14.2% | 3.7%(+10.5)#32 | 4.3%(+9.90)#789 |
| 33. | Monte Sereno | 14.1% | 3.7%(+10.5)#33 | 4.3%(+9.86)#793 |
| 34. | Yolo | 14.1% | 3.7%(+10.5)#34 | 4.3%(+9.86)#795 |
| 35. | Lagunitas Forest Knolls | 14.1% | 3.7%(+10.5)#35 | 4.3%(+9.85)#797 |
| 36. | Gold River | 13.9% | 3.7%(+10.3)#36 | 4.3%(+9.63)#822 |
| 37. | Del Mar | 13.7% | 3.7%(+10.1)#37 | 4.3%(+9.44)#854 |
| 38. | Montgomery Creek | 13.6% | 3.7%(+9.97)#38 | 4.3%(+9.35)#873 |
| 39. | Keene | 13.1% | 3.7%(+9.40)#39 | 4.3%(+8.78)#965 |
| 40. | Manila | 13.0% | 3.7%(+9.31)#40 | 4.3%(+8.68)#981 |
| 41. | Cambrian Park | 13.0% | 3.7%(+9.30)#41 | 4.3%(+8.68)#985 |
| 42. | Centerville | 12.9% | 3.7%(+9.22)#42 | 4.3%(+8.60)#1,000 |
| 43. | Mountain Meadows | 12.8% | 3.7%(+9.14)#43 | 4.3%(+8.51)#1,017 |
| 44. | Lake Sherwood | 12.8% | 3.7%(+9.13)#44 | 4.3%(+8.51)#1,018 |
| 45. | Dillon Beach | 12.6% | 3.7%(+8.96)#45 | 4.3%(+8.34)#1,044 |
| 46. | Ladera Heights | 12.6% | 3.7%(+8.94)#46 | 4.3%(+8.31)#1,053 |
| 47. | Vallecito | 12.5% | 3.7%(+8.84)#47 | 4.3%(+8.21)#1,079 |
| 48. | Sierra Madre | 12.2% | 3.7%(+8.51)#48 | 4.3%(+7.89)#1,146 |
| 49. | Nicasio | 12.0% | 3.7%(+8.34)#49 | 4.3%(+7.71)#1,183 |
| 50. | Graton | 11.9% | 3.7%(+8.26)#50 | 4.3%(+7.64)#1,206 |
| 51. | Twain Harte | 11.9% | 3.7%(+8.23)#51 | 4.3%(+7.61)#1,213 |
| 52. | Kirkwood | 11.8% | 3.7%(+8.10)#52 | 4.3%(+7.48)#1,246 |
| 53. | Clarksburg | 11.6% | 3.7%(+7.93)#53 | 4.3%(+7.31)#1,289 |
| 54. | Weldon | 11.5% | 3.7%(+7.79)#54 | 4.3%(+7.16)#1,335 |
| 55. | Shaver Lake | 11.4% | 3.7%(+7.70)#55 | 4.3%(+7.08)#1,361 |
| 56. | Fort Washington | 11.3% | 3.7%(+7.59)#56 | 4.3%(+6.96)#1,392 |
| 57. | Corte Madera | 11.1% | 3.7%(+7.44)#57 | 4.3%(+6.82)#1,433 |
| 58. | Bootjack | 11.0% | 3.7%(+7.39)#58 | 4.3%(+6.76)#1,447 |
| 59. | Redlands | 11.0% | 3.7%(+7.33)#59 | 4.3%(+6.71)#1,457 |
| 60. | Smith Corner | 10.9% | 3.7%(+7.26)#60 | 4.3%(+6.64)#1,479 |
| 61. | Knights Ferry | 10.9% | 3.7%(+7.25)#61 | 4.3%(+6.62)#1,485 |
| 62. | Baywood Park | 10.9% | 3.7%(+7.19)#62 | 4.3%(+6.56)#1,501 |
| 63. | Monument Hills | 10.8% | 3.7%(+7.10)#63 | 4.3%(+6.48)#1,515 |
| 64. | Woodlands | 10.7% | 3.7%(+7.05)#64 | 4.3%(+6.42)#1,539 |
| 65. | El Sobrante Cdp Riverside County | 10.7% | 3.7%(+7.00)#65 | 4.3%(+6.38)#1,555 |
| 66. | North Gate | 10.6% | 3.7%(+6.98)#66 | 4.3%(+6.35)#1,560 |
| 67. | Middletown | 10.5% | 3.7%(+6.82)#67 | 4.3%(+6.20)#1,612 |
| 68. | Highgrove | 10.4% | 3.7%(+6.77)#68 | 4.3%(+6.15)#1,627 |
| 69. | San Pasqual | 10.4% | 3.7%(+6.75)#69 | 4.3%(+6.12)#1,639 |
| 70. | Catheys Valley | 10.4% | 3.7%(+6.70)#70 | 4.3%(+6.07)#1,655 |
| 71. | Shasta | 10.3% | 3.7%(+6.68)#71 | 4.3%(+6.06)#1,660 |
| 72. | San Marino | 10.3% | 3.7%(+6.60)#72 | 4.3%(+5.98)#1,696 |
| 73. | Hidden Meadows | 10.2% | 3.7%(+6.50)#73 | 4.3%(+5.87)#1,731 |
| 74. | Granite Bay | 10.1% | 3.7%(+6.42)#74 | 4.3%(+5.79)#1,753 |
| 75. | Waterloo | 10.1% | 3.7%(+6.41)#75 | 4.3%(+5.78)#1,755 |
| 76. | Cerritos | 10.1% | 3.7%(+6.39)#76 | 4.3%(+5.77)#1,761 |
| 77. | Desert Center | 10.0% | 3.7%(+6.34)#77 | 4.3%(+5.71)#1,790 |
| 78. | Ballard | 9.9% | 3.7%(+6.26)#78 | 4.3%(+5.64)#1,823 |
| 79. | Ferndale | 9.9% | 3.7%(+6.24)#79 | 4.3%(+5.61)#1,838 |
| 80. | East Oakdale | 9.9% | 3.7%(+6.24)#80 | 4.3%(+5.61)#1,839 |
| 81. | La Canada Flintridge | 9.9% | 3.7%(+6.22)#81 | 4.3%(+5.60)#1,841 |
| 82. | Jones Valley | 9.8% | 3.7%(+6.14)#82 | 4.3%(+5.52)#1,868 |
| 83. | Callender | 9.8% | 3.7%(+6.11)#83 | 4.3%(+5.49)#1,891 |
| 84. | San Geronimo | 9.7% | 3.7%(+6.07)#84 | 4.3%(+5.45)#1,906 |
| 85. | Reliez Valley | 9.7% | 3.7%(+6.05)#85 | 4.3%(+5.43)#1,915 |
| 86. | French Gulch | 9.7% | 3.7%(+6.05)#86 | 4.3%(+5.42)#1,917 |
| 87. | Bakersfield Country Club | 9.7% | 3.7%(+6.04)#87 | 4.3%(+5.42)#1,918 |
| 88. | Loyola | 9.7% | 3.7%(+6.01)#88 | 4.3%(+5.38)#1,928 |
| 89. | Portola Valley | 9.6% | 3.7%(+5.98)#89 | 4.3%(+5.35)#1,937 |
| 90. | Penngrove | 9.6% | 3.7%(+5.97)#90 | 4.3%(+5.34)#1,947 |
| 91. | Hickman | 9.6% | 3.7%(+5.92)#91 | 4.3%(+5.30)#1,969 |
| 92. | Penn Valley | 9.6% | 3.7%(+5.90)#92 | 4.3%(+5.28)#1,985 |
| 93. | Palo Cedro | 9.5% | 3.7%(+5.81)#93 | 4.3%(+5.18)#2,023 |
| 94. | Rancho Santa Fe | 9.5% | 3.7%(+5.80)#94 | 4.3%(+5.17)#2,031 |
| 95. | Day Valley | 9.5% | 3.7%(+5.79)#95 | 4.3%(+5.17)#2,035 |
| 96. | Toro Canyon | 9.4% | 3.7%(+5.69)#96 | 4.3%(+5.07)#2,085 |
| 97. | Hillsborough | 9.3% | 3.7%(+5.64)#97 | 4.3%(+5.02)#2,106 |
| 98. | Sleepy Hollow | 9.2% | 3.7%(+5.58)#98 | 4.3%(+4.95)#2,144 |
| 99. | Rancho Palos Verdes | 9.2% | 3.7%(+5.50)#99 | 4.3%(+4.88)#2,179 |
| 100. | Kentfield | 9.1% | 3.7%(+5.48)#100 | 4.3%(+4.85)#2,189 |
Common Questions
What are the Top 10 Cities with the Highest Percentage of Population Employed in Health Technologists in California?
Top 10 Cities with the Highest Percentage of Population Employed in Health Technologists in California are:
#1
100.0%
#2
100.0%
#3
53.3%
#4
50.8%
#5
50.5%
#6
44.4%
#7
35.9%
#8
33.3%
#9
27.1%
#10
25.3%
What city has the Highest Percentage of Population Employed in Health Technologists in California?
Gold Mountain has the Highest Percentage of Population Employed in Health Technologists in California with 100.0%.
What is the Percentage of Population Employed in Health Technologists in the State of California?
Percentage of Population Employed in Health Technologists in California is 3.7%.
What is the Percentage of Population Employed in Health Technologists in the United States?
Percentage of Population Employed in Health Technologists in the United States is 4.3%.