Cities with the Highest Percentage of Immigrants from El Salvador in California
RELATED REPORTS & OPTIONS
El Salvador
California
Compare Cities
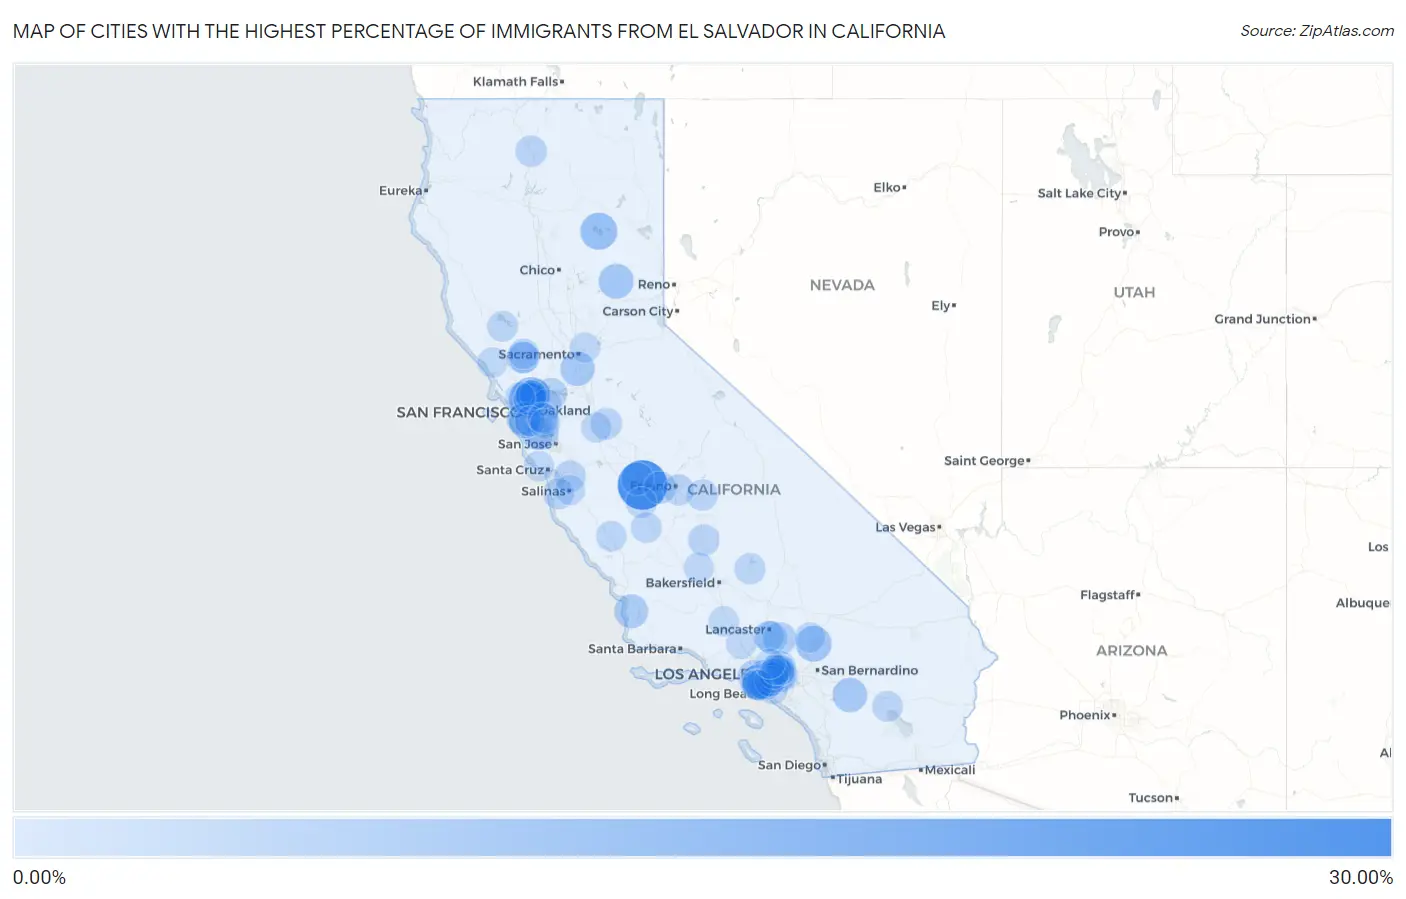
Map of Cities with the Highest Percentage of Immigrants from El Salvador in California
0.00%
30.00%
Cities with the Highest Percentage of Immigrants from El Salvador in California
| City | El Salvador | vs State | vs National | |
| 1. | Mendota | 25.99% | 1.12%(+24.9)#-1 | 0.43%(+25.6)#0 |
| 2. | Montalvin Manor | 11.48% | 1.12%(+10.4)#0 | 0.43%(+11.1)#1 |
| 3. | North Richmond | 10.85% | 1.12%(+9.73)#1 | 0.43%(+10.4)#2 |
| 4. | Lake Almanor Country Club | 10.02% | 1.12%(+8.90)#2 | 0.43%(+9.59)#3 |
| 5. | Mountain View Acres | 8.82% | 1.12%(+7.70)#3 | 0.43%(+8.40)#4 |
| 6. | Rollingwood | 7.75% | 1.12%(+6.63)#4 | 0.43%(+7.33)#5 |
| 7. | Downieville | 7.62% | 1.12%(+6.50)#5 | 0.43%(+7.19)#6 |
| 8. | Westmont | 7.31% | 1.12%(+6.19)#6 | 0.43%(+6.89)#7 |
| 9. | Vernon | 7.29% | 1.12%(+6.18)#7 | 0.43%(+6.87)#8 |
| 10. | Idyllwild Pine Cove | 7.02% | 1.12%(+5.90)#8 | 0.43%(+6.59)#9 |
| 11. | Hood | 7.01% | 1.12%(+5.89)#9 | 0.43%(+6.58)#10 |
| 12. | Colma | 6.83% | 1.12%(+5.71)#10 | 0.43%(+6.41)#11 |
| 13. | Florence Graham | 6.48% | 1.12%(+5.36)#11 | 0.43%(+6.06)#12 |
| 14. | Guadalupe | 6.20% | 1.12%(+5.08)#12 | 0.43%(+5.78)#13 |
| 15. | Cudahy | 5.87% | 1.12%(+4.75)#13 | 0.43%(+5.44)#14 |
| 16. | Maywood | 5.24% | 1.12%(+4.12)#14 | 0.43%(+4.81)#15 |
| 17. | Sun Village | 5.10% | 1.12%(+3.98)#15 | 0.43%(+4.67)#16 |
| 18. | Huntington Park | 5.08% | 1.12%(+3.96)#16 | 0.43%(+4.65)#17 |
| 19. | Walnut Park | 5.05% | 1.12%(+3.93)#17 | 0.43%(+4.62)#18 |
| 20. | Lynwood | 4.92% | 1.12%(+3.80)#68 | 0.43%(+4.49)#1,798 |
| 21. | Richmond | 4.88% | 1.12%(+3.76)#69 | 0.43%(+4.46)#1,799 |
| 22. | Bell | 4.69% | 1.12%(+3.57)#70 | 0.43%(+4.27)#1,800 |
| 23. | Willowbrook | 4.63% | 1.12%(+3.51)#71 | 0.43%(+4.21)#1,801 |
| 24. | Firebaugh | 4.63% | 1.12%(+3.51)#72 | 0.43%(+4.21)#1,802 |
| 25. | Palmdale | 4.58% | 1.12%(+3.46)#73 | 0.43%(+4.15)#1,803 |
| 26. | San Pablo | 4.45% | 1.12%(+3.33)#74 | 0.43%(+4.03)#1,804 |
| 27. | Los Angeles | 4.34% | 1.12%(+3.22)#75 | 0.43%(+3.91)#1,805 |
| 28. | Kerman | 4.22% | 1.12%(+3.11)#76 | 0.43%(+3.80)#1,806 |
| 29. | East Palo Alto | 4.07% | 1.12%(+2.95)#77 | 0.43%(+3.64)#1,807 |
| 30. | Bell Gardens | 4.02% | 1.12%(+2.90)#78 | 0.43%(+3.59)#1,808 |
| 31. | North Fair Oaks | 3.90% | 1.12%(+2.78)#79 | 0.43%(+3.47)#1,809 |
| 32. | Daly City | 3.89% | 1.12%(+2.77)#80 | 0.43%(+3.47)#1,810 |
| 33. | Deer Park | 3.71% | 1.12%(+2.59)#81 | 0.43%(+3.29)#1,811 |
| 34. | Whitmore | 3.68% | 1.12%(+2.56)#82 | 0.43%(+3.25)#1,812 |
| 35. | San Bruno | 3.64% | 1.12%(+2.52)#83 | 0.43%(+3.22)#1,813 |
| 36. | Rouse | 3.59% | 1.12%(+2.47)#84 | 0.43%(+3.16)#1,814 |
| 37. | Pixley | 3.57% | 1.12%(+2.45)#85 | 0.43%(+3.14)#1,815 |
| 38. | Aromas | 3.50% | 1.12%(+2.38)#86 | 0.43%(+3.07)#1,816 |
| 39. | Lennox | 3.48% | 1.12%(+2.36)#87 | 0.43%(+3.05)#1,817 |
| 40. | Bay Point | 3.46% | 1.12%(+2.34)#88 | 0.43%(+3.04)#1,818 |
| 41. | Industry | 3.42% | 1.12%(+2.30)#89 | 0.43%(+2.99)#1,819 |
| 42. | Mount Shasta | 3.37% | 1.12%(+2.25)#90 | 0.43%(+2.94)#1,820 |
| 43. | La Puente | 3.37% | 1.12%(+2.25)#91 | 0.43%(+2.94)#1,821 |
| 44. | Tara Hills | 3.33% | 1.12%(+2.21)#92 | 0.43%(+2.90)#1,822 |
| 45. | Castle Hill | 3.27% | 1.12%(+2.15)#93 | 0.43%(+2.84)#1,823 |
| 46. | South Gate | 3.25% | 1.12%(+2.13)#94 | 0.43%(+2.83)#1,824 |
| 47. | Commerce | 3.23% | 1.12%(+2.11)#95 | 0.43%(+2.81)#1,825 |
| 48. | Orange Cove | 3.17% | 1.12%(+2.05)#96 | 0.43%(+2.74)#1,826 |
| 49. | South San Jose Hills | 3.10% | 1.12%(+1.98)#97 | 0.43%(+2.67)#1,827 |
| 50. | Bodfish | 3.06% | 1.12%(+1.94)#98 | 0.43%(+2.63)#1,828 |
| 51. | St Helena | 3.04% | 1.12%(+1.92)#99 | 0.43%(+2.62)#1,829 |
| 52. | Inglewood | 3.01% | 1.12%(+1.89)#100 | 0.43%(+2.58)#1,830 |
| 53. | Malaga | 2.92% | 1.12%(+1.80)#101 | 0.43%(+2.50)#1,831 |
| 54. | Montebello | 2.92% | 1.12%(+1.80)#102 | 0.43%(+2.49)#1,832 |
| 55. | Lawndale | 2.89% | 1.12%(+1.77)#103 | 0.43%(+2.46)#1,833 |
| 56. | Duarte | 2.89% | 1.12%(+1.77)#104 | 0.43%(+2.46)#1,834 |
| 57. | Seaside | 2.83% | 1.12%(+1.71)#105 | 0.43%(+2.40)#1,835 |
| 58. | Desert View Highlands | 2.78% | 1.12%(+1.66)#106 | 0.43%(+2.35)#1,836 |
| 59. | South Monrovia Island | 2.77% | 1.12%(+1.65)#107 | 0.43%(+2.34)#1,837 |
| 60. | Three Rocks | 2.76% | 1.12%(+1.64)#108 | 0.43%(+2.34)#1,838 |
| 61. | Hawaiian Gardens | 2.75% | 1.12%(+1.63)#109 | 0.43%(+2.32)#1,839 |
| 62. | Coalinga | 2.72% | 1.12%(+1.60)#110 | 0.43%(+2.30)#1,840 |
| 63. | West Puente Valley | 2.70% | 1.12%(+1.58)#111 | 0.43%(+2.27)#1,841 |
| 64. | Kelseyville | 2.69% | 1.12%(+1.57)#112 | 0.43%(+2.27)#1,842 |
| 65. | Irwindale | 2.68% | 1.12%(+1.56)#113 | 0.43%(+2.26)#1,843 |
| 66. | Mecca | 2.66% | 1.12%(+1.54)#114 | 0.43%(+2.24)#1,844 |
| 67. | Hawthorne | 2.60% | 1.12%(+1.48)#115 | 0.43%(+2.17)#1,845 |
| 68. | Baldwin Park | 2.55% | 1.12%(+1.44)#116 | 0.43%(+2.13)#1,846 |
| 69. | Paramount | 2.53% | 1.12%(+1.41)#117 | 0.43%(+2.11)#1,847 |
| 70. | Compton | 2.50% | 1.12%(+1.39)#118 | 0.43%(+2.08)#1,848 |
| 71. | Pico Rivera | 2.48% | 1.12%(+1.36)#119 | 0.43%(+2.06)#1,849 |
| 72. | West Rancho Dominguez | 2.44% | 1.12%(+1.32)#120 | 0.43%(+2.01)#1,850 |
| 73. | San Ardo | 2.40% | 1.12%(+1.29)#121 | 0.43%(+1.98)#1,851 |
| 74. | Angwin | 2.31% | 1.12%(+1.19)#122 | 0.43%(+1.88)#1,852 |
| 75. | Pinole | 2.30% | 1.12%(+1.18)#123 | 0.43%(+1.88)#1,853 |
| 76. | Cherryland | 2.29% | 1.12%(+1.17)#124 | 0.43%(+1.87)#1,854 |
| 77. | Grayson | 2.26% | 1.12%(+1.14)#125 | 0.43%(+1.83)#1,855 |
| 78. | Rodeo | 2.25% | 1.12%(+1.13)#126 | 0.43%(+1.82)#1,856 |
| 79. | Frazier Park | 2.24% | 1.12%(+1.12)#127 | 0.43%(+1.82)#1,857 |
| 80. | Castaic | 2.24% | 1.12%(+1.12)#128 | 0.43%(+1.82)#1,858 |
| 81. | North Highlands | 2.21% | 1.12%(+1.09)#129 | 0.43%(+1.78)#1,859 |
| 82. | Monte Rio | 2.20% | 1.12%(+1.09)#130 | 0.43%(+1.78)#1,860 |
| 83. | Gardena | 2.20% | 1.12%(+1.08)#131 | 0.43%(+1.77)#1,861 |
| 84. | Adelanto | 2.19% | 1.12%(+1.07)#132 | 0.43%(+1.76)#1,862 |
| 85. | Lake Shastina | 2.16% | 1.12%(+1.04)#133 | 0.43%(+1.74)#1,863 |
| 86. | Downey | 2.16% | 1.12%(+1.04)#134 | 0.43%(+1.73)#1,864 |
| 87. | Davenport | 2.15% | 1.12%(+1.04)#135 | 0.43%(+1.73)#1,865 |
| 88. | Vincent | 2.13% | 1.12%(+1.01)#136 | 0.43%(+1.70)#1,866 |
| 89. | El Sobrante Cdp Contra Costa County | 2.08% | 1.12%(+0.959)#137 | 0.43%(+1.65)#1,867 |
| 90. | San Rafael | 2.07% | 1.12%(+0.949)#138 | 0.43%(+1.64)#1,868 |
| 91. | South El Monte | 2.05% | 1.12%(+0.933)#139 | 0.43%(+1.63)#1,869 |
| 92. | Wasco | 2.03% | 1.12%(+0.910)#140 | 0.43%(+1.60)#1,870 |
| 93. | Alondra Park | 2.01% | 1.12%(+0.890)#141 | 0.43%(+1.58)#1,871 |
| 94. | North El Monte | 2.01% | 1.12%(+0.890)#142 | 0.43%(+1.58)#1,872 |
| 95. | South San Francisco | 2.00% | 1.12%(+0.880)#143 | 0.43%(+1.57)#1,873 |
| 96. | Ashland | 1.97% | 1.12%(+0.854)#144 | 0.43%(+1.55)#1,874 |
| 97. | Salinas | 1.96% | 1.12%(+0.843)#145 | 0.43%(+1.54)#1,875 |
| 98. | East Niles | 1.95% | 1.12%(+0.836)#146 | 0.43%(+1.53)#1,876 |
| 99. | Altadena | 1.93% | 1.12%(+0.812)#147 | 0.43%(+1.51)#1,877 |
| 100. | Hayward | 1.92% | 1.12%(+0.804)#148 | 0.43%(+1.50)#1,878 |
Common Questions
What are the Top 10 Cities with the Highest Percentage of Immigrants from El Salvador in California?
Top 10 Cities with the Highest Percentage of Immigrants from El Salvador in California are:
#1
25.99%
#2
11.48%
#3
10.85%
#4
10.02%
#5
8.82%
#6
7.75%
#7
7.62%
#8
7.31%
#9
7.29%
#10
7.02%
What city has the Highest Percentage of Immigrants from El Salvador in California?
Mendota has the Highest Percentage of Immigrants from El Salvador in California with 25.99%.
What is the Percentage of Immigrants from El Salvador in the State of California?
Percentage of Immigrants from El Salvador in California is 1.12%.
What is the Percentage of Immigrants from El Salvador in the United States?
Percentage of Immigrants from El Salvador in the United States is 0.43%.