Walker, CA Map & Demographics
Walker Map
Walker Overview
$36,828
PER CAPITA INCOME
$55,119
AVG FAMILY INCOME
$55,149
AVG HOUSEHOLD INCOME
0.51
INEQUALITY / GINI INDEX
499
TOTAL POPULATION
256
MALE POPULATION
243
FEMALE POPULATION
105.35
MALES / 100 FEMALES
94.92
FEMALES / 100 MALES
66.0
MEDIAN AGE
2.3
AVG FAMILY SIZE
2.0
AVG HOUSEHOLD SIZE
117
LABOR FORCE [ PEOPLE ]
23.4%
PERCENT IN LABOR FORCE
Income in Walker
Income Overview in Walker
Per Capita Income in Walker is $36,828, while median incomes of families and households are $55,119 and $55,149 respectively.
| Characteristic | Number | Measure |
| Per Capita Income | 499 | $36,828 |
| Median Family Income | 172 | $55,119 |
| Mean Family Income | 172 | $60,932 |
| Median Household Income | 229 | $55,149 |
| Mean Household Income | 229 | $74,107 |
| Income Deficit | 172 | $0 |
| Wage / Income Gap (%) | 499 | 0.00% |
| Wage / Income Gap ($) | 499 | 100.00¢ per $1 |
| Gini / Inequality Index | 499 | 0.51 |
Earnings by Sex in Walker
| Sex | Number | Average Earnings |
| Male | 156 (80.8%) | $0 |
| Female | 37 (19.2%) | $0 |
| Total | 193 (100.0%) | $0 |
Earnings by Sex by Income Bracket in Walker
The most common earnings brackets in Walker are $5,000 to $7,499 for men (76 | 48.7%) and $35,000 to $39,999 for women (15 | 40.5%).
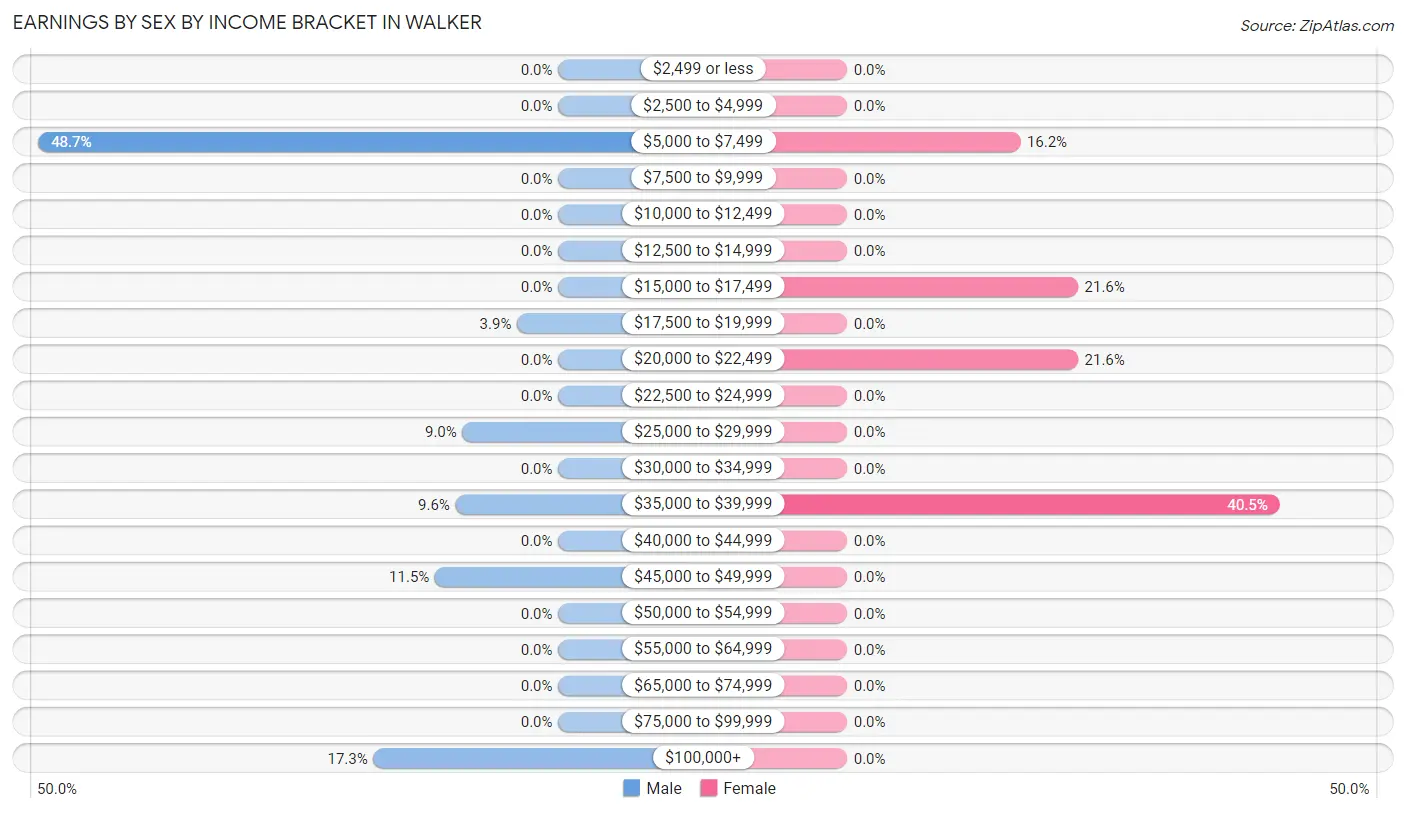
| Income | Male | Female |
| $2,499 or less | 0 (0.0%) | 0 (0.0%) |
| $2,500 to $4,999 | 0 (0.0%) | 0 (0.0%) |
| $5,000 to $7,499 | 76 (48.7%) | 6 (16.2%) |
| $7,500 to $9,999 | 0 (0.0%) | 0 (0.0%) |
| $10,000 to $12,499 | 0 (0.0%) | 0 (0.0%) |
| $12,500 to $14,999 | 0 (0.0%) | 0 (0.0%) |
| $15,000 to $17,499 | 0 (0.0%) | 8 (21.6%) |
| $17,500 to $19,999 | 6 (3.8%) | 0 (0.0%) |
| $20,000 to $22,499 | 0 (0.0%) | 8 (21.6%) |
| $22,500 to $24,999 | 0 (0.0%) | 0 (0.0%) |
| $25,000 to $29,999 | 14 (9.0%) | 0 (0.0%) |
| $30,000 to $34,999 | 0 (0.0%) | 0 (0.0%) |
| $35,000 to $39,999 | 15 (9.6%) | 15 (40.5%) |
| $40,000 to $44,999 | 0 (0.0%) | 0 (0.0%) |
| $45,000 to $49,999 | 18 (11.5%) | 0 (0.0%) |
| $50,000 to $54,999 | 0 (0.0%) | 0 (0.0%) |
| $55,000 to $64,999 | 0 (0.0%) | 0 (0.0%) |
| $65,000 to $74,999 | 0 (0.0%) | 0 (0.0%) |
| $75,000 to $99,999 | 0 (0.0%) | 0 (0.0%) |
| $100,000+ | 27 (17.3%) | 0 (0.0%) |
| Total | 156 (100.0%) | 37 (100.0%) |
Earnings by Sex by Educational Attainment in Walker
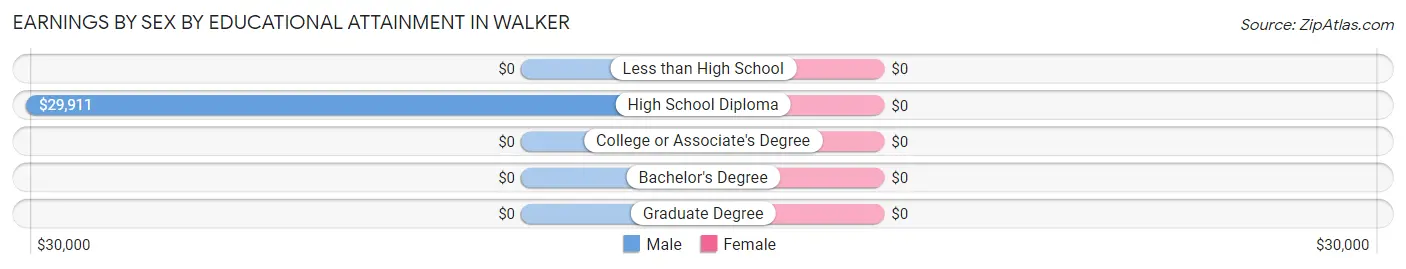
| Educational Attainment | Male Income | Female Income |
| Less than High School | - | - |
| High School Diploma | $29,911 | $0 |
| College or Associate's Degree | - | - |
| Bachelor's Degree | - | - |
| Graduate Degree | - | - |
| Total | - | - |
Family Income in Walker
Family Income Brackets in Walker
According to the Walker family income data, there are 43 families falling into the less than $10,000 income range, which is the most common income bracket and makes up 25.0% of all families.
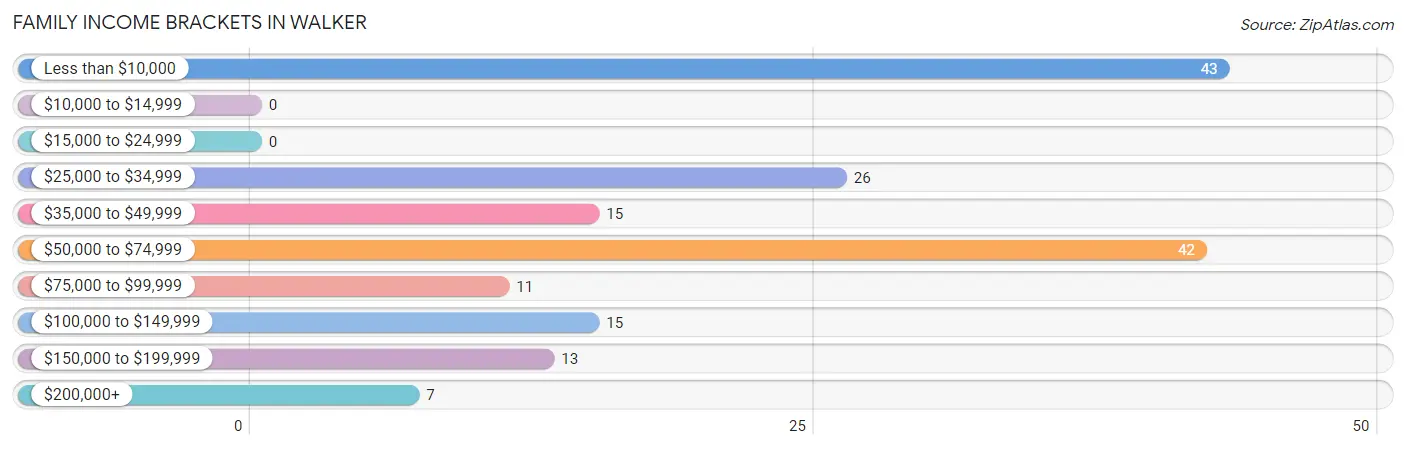
| Income Bracket | # Families | % Families |
| Less than $10,000 | 43 | 25.0% |
| $10,000 to $14,999 | 0 | 0.0% |
| $15,000 to $24,999 | 0 | 0.0% |
| $25,000 to $34,999 | 26 | 15.1% |
| $35,000 to $49,999 | 15 | 8.7% |
| $50,000 to $74,999 | 42 | 24.4% |
| $75,000 to $99,999 | 11 | 6.4% |
| $100,000 to $149,999 | 15 | 8.7% |
| $150,000 to $199,999 | 13 | 7.6% |
| $200,000+ | 7 | 4.1% |
Family Income by Famaliy Size in Walker
2-person families (157 | 91.3%) account for the highest median family income in Walker with $36,583 per family, while 2-person families (157 | 91.3%) have the highest median income of $18,292 per family member.
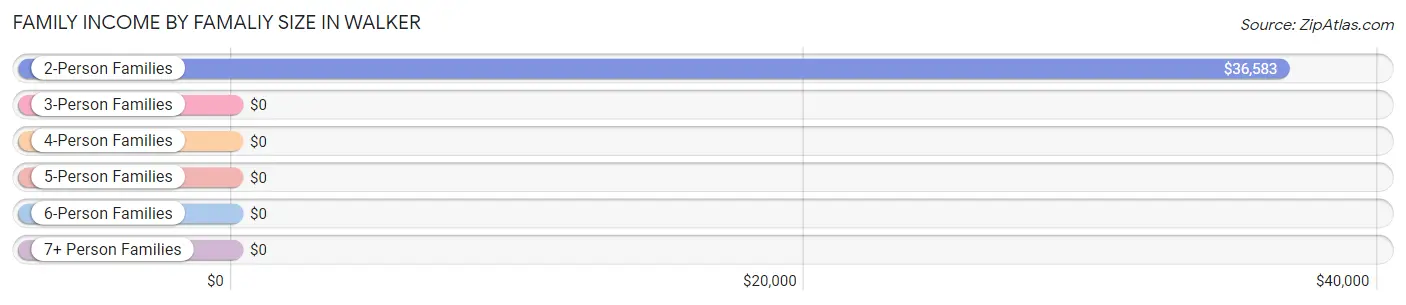
| Income Bracket | # Families | Median Income |
| 2-Person Families | 157 (91.3%) | $36,583 |
| 3-Person Families | 15 (8.7%) | $0 |
| 4-Person Families | 0 (0.0%) | $0 |
| 5-Person Families | 0 (0.0%) | $0 |
| 6-Person Families | 0 (0.0%) | $0 |
| 7+ Person Families | 0 (0.0%) | $0 |
| Total | 172 (100.0%) | $55,119 |
Family Income by Number of Earners in Walker
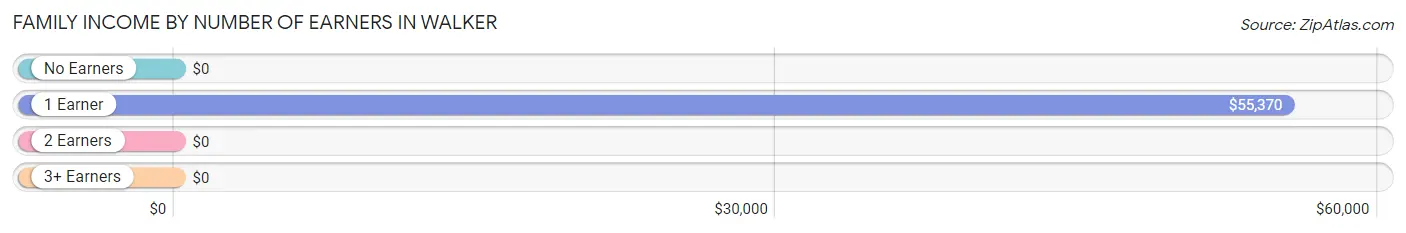
| Number of Earners | # Families | Median Income |
| No Earners | 82 (47.7%) | $0 |
| 1 Earner | 60 (34.9%) | $55,370 |
| 2 Earners | 30 (17.4%) | $0 |
| 3+ Earners | 0 (0.0%) | $0 |
| Total | 172 (100.0%) | $55,119 |
Household Income in Walker
Household Income Brackets in Walker
With 49 households falling in the category, the $50,000 to $74,999 income range is the most frequent in Walker, accounting for 21.4% of all households.
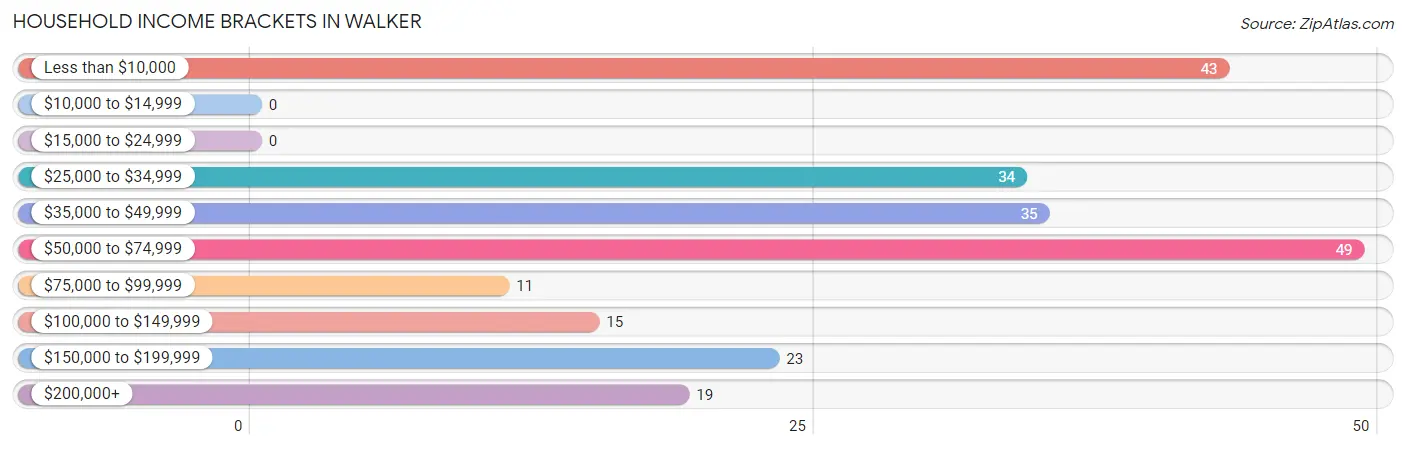
| Income Bracket | # Households | % Households |
| Less than $10,000 | 43 | 18.8% |
| $10,000 to $14,999 | 0 | 0.0% |
| $15,000 to $24,999 | 0 | 0.0% |
| $25,000 to $34,999 | 34 | 14.8% |
| $35,000 to $49,999 | 35 | 15.3% |
| $50,000 to $74,999 | 49 | 21.4% |
| $75,000 to $99,999 | 11 | 4.8% |
| $100,000 to $149,999 | 15 | 6.6% |
| $150,000 to $199,999 | 23 | 10.0% |
| $200,000+ | 19 | 8.3% |
Household Income by Householder Age in Walker
The median household income in Walker is $55,149, with the highest median household income of $55,192 found in the 65+ years age bracket for the primary householder. A total of 144 households (62.9%) fall into this category. Meanwhile, the 15 to 24 years age bracket for the primary householder has the lowest median household income of $0, with 15 households (6.6%) in this group.
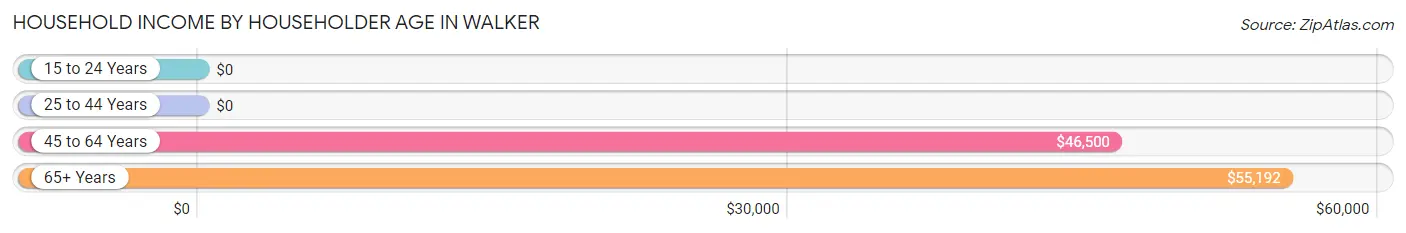
| Income Bracket | # Households | Median Income |
| 15 to 24 Years | 15 (6.6%) | $0 |
| 25 to 44 Years | 0 (0.0%) | $0 |
| 45 to 64 Years | 70 (30.6%) | $46,500 |
| 65+ Years | 144 (62.9%) | $55,192 |
| Total | 229 (100.0%) | $55,149 |
Poverty in Walker
Income Below Poverty by Sex and Age in Walker
With 10.9% poverty level for males and 31.7% for females among the residents of Walker, 75 year old and over males and 18 to 24 year old females are the most vulnerable to poverty, with 28 males (54.9%) and 31 females (67.4%) in their respective age groups living below the poverty level.
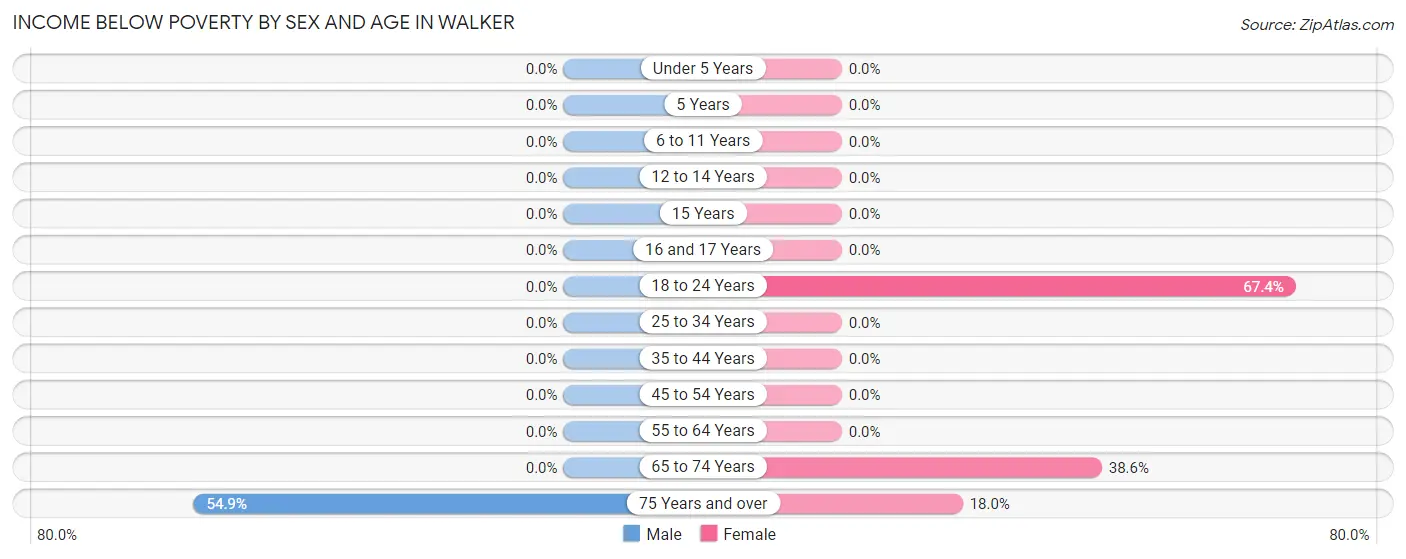
| Age Bracket | Male | Female |
| Under 5 Years | 0 (0.0%) | 0 (0.0%) |
| 5 Years | 0 (0.0%) | 0 (0.0%) |
| 6 to 11 Years | 0 (0.0%) | 0 (0.0%) |
| 12 to 14 Years | 0 (0.0%) | 0 (0.0%) |
| 15 Years | 0 (0.0%) | 0 (0.0%) |
| 16 and 17 Years | 0 (0.0%) | 0 (0.0%) |
| 18 to 24 Years | 0 (0.0%) | 31 (67.4%) |
| 25 to 34 Years | 0 (0.0%) | 0 (0.0%) |
| 35 to 44 Years | 0 (0.0%) | 0 (0.0%) |
| 45 to 54 Years | 0 (0.0%) | 0 (0.0%) |
| 55 to 64 Years | 0 (0.0%) | 0 (0.0%) |
| 65 to 74 Years | 0 (0.0%) | 39 (38.6%) |
| 75 Years and over | 28 (54.9%) | 7 (17.9%) |
| Total | 28 (10.9%) | 77 (31.7%) |
Income Above Poverty by Sex and Age in Walker
According to the poverty statistics in Walker, males aged 18 to 24 years and females aged 45 to 54 years are the age groups that are most secure financially, with 100.0% of males and 100.0% of females in these age groups living above the poverty line.
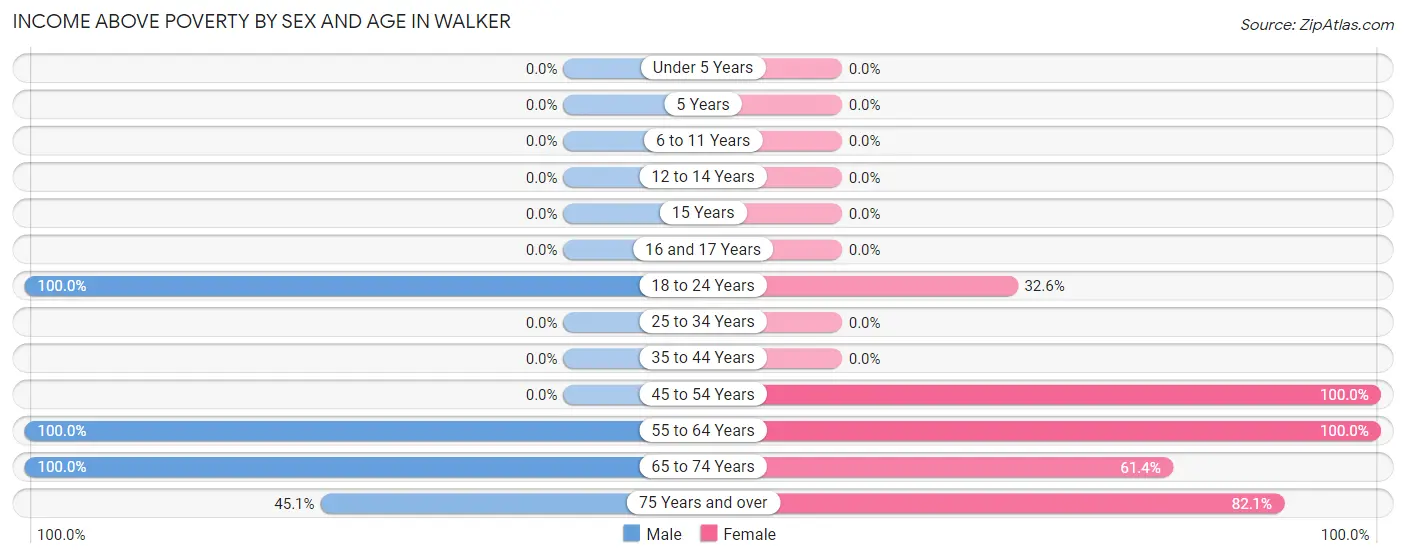
| Age Bracket | Male | Female |
| Under 5 Years | 0 (0.0%) | 0 (0.0%) |
| 5 Years | 0 (0.0%) | 0 (0.0%) |
| 6 to 11 Years | 0 (0.0%) | 0 (0.0%) |
| 12 to 14 Years | 0 (0.0%) | 0 (0.0%) |
| 15 Years | 0 (0.0%) | 0 (0.0%) |
| 16 and 17 Years | 0 (0.0%) | 0 (0.0%) |
| 18 to 24 Years | 68 (100.0%) | 15 (32.6%) |
| 25 to 34 Years | 0 (0.0%) | 0 (0.0%) |
| 35 to 44 Years | 0 (0.0%) | 0 (0.0%) |
| 45 to 54 Years | 0 (0.0%) | 22 (100.0%) |
| 55 to 64 Years | 73 (100.0%) | 35 (100.0%) |
| 65 to 74 Years | 64 (100.0%) | 62 (61.4%) |
| 75 Years and over | 23 (45.1%) | 32 (82.1%) |
| Total | 228 (89.1%) | 166 (68.3%) |
Income Below Poverty Among Married-Couple Families in Walker
The poverty statistics for married-couple families in Walker show that 25.0% or 43 of the total 172 families live below the poverty line. Families with no children have the highest poverty rate of 25.0%, comprising of 43 families. On the other hand, families with no children have the lowest poverty rate of 25.0%, which includes 43 families.
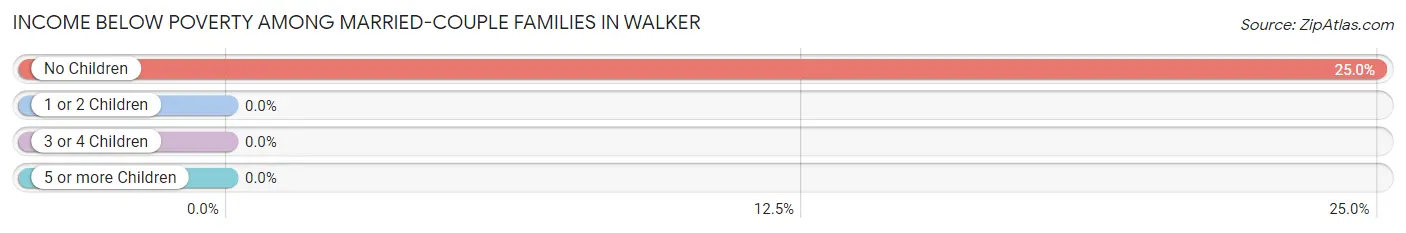
| Children | Above Poverty | Below Poverty |
| No Children | 129 (75.0%) | 43 (25.0%) |
| 1 or 2 Children | 0 (0.0%) | 0 (0.0%) |
| 3 or 4 Children | 0 (0.0%) | 0 (0.0%) |
| 5 or more Children | 0 (0.0%) | 0 (0.0%) |
| Total | 129 (75.0%) | 43 (25.0%) |
Income Below Poverty Among Single-Parent Households in Walker
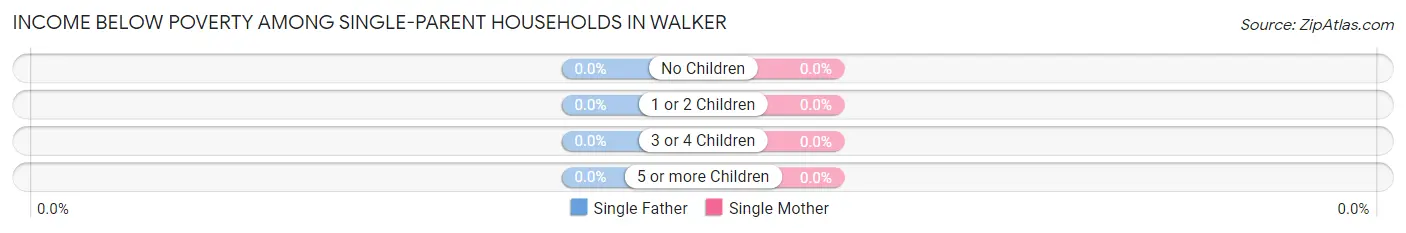
| Children | Single Father | Single Mother |
| No Children | 0 (0.0%) | 0 (0.0%) |
| 1 or 2 Children | 0 (0.0%) | 0 (0.0%) |
| 3 or 4 Children | 0 (0.0%) | 0 (0.0%) |
| 5 or more Children | 0 (0.0%) | 0 (0.0%) |
| Total | 0 (0.0%) | 0 (0.0%) |
Income Below Poverty Among Married-Couple vs Single-Parent Households in Walker
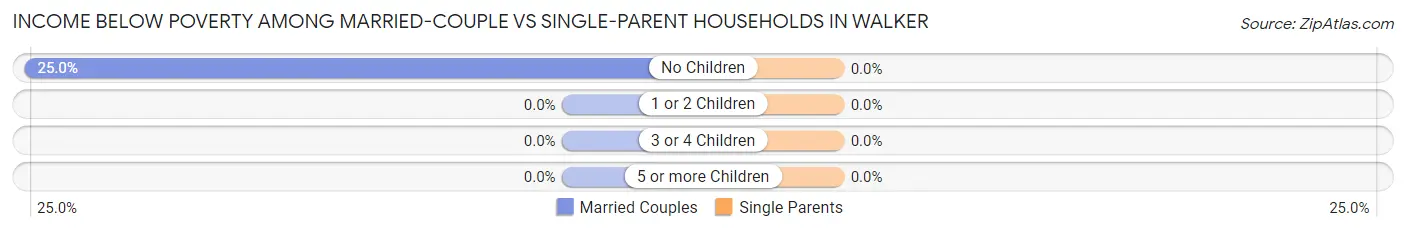
| Children | Married-Couple Families | Single-Parent Households |
| No Children | 43 (25.0%) | 0 (0.0%) |
| 1 or 2 Children | 0 (0.0%) | 0 (0.0%) |
| 3 or 4 Children | 0 (0.0%) | 0 (0.0%) |
| 5 or more Children | 0 (0.0%) | 0 (0.0%) |
| Total | 43 (25.0%) | 0 (0.0%) |
Race in Walker
The most populous races in Walker are White / Caucasian (485 | 97.2%), Hispanic or Latino (37 | 7.4%), and Two or more Races (8 | 1.6%).
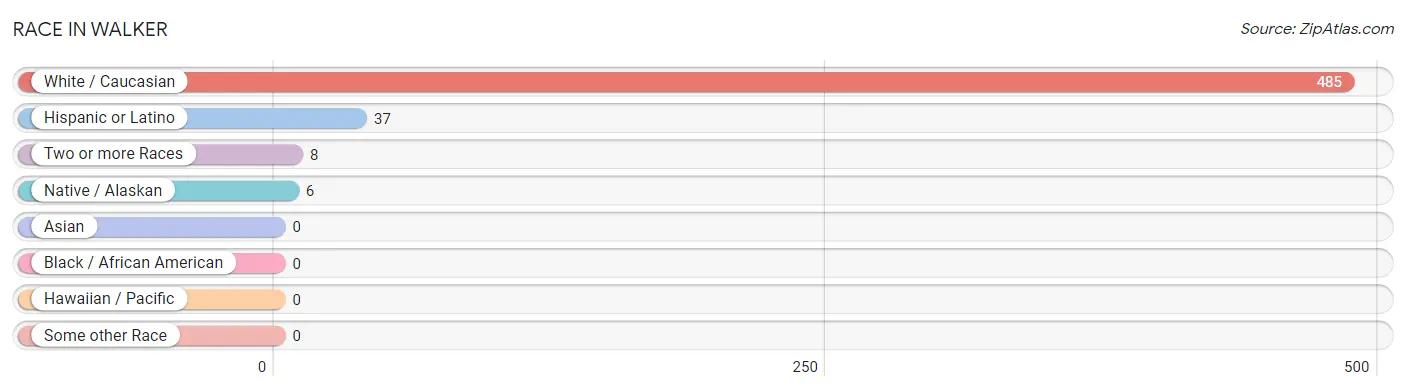
| Race | # Population | % Population |
| Asian | 0 | 0.0% |
| Black / African American | 0 | 0.0% |
| Hawaiian / Pacific | 0 | 0.0% |
| Hispanic or Latino | 37 | 7.4% |
| Native / Alaskan | 6 | 1.2% |
| White / Caucasian | 485 | 97.2% |
| Two or more Races | 8 | 1.6% |
| Some other Race | 0 | 0.0% |
| Total | 499 | 100.0% |
Ancestry in Walker
The most populous ancestries reported in Walker are English (149 | 29.9%), German (100 | 20.0%), Scottish (98 | 19.6%), Irish (72 | 14.4%), and French (52 | 10.4%), together accounting for 94.4% of all Walker residents.
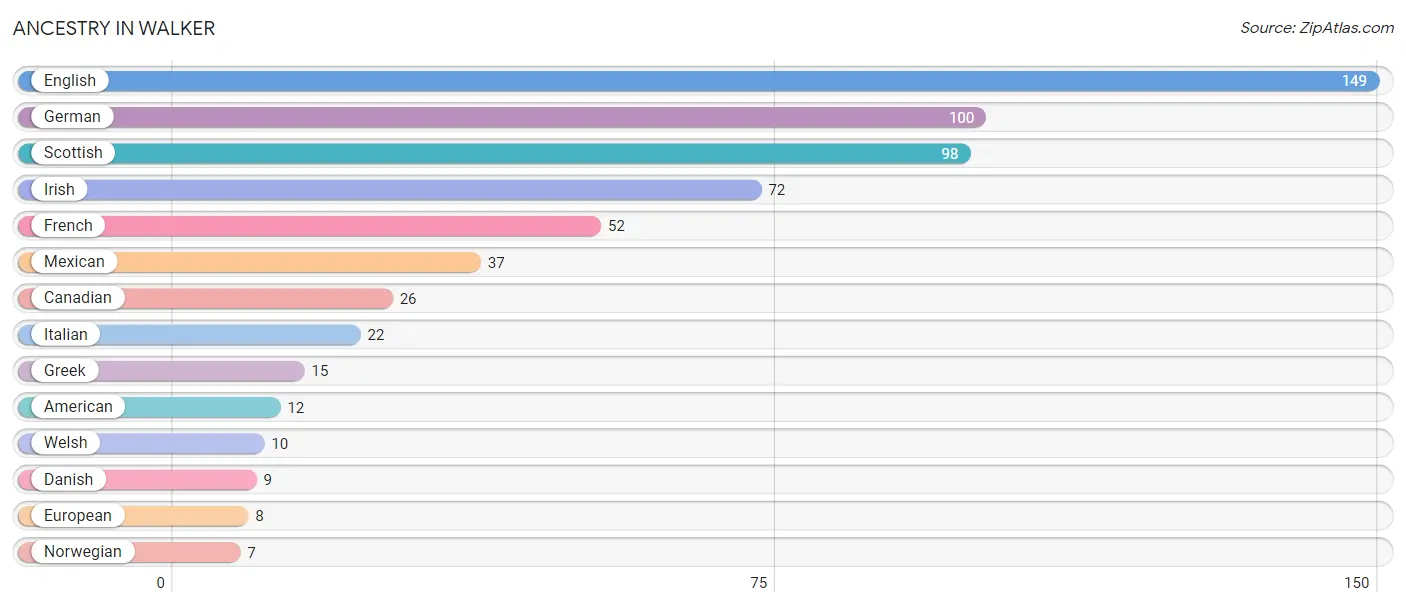
| Ancestry | # Population | % Population |
| American | 12 | 2.4% |
| Canadian | 26 | 5.2% |
| Danish | 9 | 1.8% |
| English | 149 | 29.9% |
| European | 8 | 1.6% |
| French | 52 | 10.4% |
| German | 100 | 20.0% |
| Greek | 15 | 3.0% |
| Irish | 72 | 14.4% |
| Italian | 22 | 4.4% |
| Mexican | 37 | 7.4% |
| Norwegian | 7 | 1.4% |
| Scottish | 98 | 19.6% |
| Welsh | 10 | 2.0% | View All 14 Rows |
Immigrants in Walker
The most numerous immigrant groups reported in Walker came from Europe (5 | 1.0%), Germany (5 | 1.0%), and Western Europe (5 | 1.0%), together accounting for 3.0% of all Walker residents.
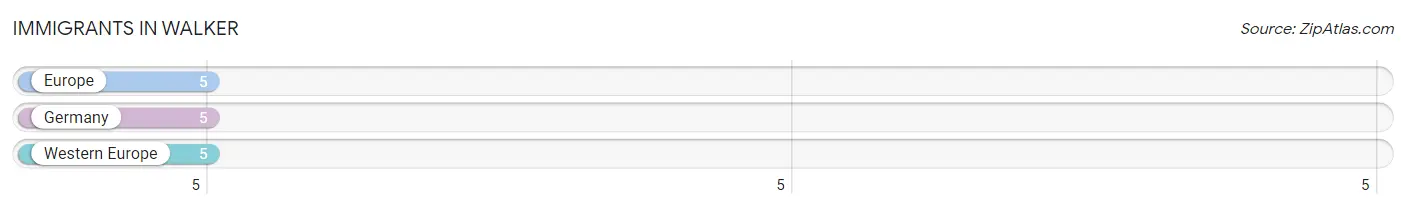
| Immigration Origin | # Population | % Population |
| Europe | 5 | 1.0% |
| Germany | 5 | 1.0% |
| Western Europe | 5 | 1.0% | View All 3 Rows |
Sex and Age in Walker
Sex and Age in Walker
The most populous age groups in Walker are 20 to 24 Years (68 | 26.6%) for men and 65 to 69 Years (83 | 34.2%) for women.
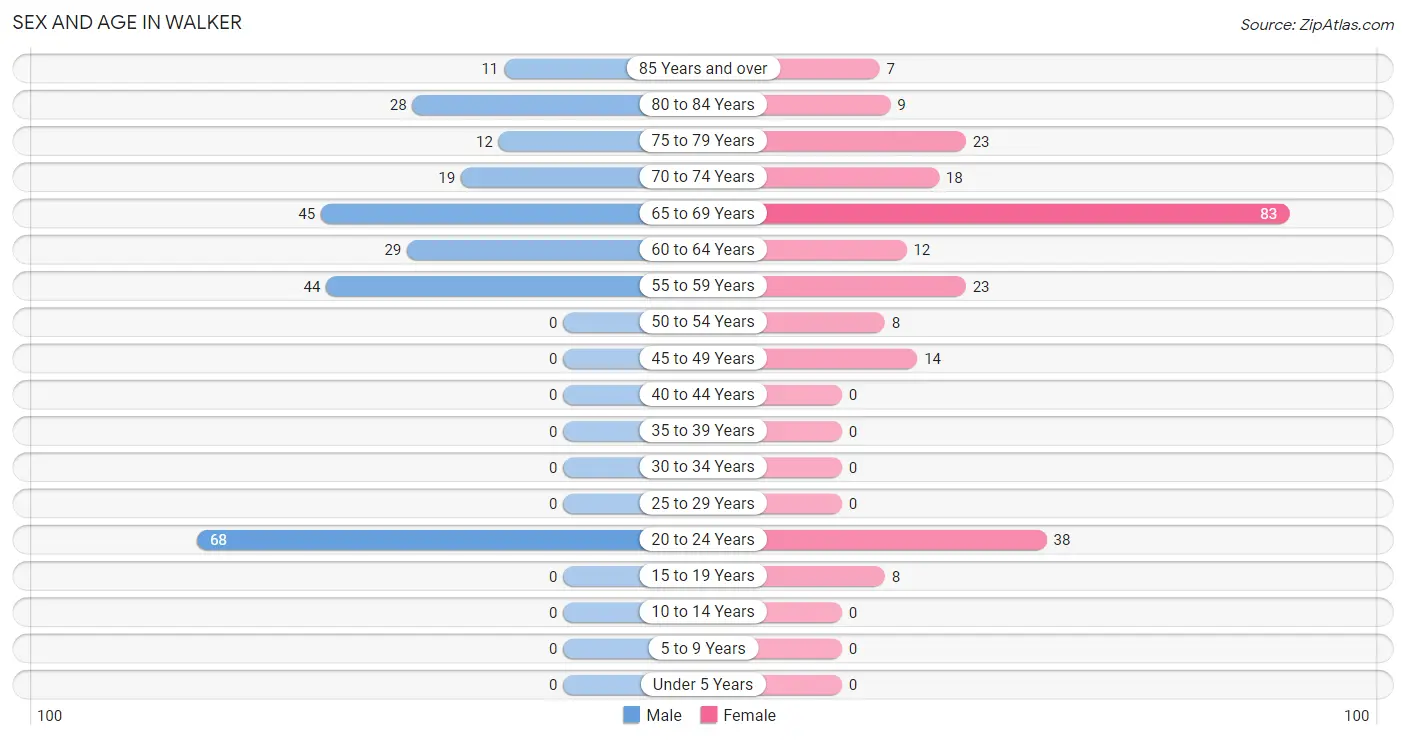
| Age Bracket | Male | Female |
| Under 5 Years | 0 (0.0%) | 0 (0.0%) |
| 5 to 9 Years | 0 (0.0%) | 0 (0.0%) |
| 10 to 14 Years | 0 (0.0%) | 0 (0.0%) |
| 15 to 19 Years | 0 (0.0%) | 8 (3.3%) |
| 20 to 24 Years | 68 (26.6%) | 38 (15.6%) |
| 25 to 29 Years | 0 (0.0%) | 0 (0.0%) |
| 30 to 34 Years | 0 (0.0%) | 0 (0.0%) |
| 35 to 39 Years | 0 (0.0%) | 0 (0.0%) |
| 40 to 44 Years | 0 (0.0%) | 0 (0.0%) |
| 45 to 49 Years | 0 (0.0%) | 14 (5.8%) |
| 50 to 54 Years | 0 (0.0%) | 8 (3.3%) |
| 55 to 59 Years | 44 (17.2%) | 23 (9.5%) |
| 60 to 64 Years | 29 (11.3%) | 12 (4.9%) |
| 65 to 69 Years | 45 (17.6%) | 83 (34.2%) |
| 70 to 74 Years | 19 (7.4%) | 18 (7.4%) |
| 75 to 79 Years | 12 (4.7%) | 23 (9.5%) |
| 80 to 84 Years | 28 (10.9%) | 9 (3.7%) |
| 85 Years and over | 11 (4.3%) | 7 (2.9%) |
| Total | 256 (100.0%) | 243 (100.0%) |
Families and Households in Walker
Median Family Size in Walker
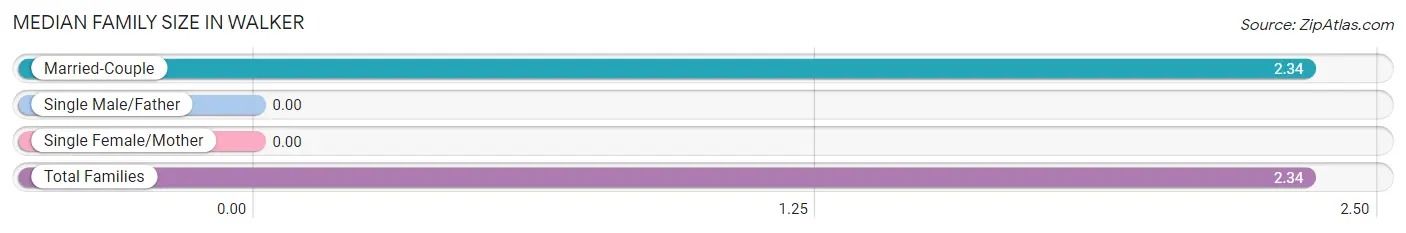
| Family Type | # Families | Family Size |
| Married-Couple | 172 (100.0%) | 2.34 |
| Single Male/Father | 0 (0.0%) | - |
| Single Female/Mother | 0 (0.0%) | - |
| Total Families | 172 (100.0%) | 2.34 |
Median Household Size in Walker
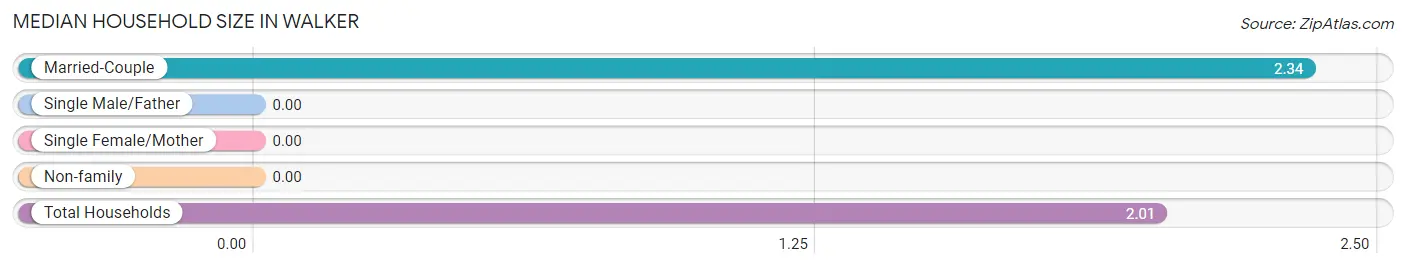
| Household Type | # Households | Household Size |
| Married-Couple | 172 (75.1%) | 2.34 |
| Single Male/Father | 0 (0.0%) | - |
| Single Female/Mother | 0 (0.0%) | - |
| Non-family | 57 (24.9%) | - |
| Total Households | 229 (100.0%) | 2.01 |
Household Size by Marriage Status in Walker
Out of a total of 229 households in Walker, 172 (75.1%) are family households, while 57 (24.9%) are nonfamily households. The most numerous type of family households are 2-person households, comprising 157, and the most common type of nonfamily households are 1-person households, comprising 57.
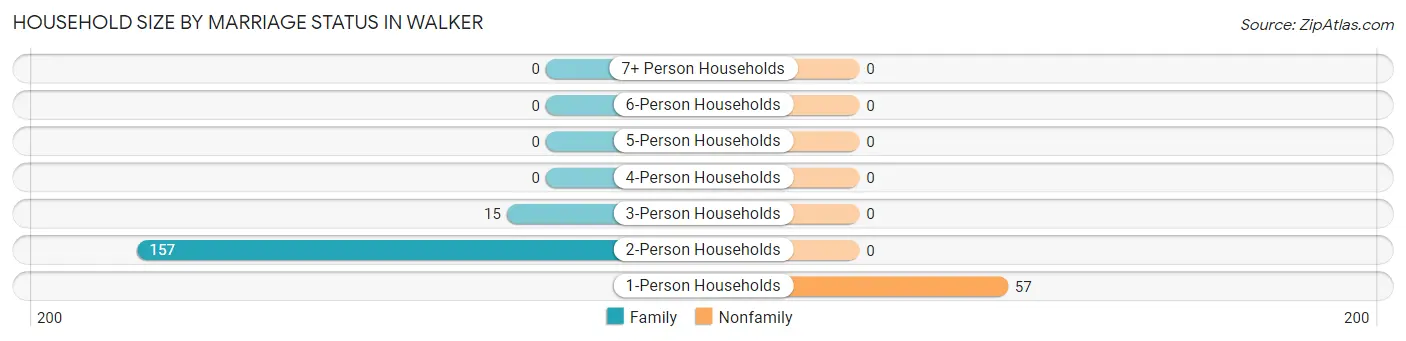
| Household Size | Family Households | Nonfamily Households |
| 1-Person Households | - | 57 (24.9%) |
| 2-Person Households | 157 (68.6%) | 0 (0.0%) |
| 3-Person Households | 15 (6.6%) | 0 (0.0%) |
| 4-Person Households | 0 (0.0%) | 0 (0.0%) |
| 5-Person Households | 0 (0.0%) | 0 (0.0%) |
| 6-Person Households | 0 (0.0%) | 0 (0.0%) |
| 7+ Person Households | 0 (0.0%) | 0 (0.0%) |
| Total | 172 (75.1%) | 57 (24.9%) |
Female Fertility in Walker
Fertility by Age in Walker
Average fertility rate in Walker is 250.0 births per 1,000 women. Women in the age bracket of 20 to 34 years have the highest fertility rate with 395.0 births per 1,000 women. Women in the age bracket of 20 to 34 years acount for 100.0% of all women with births.
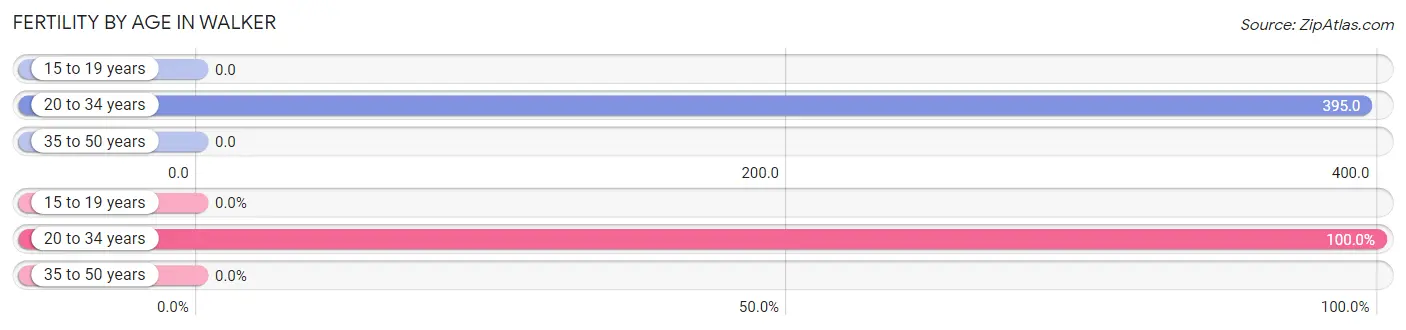
| Age Bracket | Women with Births | Births / 1,000 Women |
| 15 to 19 years | 0 (0.0%) | 0.0 |
| 20 to 34 years | 15 (100.0%) | 395.0 |
| 35 to 50 years | 0 (0.0%) | 0.0 |
| Total | 15 (100.0%) | 250.0 |
Fertility by Age by Marriage Status in Walker
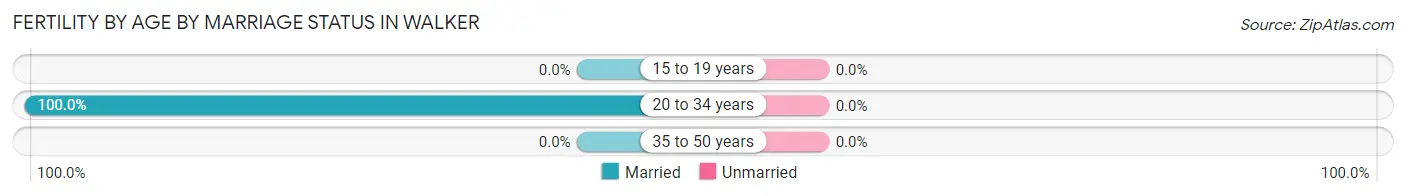
| Age Bracket | Married | Unmarried |
| 15 to 19 years | 0 (0.0%) | 0 (0.0%) |
| 20 to 34 years | 15 (100.0%) | 0 (0.0%) |
| 35 to 50 years | 0 (0.0%) | 0 (0.0%) |
| Total | 15 (100.0%) | 0 (0.0%) |
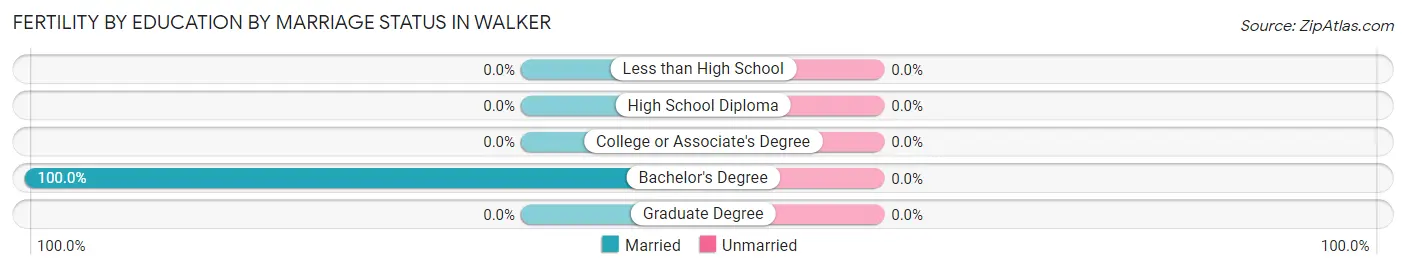
Fertility by Education in Walker
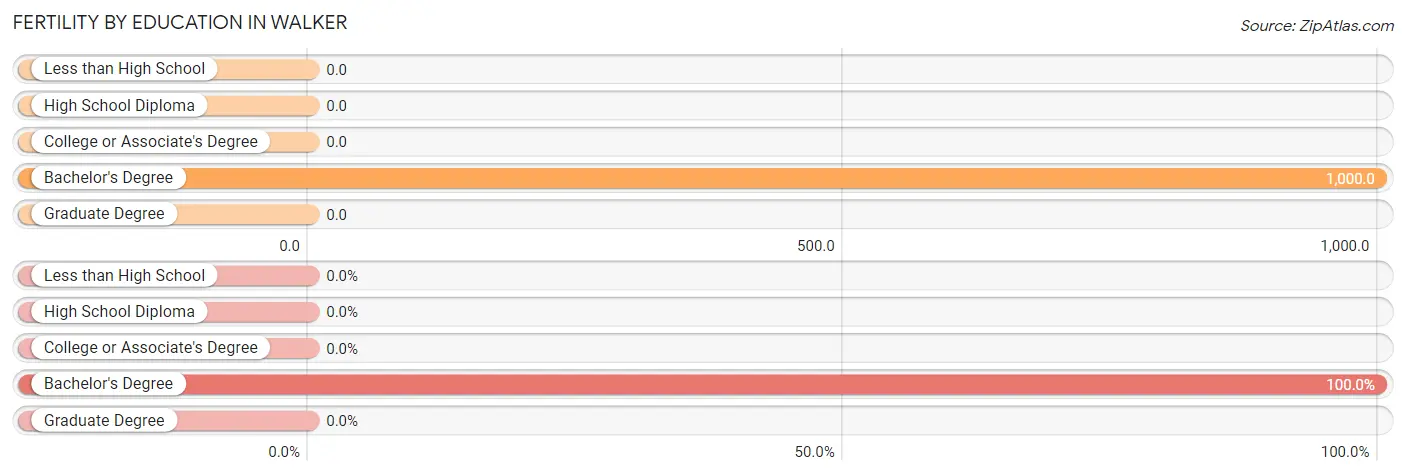
| Educational Attainment | Women with Births | Births / 1,000 Women |
| Less than High School | 0 (0.0%) | 0.0 |
| High School Diploma | 0 (0.0%) | 0.0 |
| College or Associate's Degree | 0 (0.0%) | 0.0 |
| Bachelor's Degree | 15 (100.0%) | 1,000.0 |
| Graduate Degree | 0 (0.0%) | 0.0 |
| Total | 15 (100.0%) | 250.0 |
Fertility by Education by Marriage Status in Walker
| Educational Attainment | Married | Unmarried |
| Less than High School | 0 (0.0%) | 0 (0.0%) |
| High School Diploma | 0 (0.0%) | 0 (0.0%) |
| College or Associate's Degree | 0 (0.0%) | 0 (0.0%) |
| Bachelor's Degree | 15 (100.0%) | 0 (0.0%) |
| Graduate Degree | 0 (0.0%) | 0 (0.0%) |
| Total | 15 (100.0%) | 0 (0.0%) |
Employment Characteristics in Walker
Employment by Class of Employer in Walker
Among the 95 employed individuals in Walker, private company employees (36 | 37.9%), local government employees (26 | 27.4%), and self-employed (not incorporated) (18 | 19.0%) make up the most common classes of employment.
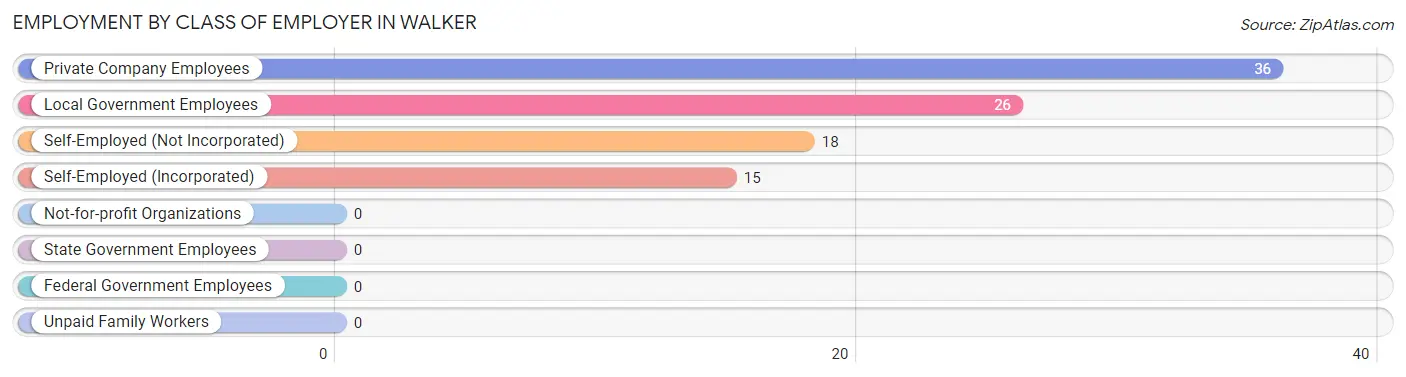
| Employer Class | # Employees | % Employees |
| Private Company Employees | 36 | 37.9% |
| Self-Employed (Incorporated) | 15 | 15.8% |
| Self-Employed (Not Incorporated) | 18 | 19.0% |
| Not-for-profit Organizations | 0 | 0.0% |
| Local Government Employees | 26 | 27.4% |
| State Government Employees | 0 | 0.0% |
| Federal Government Employees | 0 | 0.0% |
| Unpaid Family Workers | 0 | 0.0% |
| Total | 95 | 100.0% |
Employment Status by Age in Walker
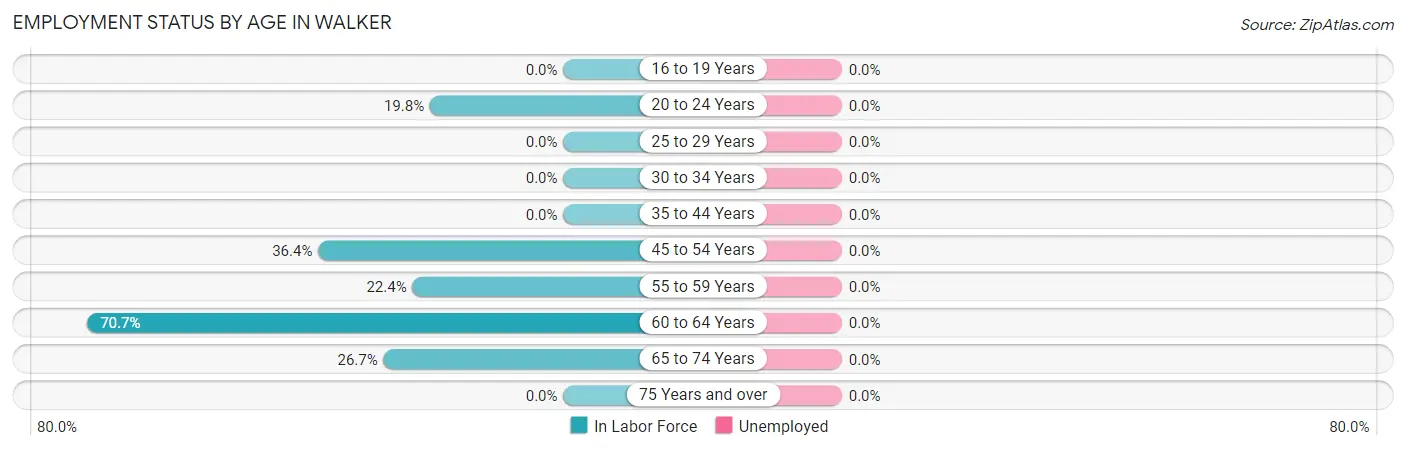
| Age Bracket | In Labor Force | Unemployed |
| 16 to 19 Years | 0 (0.0%) | 0 (0.0%) |
| 20 to 24 Years | 21 (19.8%) | 0 (0.0%) |
| 25 to 29 Years | 0 (0.0%) | 0 (0.0%) |
| 30 to 34 Years | 0 (0.0%) | 0 (0.0%) |
| 35 to 44 Years | 0 (0.0%) | 0 (0.0%) |
| 45 to 54 Years | 8 (36.4%) | 0 (0.0%) |
| 55 to 59 Years | 15 (22.4%) | 0 (0.0%) |
| 60 to 64 Years | 29 (70.7%) | 0 (0.0%) |
| 65 to 74 Years | 44 (26.7%) | 0 (0.0%) |
| 75 Years and over | 0 (0.0%) | 0 (0.0%) |
| Total | 117 (23.4%) | 0 (0.0%) |
Employment Status by Educational Attainment in Walker
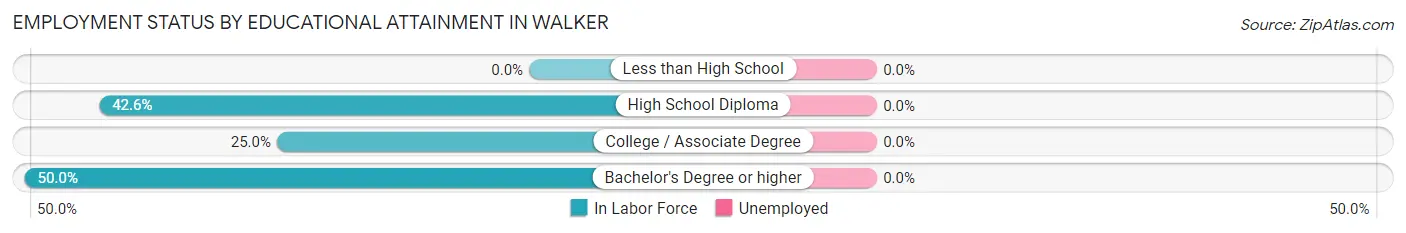
| Educational Attainment | In Labor Force | Unemployed |
| Less than High School | 0 (0.0%) | 0 (0.0%) |
| High School Diploma | 29 (42.6%) | 0 (0.0%) |
| College / Associate Degree | 8 (25.0%) | 0 (0.0%) |
| Bachelor's Degree or higher | 15 (50.0%) | 0 (0.0%) |
| Total | 52 (40.0%) | 0 (0.0%) |
Employment Occupations by Sex in Walker
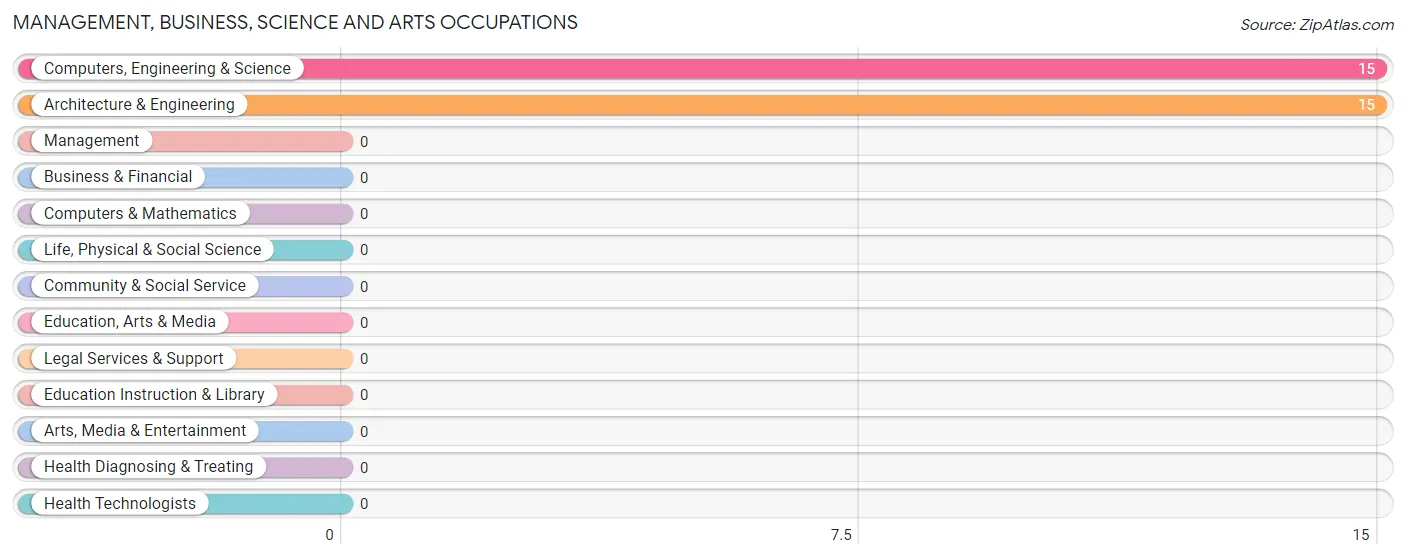
Management, Business, Science and Arts Occupations
The most common Management, Business, Science and Arts occupations in Walker are Computers, Engineering & Science (15 | 12.8%), and Architecture & Engineering (15 | 12.8%).
Management, Business, Science and Arts Occupations by Sex
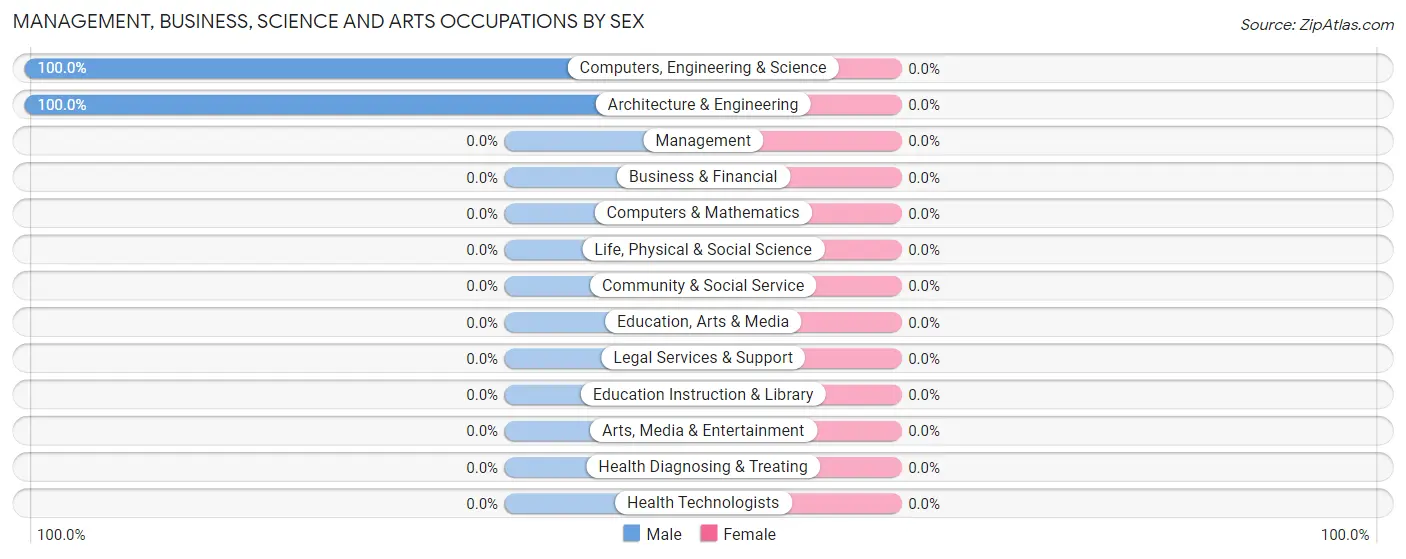
| Occupation | Male | Female |
| Management | 0 (0.0%) | 0 (0.0%) |
| Business & Financial | 0 (0.0%) | 0 (0.0%) |
| Computers, Engineering & Science | 15 (100.0%) | 0 (0.0%) |
| Computers & Mathematics | 0 (0.0%) | 0 (0.0%) |
| Architecture & Engineering | 15 (100.0%) | 0 (0.0%) |
| Life, Physical & Social Science | 0 (0.0%) | 0 (0.0%) |
| Community & Social Service | 0 (0.0%) | 0 (0.0%) |
| Education, Arts & Media | 0 (0.0%) | 0 (0.0%) |
| Legal Services & Support | 0 (0.0%) | 0 (0.0%) |
| Education Instruction & Library | 0 (0.0%) | 0 (0.0%) |
| Arts, Media & Entertainment | 0 (0.0%) | 0 (0.0%) |
| Health Diagnosing & Treating | 0 (0.0%) | 0 (0.0%) |
| Health Technologists | 0 (0.0%) | 0 (0.0%) |
| Total (Category) | 15 (100.0%) | 0 (0.0%) |
| Total (Overall) | 80 (68.4%) | 37 (31.6%) |
Services Occupations
The most common Services occupations in Walker are Cleaning & Maintenance (12 | 10.3%), and Healthcare Support (8 | 6.8%).
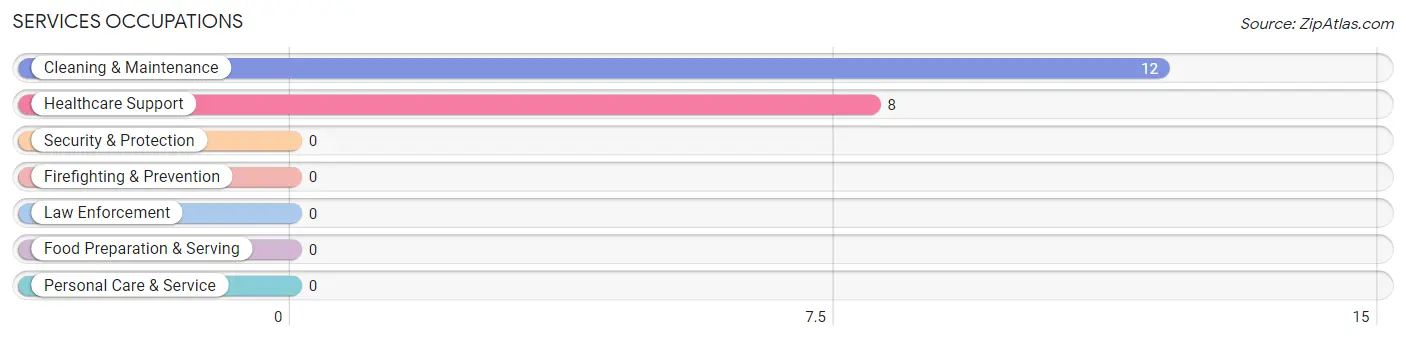
Services Occupations by Sex
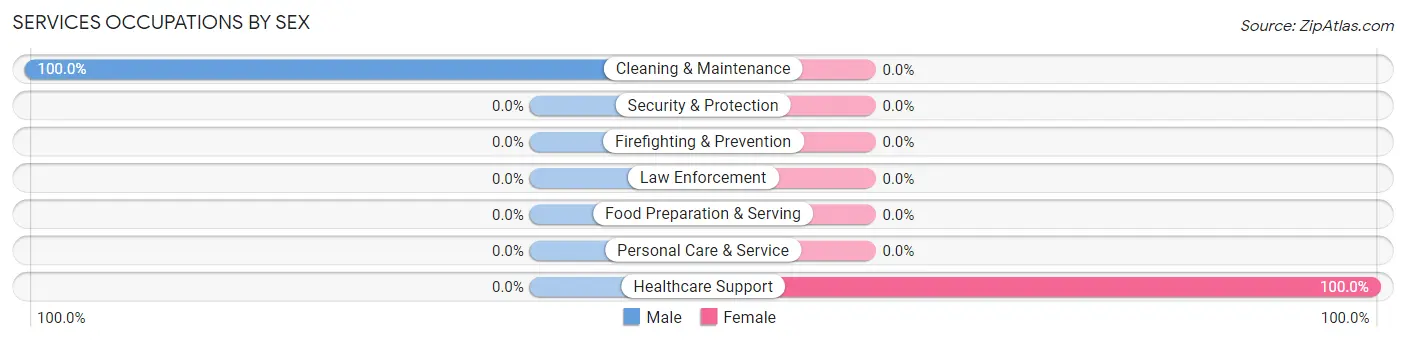
| Occupation | Male | Female |
| Healthcare Support | 0 (0.0%) | 8 (100.0%) |
| Security & Protection | 0 (0.0%) | 0 (0.0%) |
| Firefighting & Prevention | 0 (0.0%) | 0 (0.0%) |
| Law Enforcement | 0 (0.0%) | 0 (0.0%) |
| Food Preparation & Serving | 0 (0.0%) | 0 (0.0%) |
| Cleaning & Maintenance | 12 (100.0%) | 0 (0.0%) |
| Personal Care & Service | 0 (0.0%) | 0 (0.0%) |
| Total (Category) | 12 (60.0%) | 8 (40.0%) |
| Total (Overall) | 80 (68.4%) | 37 (31.6%) |
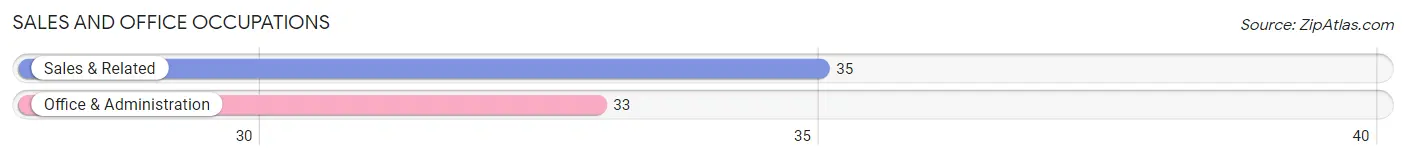
Sales and Office Occupations
The most common Sales and Office occupations in Walker are Sales & Related (35 | 29.9%), and Office & Administration (33 | 28.2%).
Sales and Office Occupations by Sex
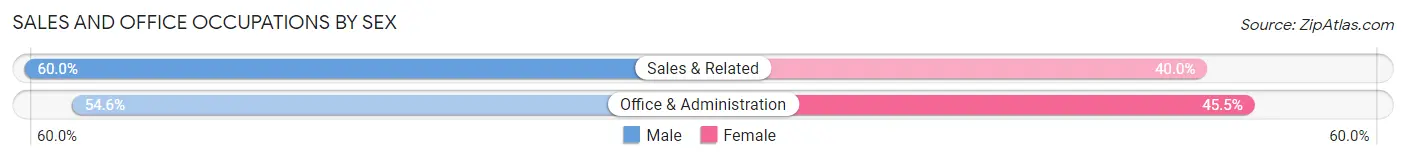
| Occupation | Male | Female |
| Sales & Related | 21 (60.0%) | 14 (40.0%) |
| Office & Administration | 18 (54.5%) | 15 (45.5%) |
| Total (Category) | 39 (57.4%) | 29 (42.6%) |
| Total (Overall) | 80 (68.4%) | 37 (31.6%) |
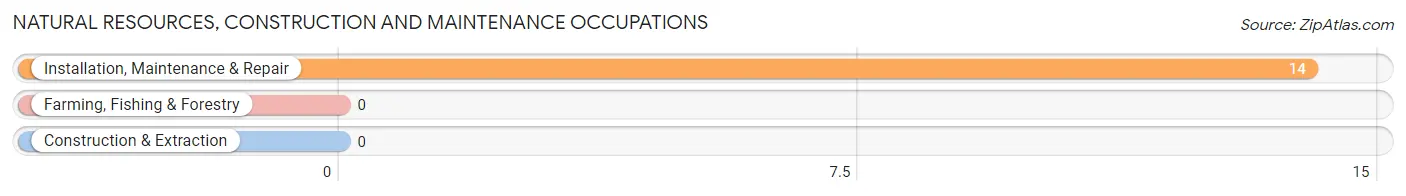
Natural Resources, Construction and Maintenance Occupations
The most common Natural Resources, Construction and Maintenance occupations in Walker are , and Installation, Maintenance & Repair (14 | 12.0%).
Natural Resources, Construction and Maintenance Occupations by Sex
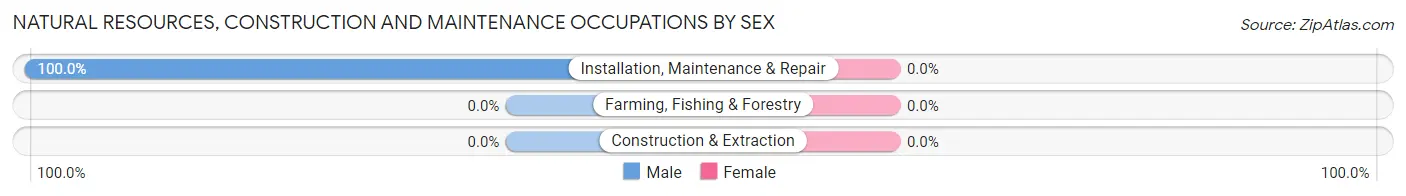
| Occupation | Male | Female |
| Farming, Fishing & Forestry | 0 (0.0%) | 0 (0.0%) |
| Construction & Extraction | 0 (0.0%) | 0 (0.0%) |
| Installation, Maintenance & Repair | 14 (100.0%) | 0 (0.0%) |
| Total (Category) | 14 (100.0%) | 0 (0.0%) |
| Total (Overall) | 80 (68.4%) | 37 (31.6%) |
Production, Transportation and Moving Occupations
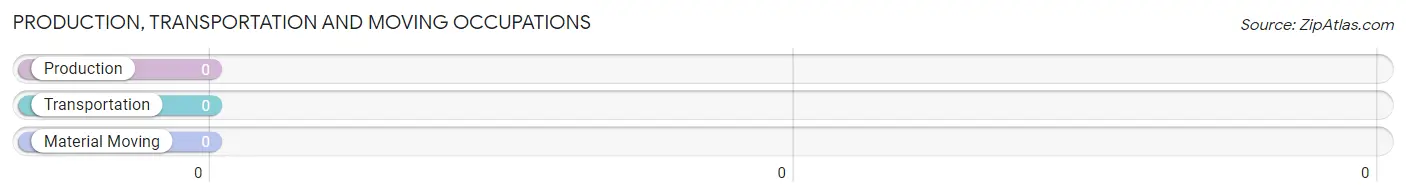
Production, Transportation and Moving Occupations by Sex
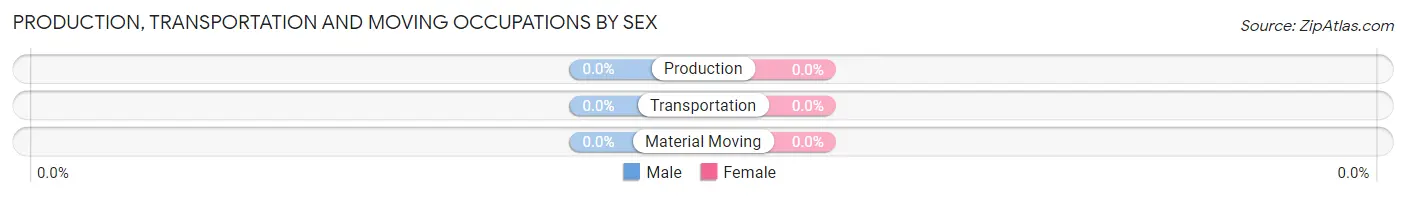
| Occupation | Male | Female |
| Production | 0 (0.0%) | 0 (0.0%) |
| Transportation | 0 (0.0%) | 0 (0.0%) |
| Material Moving | 0 (0.0%) | 0 (0.0%) |
| Total (Category) | 0 (0.0%) | 0 (0.0%) |
| Total (Overall) | 80 (68.4%) | 37 (31.6%) |
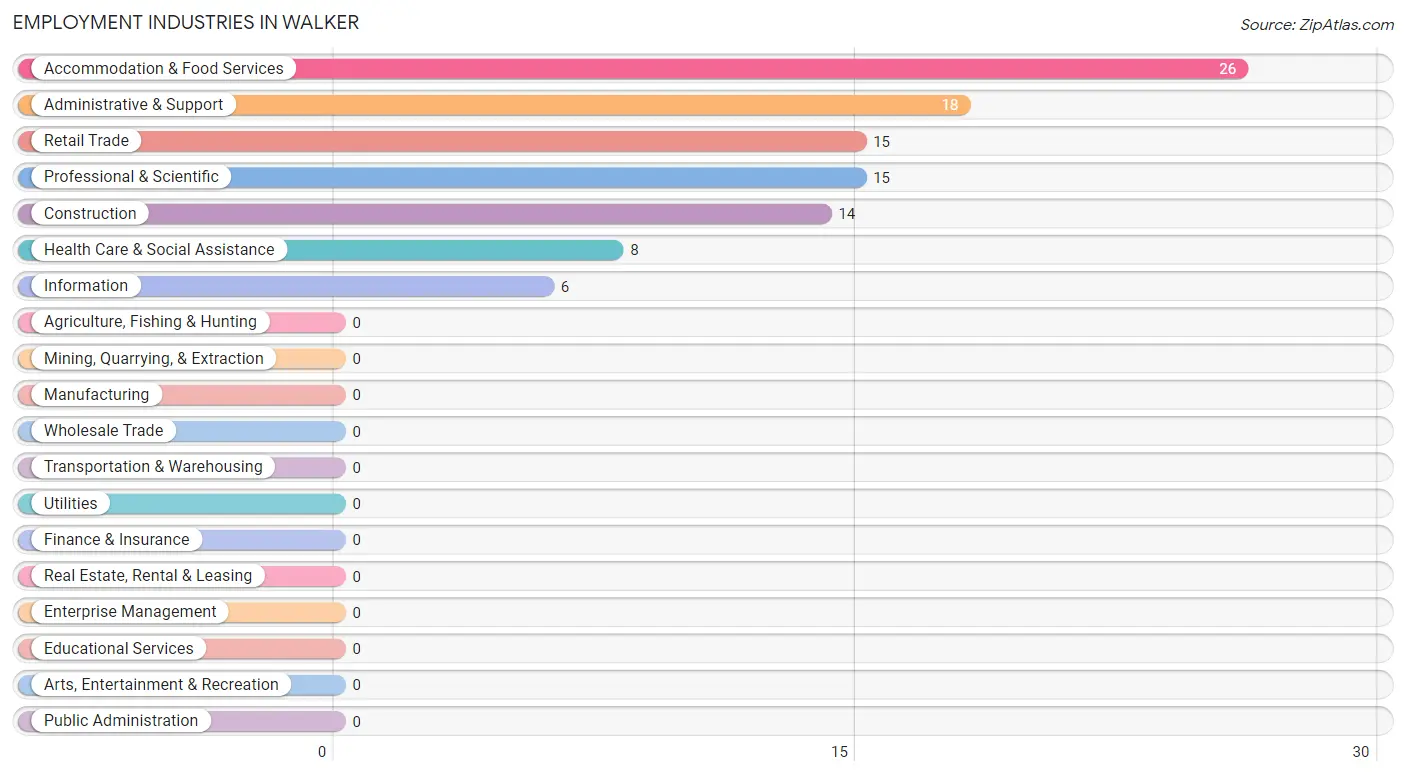
Employment Industries by Sex in Walker
Employment Industries in Walker
The major employment industries in Walker include Accommodation & Food Services (26 | 22.2%), Administrative & Support (18 | 15.4%), Retail Trade (15 | 12.8%), Professional & Scientific (15 | 12.8%), and Construction (14 | 12.0%).
Employment Industries by Sex in Walker
The Walker industries that see more men than women are Construction (100.0%), Information (100.0%), and Professional & Scientific (100.0%), whereas the industries that tend to have a higher number of women are Retail Trade (100.0%), Health Care & Social Assistance (100.0%), and Administrative & Support (33.3%).
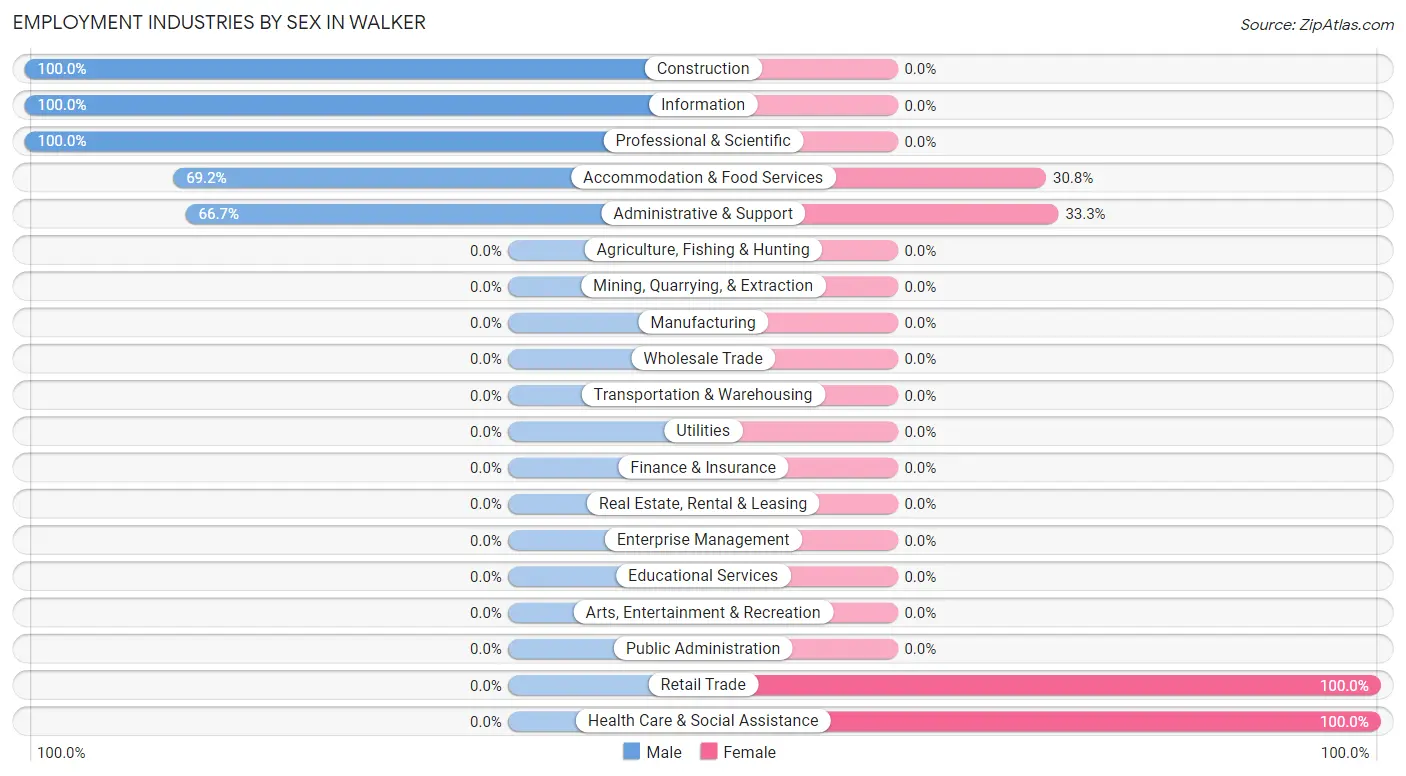
| Industry | Male | Female |
| Agriculture, Fishing & Hunting | 0 (0.0%) | 0 (0.0%) |
| Mining, Quarrying, & Extraction | 0 (0.0%) | 0 (0.0%) |
| Construction | 14 (100.0%) | 0 (0.0%) |
| Manufacturing | 0 (0.0%) | 0 (0.0%) |
| Wholesale Trade | 0 (0.0%) | 0 (0.0%) |
| Retail Trade | 0 (0.0%) | 15 (100.0%) |
| Transportation & Warehousing | 0 (0.0%) | 0 (0.0%) |
| Utilities | 0 (0.0%) | 0 (0.0%) |
| Information | 6 (100.0%) | 0 (0.0%) |
| Finance & Insurance | 0 (0.0%) | 0 (0.0%) |
| Real Estate, Rental & Leasing | 0 (0.0%) | 0 (0.0%) |
| Professional & Scientific | 15 (100.0%) | 0 (0.0%) |
| Enterprise Management | 0 (0.0%) | 0 (0.0%) |
| Administrative & Support | 12 (66.7%) | 6 (33.3%) |
| Educational Services | 0 (0.0%) | 0 (0.0%) |
| Health Care & Social Assistance | 0 (0.0%) | 8 (100.0%) |
| Arts, Entertainment & Recreation | 0 (0.0%) | 0 (0.0%) |
| Accommodation & Food Services | 18 (69.2%) | 8 (30.8%) |
| Public Administration | 0 (0.0%) | 0 (0.0%) |
| Total | 80 (68.4%) | 37 (31.6%) |
Education in Walker
School Enrollment in Walker
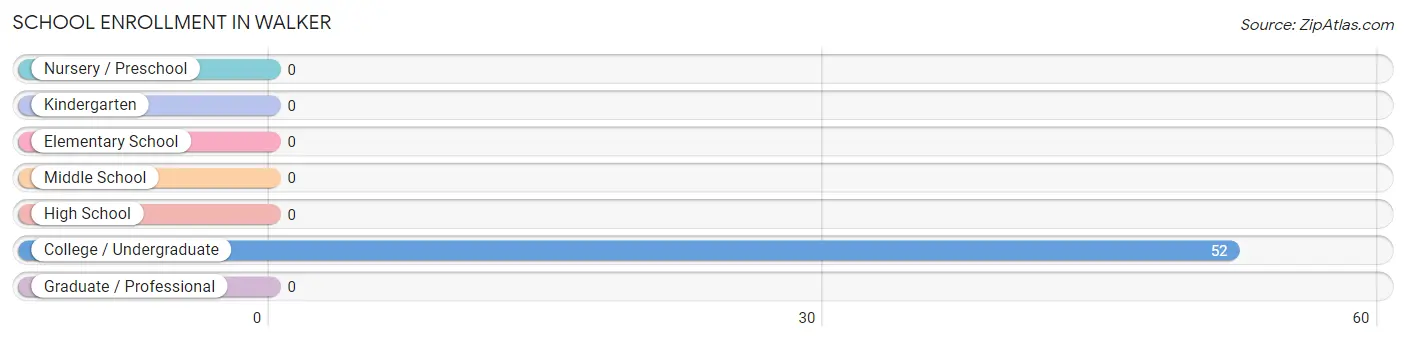
| School Level | # Students | % Students |
| Nursery / Preschool | 0 | 0.0% |
| Kindergarten | 0 | 0.0% |
| Elementary School | 0 | 0.0% |
| Middle School | 0 | 0.0% |
| High School | 0 | 0.0% |
| College / Undergraduate | 52 | 100.0% |
| Graduate / Professional | 0 | 0.0% |
| Total | 52 | 100.0% |
School Enrollment by Age by Funding Source in Walker
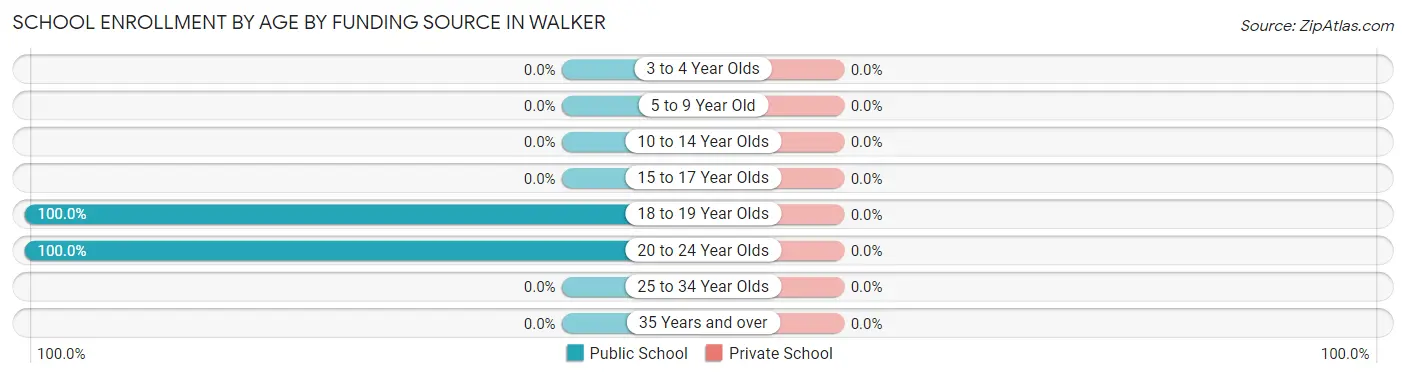
| Age Bracket | Public School | Private School |
| 3 to 4 Year Olds | 0 (0.0%) | 0 (0.0%) |
| 5 to 9 Year Old | 0 (0.0%) | 0 (0.0%) |
| 10 to 14 Year Olds | 0 (0.0%) | 0 (0.0%) |
| 15 to 17 Year Olds | 0 (0.0%) | 0 (0.0%) |
| 18 to 19 Year Olds | 8 (100.0%) | 0 (0.0%) |
| 20 to 24 Year Olds | 44 (100.0%) | 0 (0.0%) |
| 25 to 34 Year Olds | 0 (0.0%) | 0 (0.0%) |
| 35 Years and over | 0 (0.0%) | 0 (0.0%) |
| Total | 52 (100.0%) | 0 (0.0%) |
Educational Attainment by Field of Study in Walker
Business (54 | 49.5%), engineering (28 | 25.7%), communications (15 | 13.8%), multidisciplinary studies (7 | 6.4%), and education (5 | 4.6%) are the most common fields of study among 109 individuals in Walker who have obtained a bachelor's degree or higher.
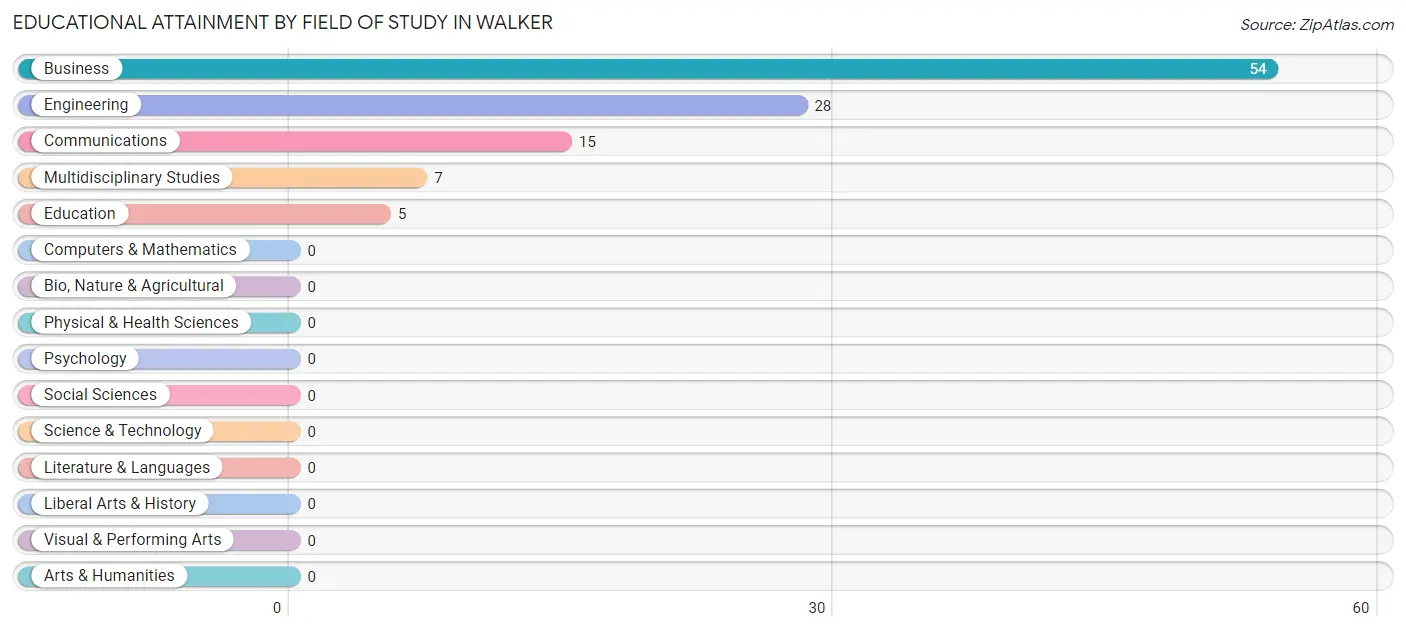
| Field of Study | # Graduates | % Graduates |
| Computers & Mathematics | 0 | 0.0% |
| Bio, Nature & Agricultural | 0 | 0.0% |
| Physical & Health Sciences | 0 | 0.0% |
| Psychology | 0 | 0.0% |
| Social Sciences | 0 | 0.0% |
| Engineering | 28 | 25.7% |
| Multidisciplinary Studies | 7 | 6.4% |
| Science & Technology | 0 | 0.0% |
| Business | 54 | 49.5% |
| Education | 5 | 4.6% |
| Literature & Languages | 0 | 0.0% |
| Liberal Arts & History | 0 | 0.0% |
| Visual & Performing Arts | 0 | 0.0% |
| Communications | 15 | 13.8% |
| Arts & Humanities | 0 | 0.0% |
| Total | 109 | 100.0% |
Transportation & Commute in Walker
Vehicle Availability by Sex in Walker
The most prevalent vehicle ownership categories in Walker are males with 3 vehicles (27, accounting for 40.9%) and females with 3 vehicles (0, making up 93.1%).
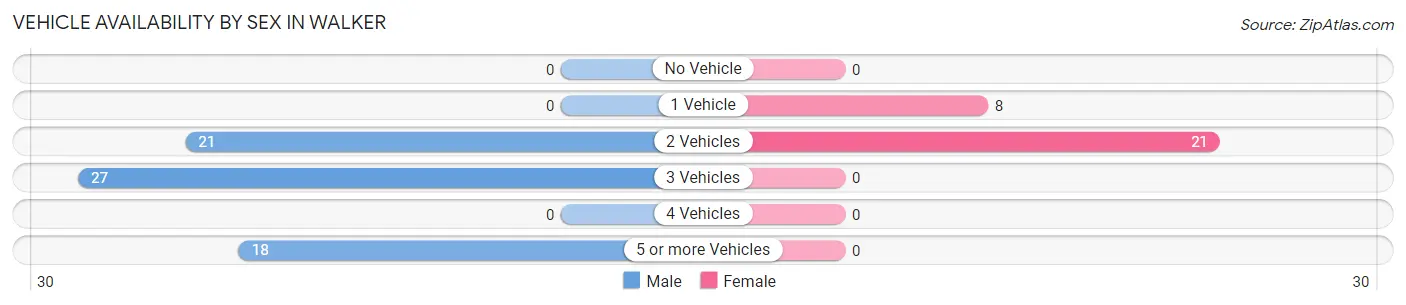
| Vehicles Available | Male | Female |
| No Vehicle | 0 (0.0%) | 0 (0.0%) |
| 1 Vehicle | 0 (0.0%) | 8 (27.6%) |
| 2 Vehicles | 21 (31.8%) | 21 (72.4%) |
| 3 Vehicles | 27 (40.9%) | 0 (0.0%) |
| 4 Vehicles | 0 (0.0%) | 0 (0.0%) |
| 5 or more Vehicles | 18 (27.3%) | 0 (0.0%) |
| Total | 66 (100.0%) | 29 (100.0%) |
Commute Time in Walker
The most frequently occuring commute durations in Walker are 15 to 19 minutes (23 commuters, 24.2%), 10 to 14 minutes (21 commuters, 22.1%), and 35 to 39 minutes (18 commuters, 19.0%).
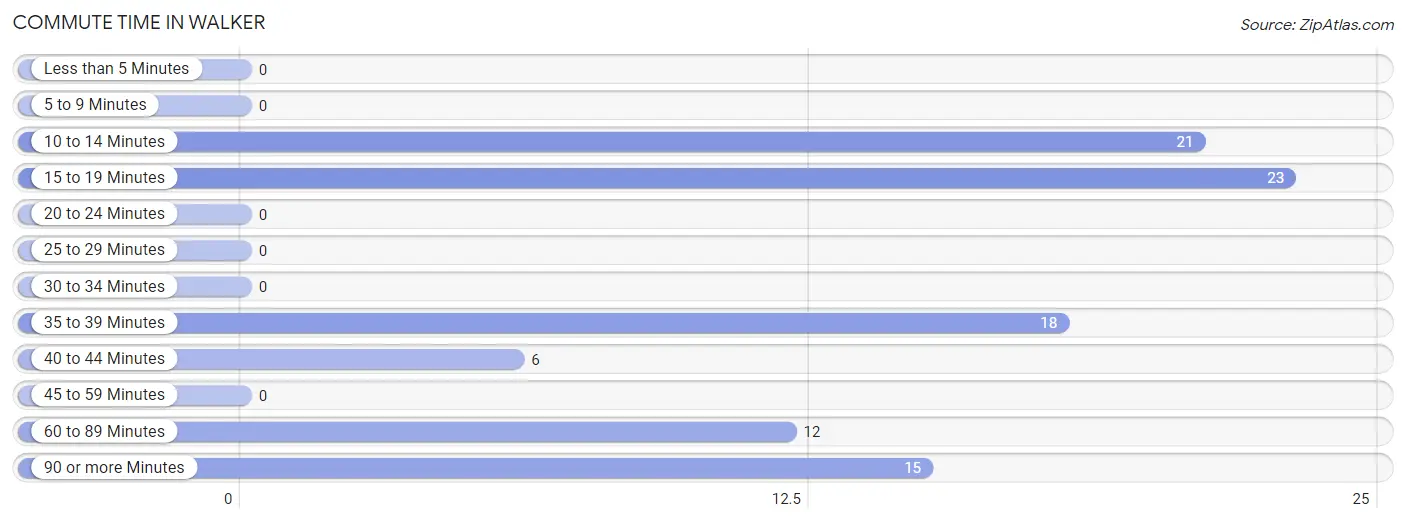
| Commute Time | # Commuters | % Commuters |
| Less than 5 Minutes | 0 | 0.0% |
| 5 to 9 Minutes | 0 | 0.0% |
| 10 to 14 Minutes | 21 | 22.1% |
| 15 to 19 Minutes | 23 | 24.2% |
| 20 to 24 Minutes | 0 | 0.0% |
| 25 to 29 Minutes | 0 | 0.0% |
| 30 to 34 Minutes | 0 | 0.0% |
| 35 to 39 Minutes | 18 | 19.0% |
| 40 to 44 Minutes | 6 | 6.3% |
| 45 to 59 Minutes | 0 | 0.0% |
| 60 to 89 Minutes | 12 | 12.6% |
| 90 or more Minutes | 15 | 15.8% |
Commute Time by Sex in Walker
The most common commute times in Walker are 35 to 39 minutes (18 commuters, 27.3%) for males and 15 to 19 minutes (23 commuters, 79.3%) for females.
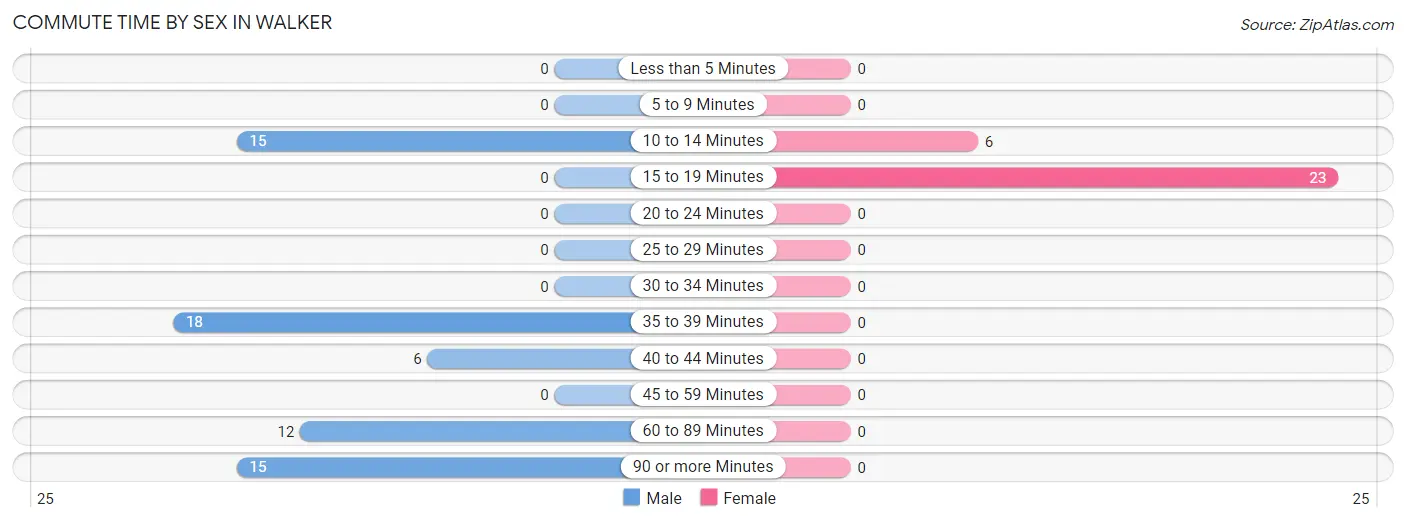
| Commute Time | Male | Female |
| Less than 5 Minutes | 0 (0.0%) | 0 (0.0%) |
| 5 to 9 Minutes | 0 (0.0%) | 0 (0.0%) |
| 10 to 14 Minutes | 15 (22.7%) | 6 (20.7%) |
| 15 to 19 Minutes | 0 (0.0%) | 23 (79.3%) |
| 20 to 24 Minutes | 0 (0.0%) | 0 (0.0%) |
| 25 to 29 Minutes | 0 (0.0%) | 0 (0.0%) |
| 30 to 34 Minutes | 0 (0.0%) | 0 (0.0%) |
| 35 to 39 Minutes | 18 (27.3%) | 0 (0.0%) |
| 40 to 44 Minutes | 6 (9.1%) | 0 (0.0%) |
| 45 to 59 Minutes | 0 (0.0%) | 0 (0.0%) |
| 60 to 89 Minutes | 12 (18.2%) | 0 (0.0%) |
| 90 or more Minutes | 15 (22.7%) | 0 (0.0%) |
Time of Departure to Work by Sex in Walker
The most frequent times of departure to work in Walker are 7:00 AM to 7:29 AM (30, 45.5%) for males and 9:00 AM to 9:59 AM (15, 51.7%) for females.
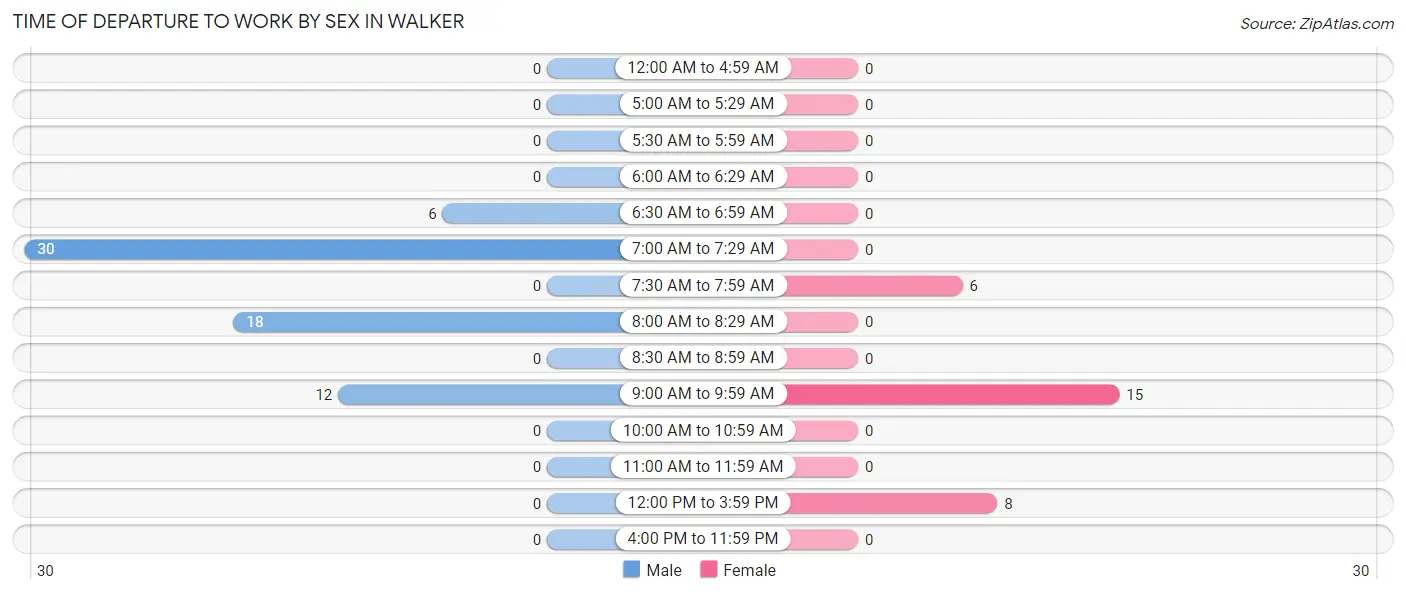
| Time of Departure | Male | Female |
| 12:00 AM to 4:59 AM | 0 (0.0%) | 0 (0.0%) |
| 5:00 AM to 5:29 AM | 0 (0.0%) | 0 (0.0%) |
| 5:30 AM to 5:59 AM | 0 (0.0%) | 0 (0.0%) |
| 6:00 AM to 6:29 AM | 0 (0.0%) | 0 (0.0%) |
| 6:30 AM to 6:59 AM | 6 (9.1%) | 0 (0.0%) |
| 7:00 AM to 7:29 AM | 30 (45.5%) | 0 (0.0%) |
| 7:30 AM to 7:59 AM | 0 (0.0%) | 6 (20.7%) |
| 8:00 AM to 8:29 AM | 18 (27.3%) | 0 (0.0%) |
| 8:30 AM to 8:59 AM | 0 (0.0%) | 0 (0.0%) |
| 9:00 AM to 9:59 AM | 12 (18.2%) | 15 (51.7%) |
| 10:00 AM to 10:59 AM | 0 (0.0%) | 0 (0.0%) |
| 11:00 AM to 11:59 AM | 0 (0.0%) | 0 (0.0%) |
| 12:00 PM to 3:59 PM | 0 (0.0%) | 8 (27.6%) |
| 4:00 PM to 11:59 PM | 0 (0.0%) | 0 (0.0%) |
| Total | 66 (100.0%) | 29 (100.0%) |
Housing Occupancy in Walker
Occupancy by Ownership in Walker
Of the total 229 dwellings in Walker, owner-occupied units account for 194 (84.7%), while renter-occupied units make up 35 (15.3%).
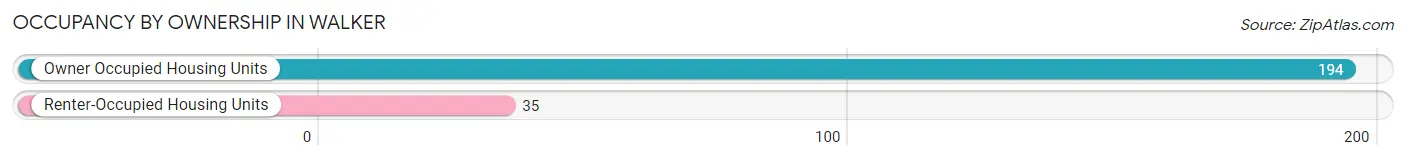
| Occupancy | # Housing Units | % Housing Units |
| Owner Occupied Housing Units | 194 | 84.7% |
| Renter-Occupied Housing Units | 35 | 15.3% |
| Total Occupied Housing Units | 229 | 100.0% |
Occupancy by Household Size in Walker
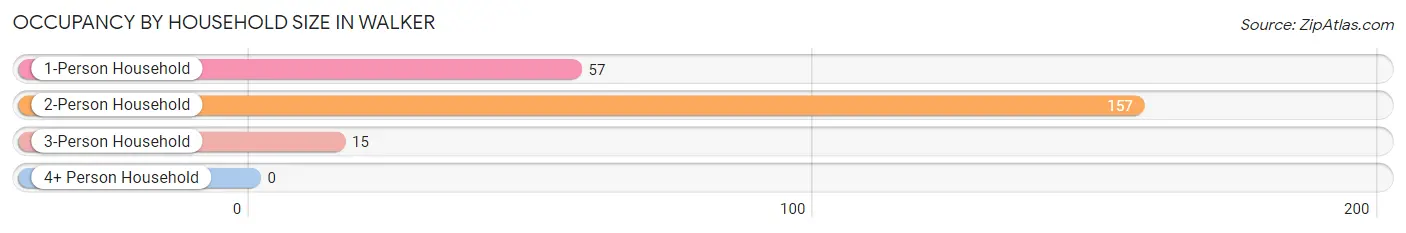
| Household Size | # Housing Units | % Housing Units |
| 1-Person Household | 57 | 24.9% |
| 2-Person Household | 157 | 68.6% |
| 3-Person Household | 15 | 6.6% |
| 4+ Person Household | 0 | 0.0% |
| Total Housing Units | 229 | 100.0% |
Occupancy by Ownership by Household Size in Walker
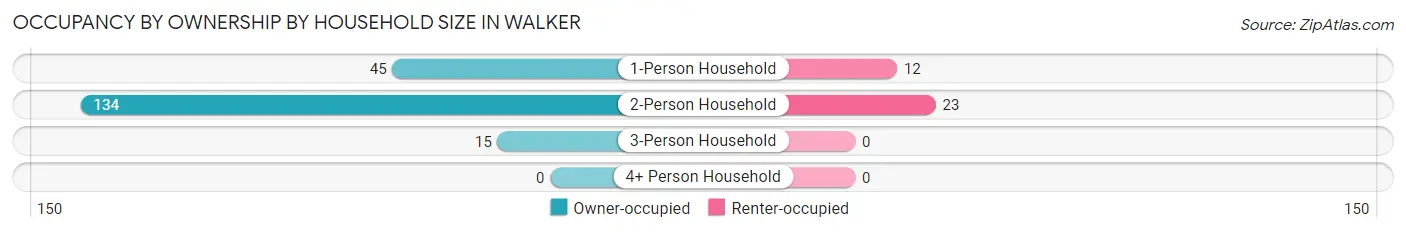
| Household Size | Owner-occupied | Renter-occupied |
| 1-Person Household | 45 (78.9%) | 12 (21.0%) |
| 2-Person Household | 134 (85.4%) | 23 (14.6%) |
| 3-Person Household | 15 (100.0%) | 0 (0.0%) |
| 4+ Person Household | 0 (0.0%) | 0 (0.0%) |
| Total Housing Units | 194 (84.7%) | 35 (15.3%) |
Occupancy by Educational Attainment in Walker
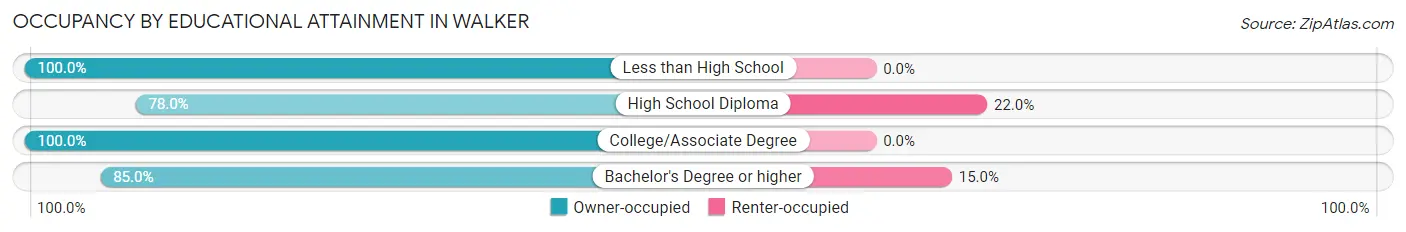
| Household Size | Owner-occupied | Renter-occupied |
| Less than High School | 11 (100.0%) | 0 (0.0%) |
| High School Diploma | 71 (78.0%) | 20 (22.0%) |
| College/Associate Degree | 27 (100.0%) | 0 (0.0%) |
| Bachelor's Degree or higher | 85 (85.0%) | 15 (15.0%) |
Occupancy by Age of Householder in Walker
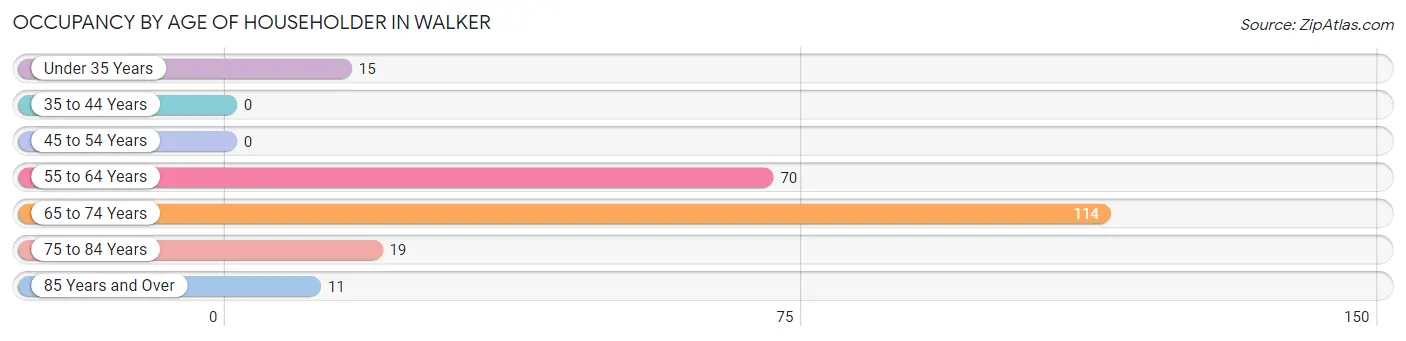
| Age Bracket | # Households | % Households |
| Under 35 Years | 15 | 6.6% |
| 35 to 44 Years | 0 | 0.0% |
| 45 to 54 Years | 0 | 0.0% |
| 55 to 64 Years | 70 | 30.6% |
| 65 to 74 Years | 114 | 49.8% |
| 75 to 84 Years | 19 | 8.3% |
| 85 Years and Over | 11 | 4.8% |
| Total | 229 | 100.0% |
Housing Finances in Walker
Median Income by Occupancy in Walker
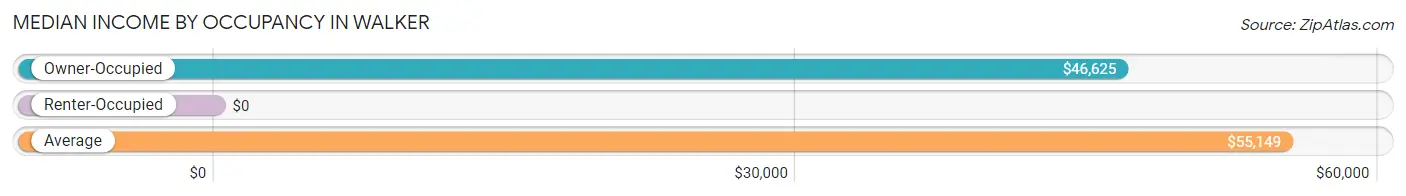
| Occupancy Type | # Households | Median Income |
| Owner-Occupied | 194 (84.7%) | $46,625 |
| Renter-Occupied | 35 (15.3%) | $0 |
| Average | 229 (100.0%) | $55,149 |
Occupancy by Householder Income Bracket in Walker
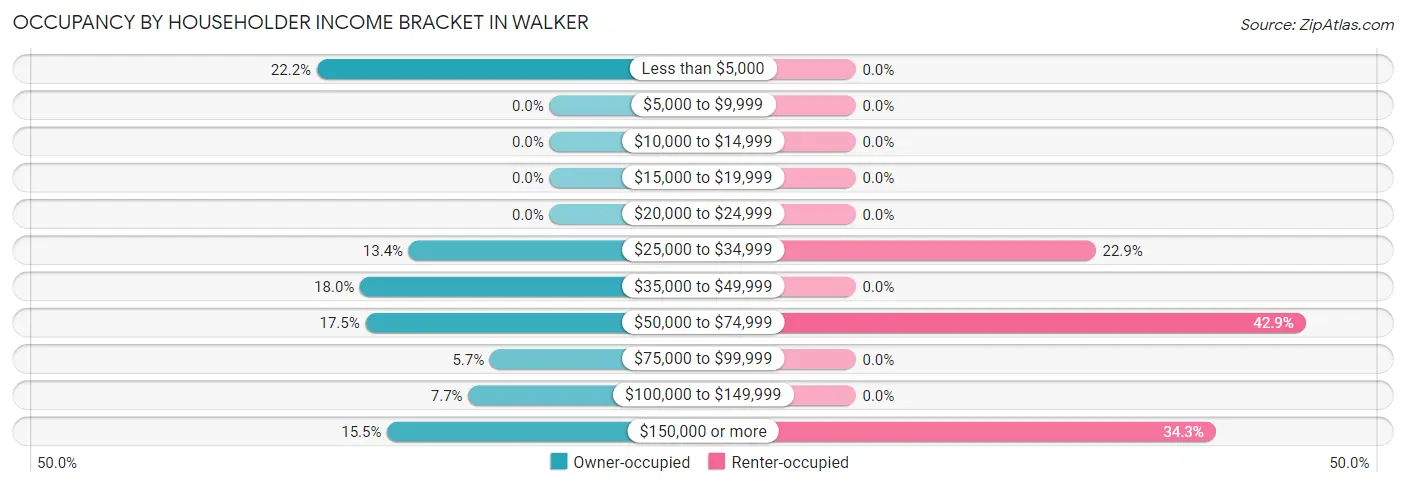
| Income Bracket | Owner-occupied | Renter-occupied |
| Less than $5,000 | 43 (22.2%) | 0 (0.0%) |
| $5,000 to $9,999 | 0 (0.0%) | 0 (0.0%) |
| $10,000 to $14,999 | 0 (0.0%) | 0 (0.0%) |
| $15,000 to $19,999 | 0 (0.0%) | 0 (0.0%) |
| $20,000 to $24,999 | 0 (0.0%) | 0 (0.0%) |
| $25,000 to $34,999 | 26 (13.4%) | 8 (22.9%) |
| $35,000 to $49,999 | 35 (18.0%) | 0 (0.0%) |
| $50,000 to $74,999 | 34 (17.5%) | 15 (42.9%) |
| $75,000 to $99,999 | 11 (5.7%) | 0 (0.0%) |
| $100,000 to $149,999 | 15 (7.7%) | 0 (0.0%) |
| $150,000 or more | 30 (15.5%) | 12 (34.3%) |
| Total | 194 (100.0%) | 35 (100.0%) |
Monthly Housing Cost Tiers in Walker
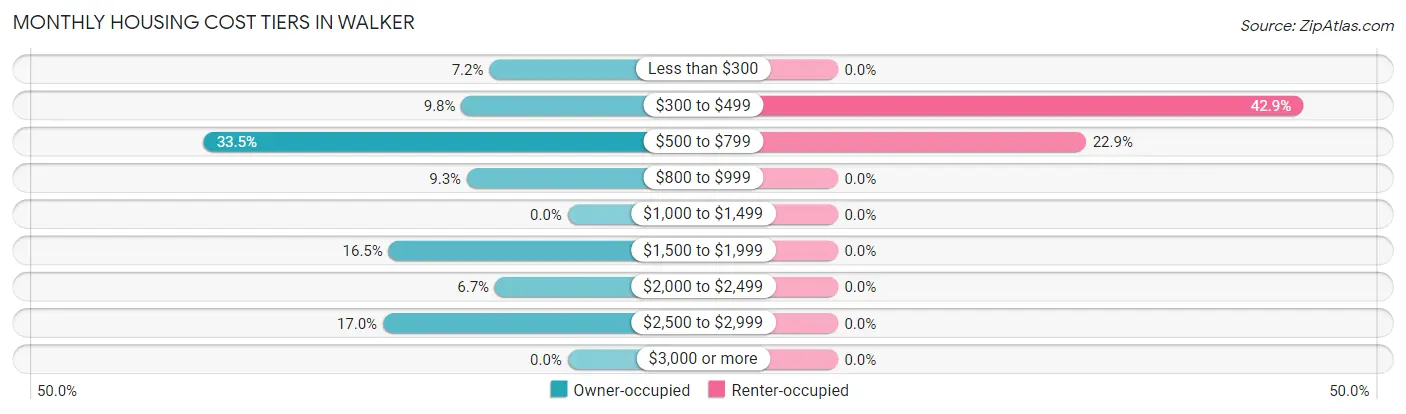
| Monthly Cost | Owner-occupied | Renter-occupied |
| Less than $300 | 14 (7.2%) | 0 (0.0%) |
| $300 to $499 | 19 (9.8%) | 15 (42.9%) |
| $500 to $799 | 65 (33.5%) | 8 (22.9%) |
| $800 to $999 | 18 (9.3%) | 0 (0.0%) |
| $1,000 to $1,499 | 0 (0.0%) | 0 (0.0%) |
| $1,500 to $1,999 | 32 (16.5%) | 0 (0.0%) |
| $2,000 to $2,499 | 13 (6.7%) | 0 (0.0%) |
| $2,500 to $2,999 | 33 (17.0%) | 0 (0.0%) |
| $3,000 or more | 0 (0.0%) | 0 (0.0%) |
| Total | 194 (100.0%) | 35 (100.0%) |
Physical Housing Characteristics in Walker
Housing Structures in Walker
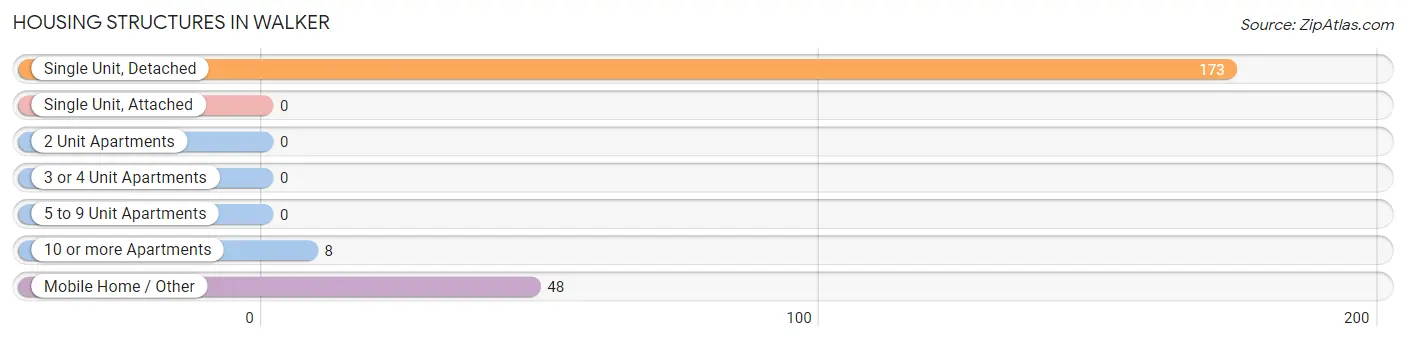
| Structure Type | # Housing Units | % Housing Units |
| Single Unit, Detached | 173 | 75.5% |
| Single Unit, Attached | 0 | 0.0% |
| 2 Unit Apartments | 0 | 0.0% |
| 3 or 4 Unit Apartments | 0 | 0.0% |
| 5 to 9 Unit Apartments | 0 | 0.0% |
| 10 or more Apartments | 8 | 3.5% |
| Mobile Home / Other | 48 | 21.0% |
| Total | 229 | 100.0% |
Housing Structures by Occupancy in Walker
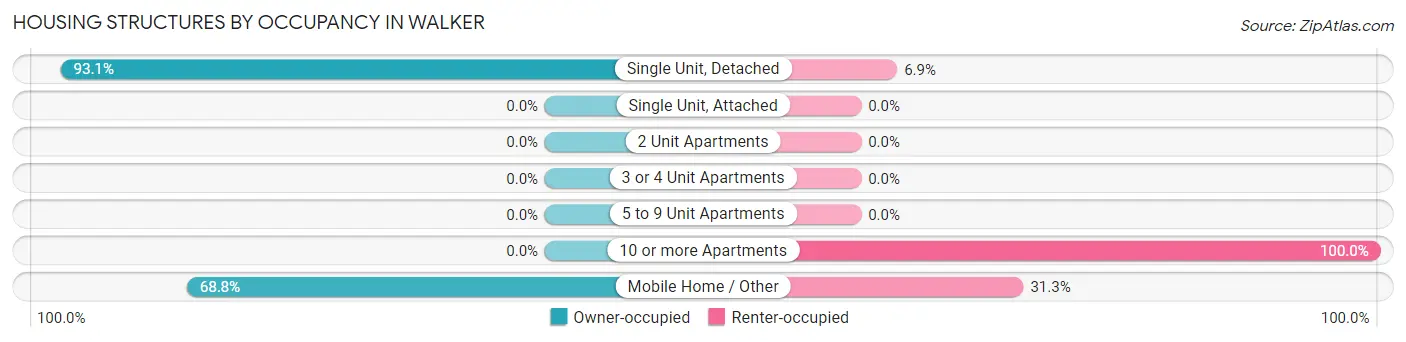
| Structure Type | Owner-occupied | Renter-occupied |
| Single Unit, Detached | 161 (93.1%) | 12 (6.9%) |
| Single Unit, Attached | 0 (0.0%) | 0 (0.0%) |
| 2 Unit Apartments | 0 (0.0%) | 0 (0.0%) |
| 3 or 4 Unit Apartments | 0 (0.0%) | 0 (0.0%) |
| 5 to 9 Unit Apartments | 0 (0.0%) | 0 (0.0%) |
| 10 or more Apartments | 0 (0.0%) | 8 (100.0%) |
| Mobile Home / Other | 33 (68.8%) | 15 (31.2%) |
| Total | 194 (84.7%) | 35 (15.3%) |
Housing Structures by Number of Rooms in Walker
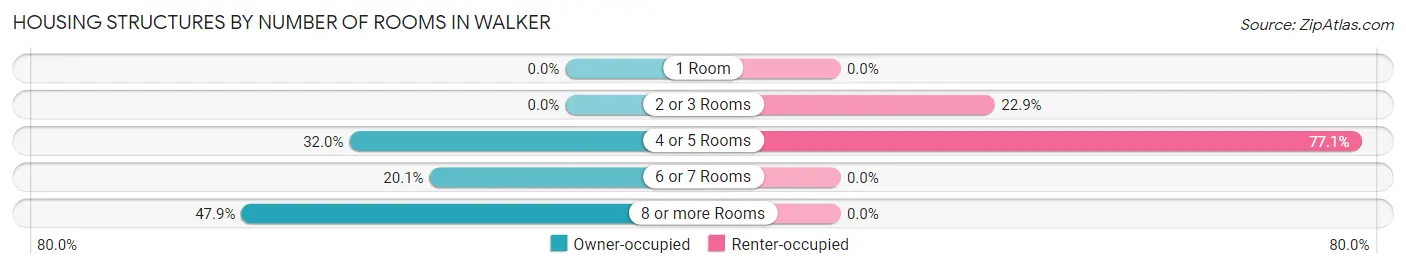
| Number of Rooms | Owner-occupied | Renter-occupied |
| 1 Room | 0 (0.0%) | 0 (0.0%) |
| 2 or 3 Rooms | 0 (0.0%) | 8 (22.9%) |
| 4 or 5 Rooms | 62 (32.0%) | 27 (77.1%) |
| 6 or 7 Rooms | 39 (20.1%) | 0 (0.0%) |
| 8 or more Rooms | 93 (47.9%) | 0 (0.0%) |
| Total | 194 (100.0%) | 35 (100.0%) |
Housing Structure by Heating Type in Walker
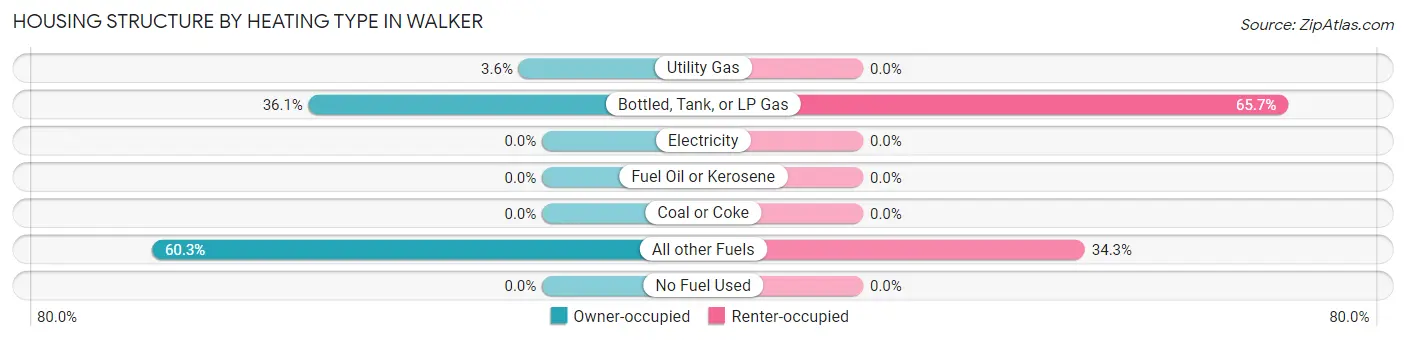
| Heating Type | Owner-occupied | Renter-occupied |
| Utility Gas | 7 (3.6%) | 0 (0.0%) |
| Bottled, Tank, or LP Gas | 70 (36.1%) | 23 (65.7%) |
| Electricity | 0 (0.0%) | 0 (0.0%) |
| Fuel Oil or Kerosene | 0 (0.0%) | 0 (0.0%) |
| Coal or Coke | 0 (0.0%) | 0 (0.0%) |
| All other Fuels | 117 (60.3%) | 12 (34.3%) |
| No Fuel Used | 0 (0.0%) | 0 (0.0%) |
| Total | 194 (100.0%) | 35 (100.0%) |
Household Vehicle Usage in Walker
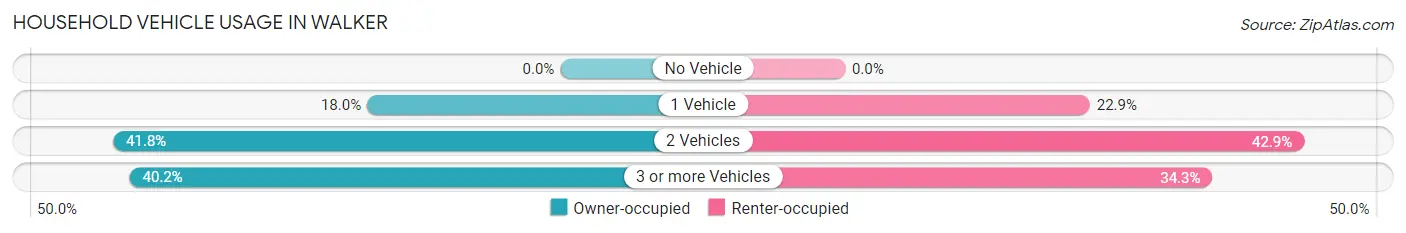
| Vehicles per Household | Owner-occupied | Renter-occupied |
| No Vehicle | 0 (0.0%) | 0 (0.0%) |
| 1 Vehicle | 35 (18.0%) | 8 (22.9%) |
| 2 Vehicles | 81 (41.7%) | 15 (42.9%) |
| 3 or more Vehicles | 78 (40.2%) | 12 (34.3%) |
| Total | 194 (100.0%) | 35 (100.0%) |
Real Estate & Mortgages in Walker
Real Estate and Mortgage Overview in Walker
| Characteristic | Without Mortgage | With Mortgage |
| Housing Units | 111 | 83 |
| Median Property Value | - | - |
| Median Household Income | - | - |
| Monthly Housing Costs | $656 | $0 |
| Real Estate Taxes | $2,107 | $0 |
Property Value by Mortgage Status in Walker
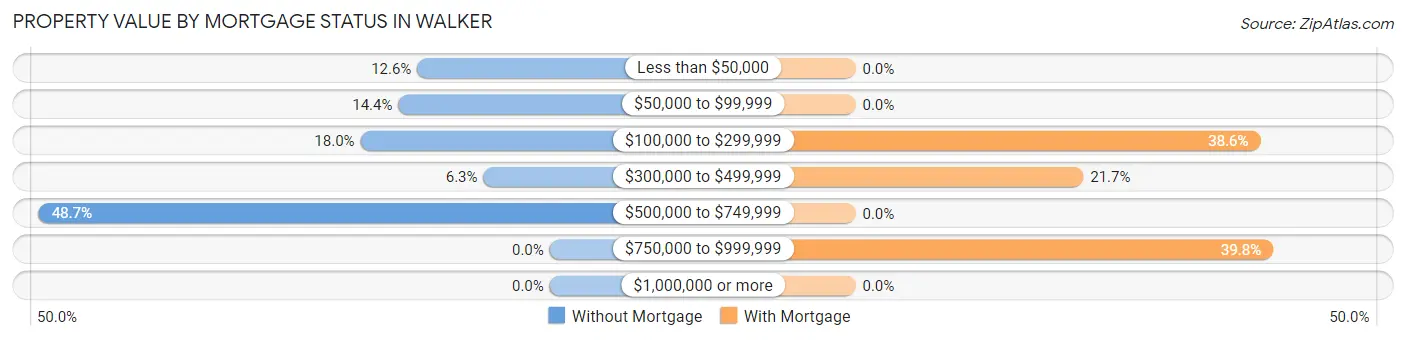
| Property Value | Without Mortgage | With Mortgage |
| Less than $50,000 | 14 (12.6%) | 0 (0.0%) |
| $50,000 to $99,999 | 16 (14.4%) | 0 (0.0%) |
| $100,000 to $299,999 | 20 (18.0%) | 32 (38.6%) |
| $300,000 to $499,999 | 7 (6.3%) | 18 (21.7%) |
| $500,000 to $749,999 | 54 (48.6%) | 0 (0.0%) |
| $750,000 to $999,999 | 0 (0.0%) | 33 (39.8%) |
| $1,000,000 or more | 0 (0.0%) | 0 (0.0%) |
| Total | 111 (100.0%) | 83 (100.0%) |
Household Income by Mortgage Status in Walker
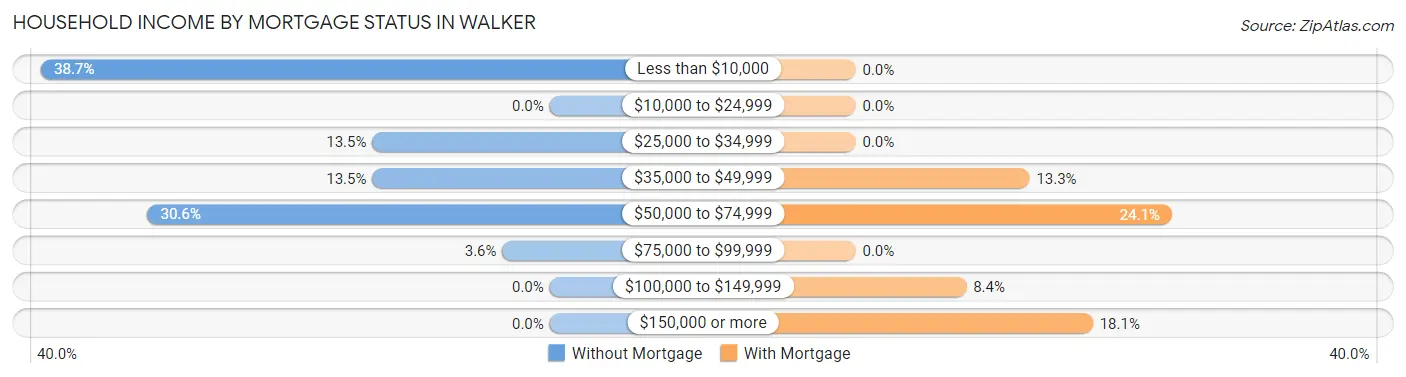
| Household Income | Without Mortgage | With Mortgage |
| Less than $10,000 | 43 (38.7%) | 0 (0.0%) |
| $10,000 to $24,999 | 0 (0.0%) | 0 (0.0%) |
| $25,000 to $34,999 | 15 (13.5%) | 0 (0.0%) |
| $35,000 to $49,999 | 15 (13.5%) | 11 (13.3%) |
| $50,000 to $74,999 | 34 (30.6%) | 20 (24.1%) |
| $75,000 to $99,999 | 4 (3.6%) | 0 (0.0%) |
| $100,000 to $149,999 | 0 (0.0%) | 7 (8.4%) |
| $150,000 or more | 0 (0.0%) | 15 (18.1%) |
| Total | 111 (100.0%) | 83 (100.0%) |
Property Value to Household Income Ratio in Walker
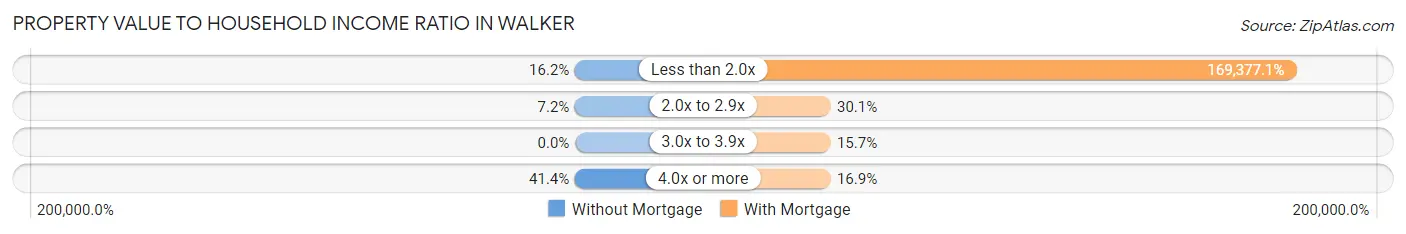
| Value-to-Income Ratio | Without Mortgage | With Mortgage |
| Less than 2.0x | 18 (16.2%) | 140,583 (169,377.1%) |
| 2.0x to 2.9x | 8 (7.2%) | 25 (30.1%) |
| 3.0x to 3.9x | 0 (0.0%) | 13 (15.7%) |
| 4.0x or more | 46 (41.4%) | 14 (16.9%) |
| Total | 111 (100.0%) | 83 (100.0%) |
Real Estate Taxes by Mortgage Status in Walker
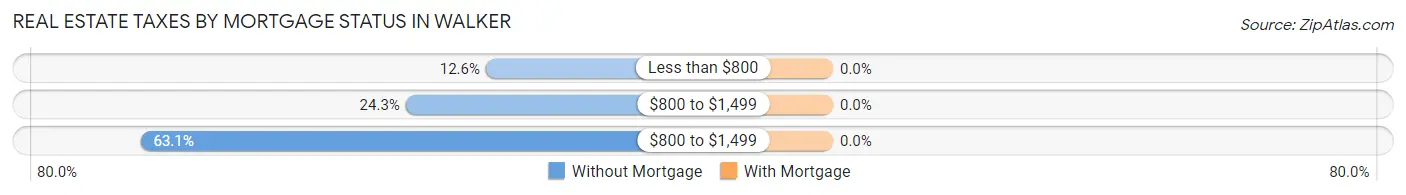
| Property Taxes | Without Mortgage | With Mortgage |
| Less than $800 | 14 (12.6%) | 0 (0.0%) |
| $800 to $1,499 | 27 (24.3%) | 0 (0.0%) |
| $800 to $1,499 | 70 (63.1%) | 0 (0.0%) |
| Total | 111 (100.0%) | 83 (100.0%) |
Health & Disability in Walker
Health Insurance Coverage by Age in Walker
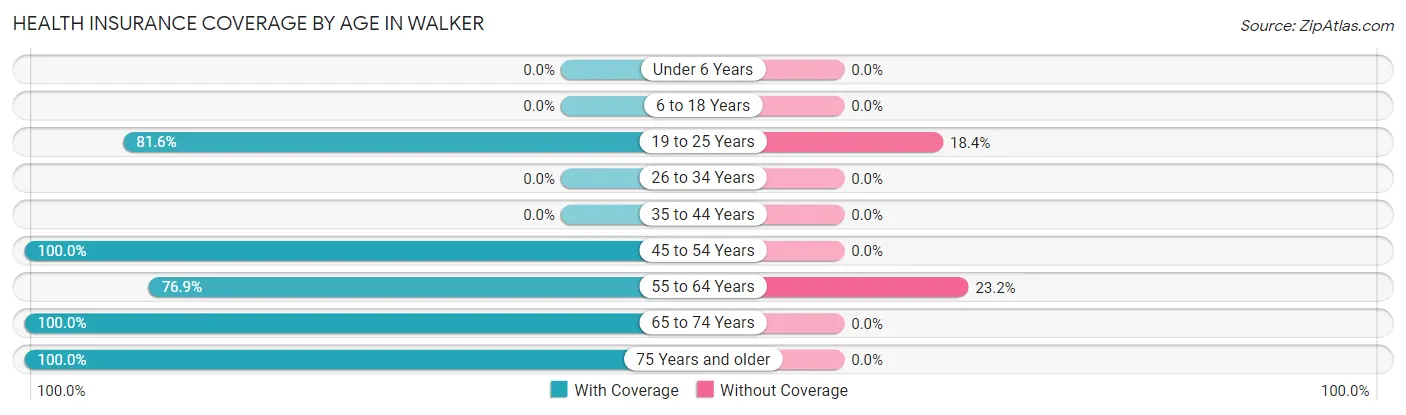
| Age Bracket | With Coverage | Without Coverage |
| Under 6 Years | 0 (0.0%) | 0 (0.0%) |
| 6 to 18 Years | 0 (0.0%) | 0 (0.0%) |
| 19 to 25 Years | 93 (81.6%) | 21 (18.4%) |
| 26 to 34 Years | 0 (0.0%) | 0 (0.0%) |
| 35 to 44 Years | 0 (0.0%) | 0 (0.0%) |
| 45 to 54 Years | 22 (100.0%) | 0 (0.0%) |
| 55 to 64 Years | 83 (76.8%) | 25 (23.2%) |
| 65 to 74 Years | 165 (100.0%) | 0 (0.0%) |
| 75 Years and older | 90 (100.0%) | 0 (0.0%) |
| Total | 453 (90.8%) | 46 (9.2%) |
Health Insurance Coverage by Citizenship Status in Walker
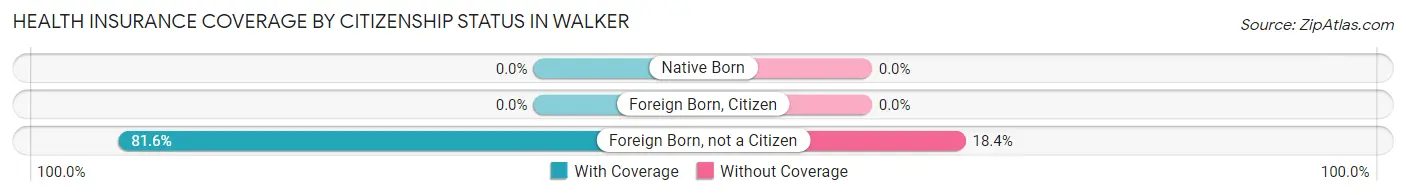
| Citizenship Status | With Coverage | Without Coverage |
| Native Born | 0 (0.0%) | 0 (0.0%) |
| Foreign Born, Citizen | 0 (0.0%) | 0 (0.0%) |
| Foreign Born, not a Citizen | 93 (81.6%) | 21 (18.4%) |
Health Insurance Coverage by Household Income in Walker
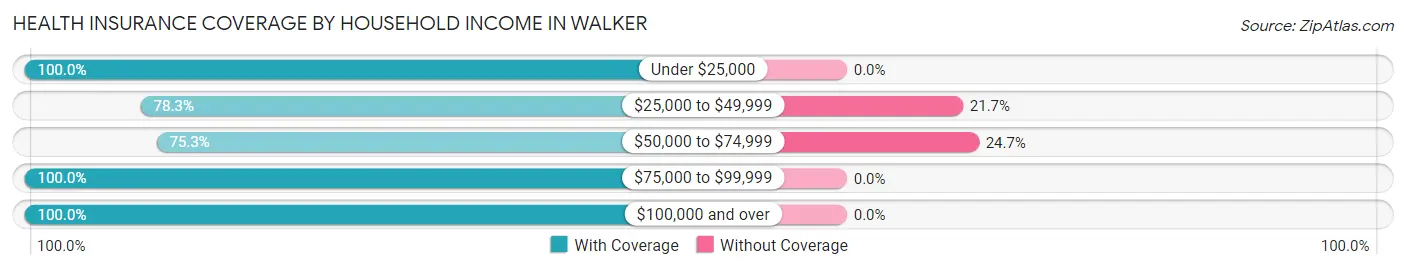
| Household Income | With Coverage | Without Coverage |
| Under $25,000 | 74 (100.0%) | 0 (0.0%) |
| $25,000 to $49,999 | 90 (78.3%) | 25 (21.7%) |
| $50,000 to $74,999 | 64 (75.3%) | 21 (24.7%) |
| $75,000 to $99,999 | 29 (100.0%) | 0 (0.0%) |
| $100,000 and over | 157 (100.0%) | 0 (0.0%) |
Public vs Private Health Insurance Coverage by Age in Walker
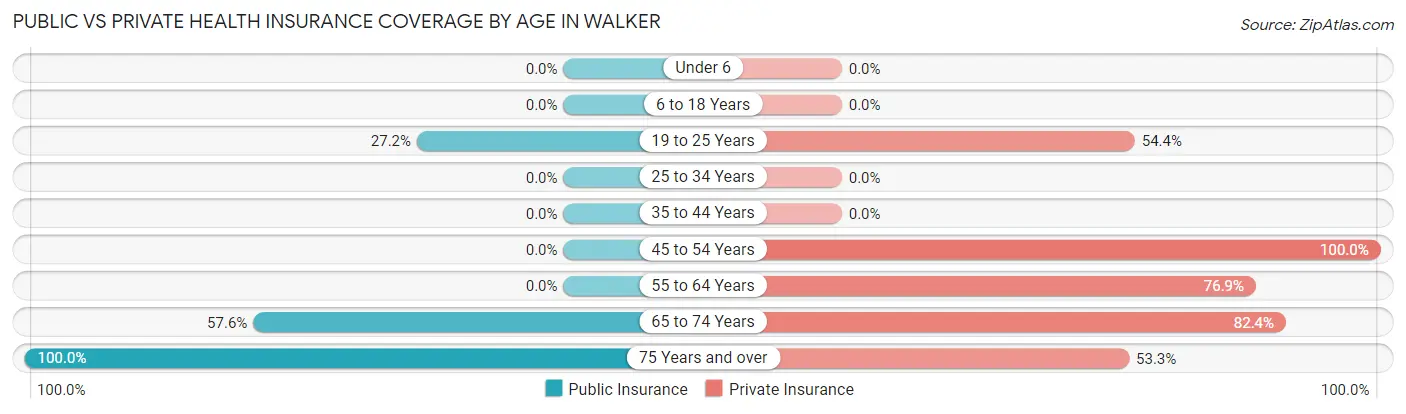
| Age Bracket | Public Insurance | Private Insurance |
| Under 6 | 0 (0.0%) | 0 (0.0%) |
| 6 to 18 Years | 0 (0.0%) | 0 (0.0%) |
| 19 to 25 Years | 31 (27.2%) | 62 (54.4%) |
| 25 to 34 Years | 0 (0.0%) | 0 (0.0%) |
| 35 to 44 Years | 0 (0.0%) | 0 (0.0%) |
| 45 to 54 Years | 0 (0.0%) | 22 (100.0%) |
| 55 to 64 Years | 0 (0.0%) | 83 (76.8%) |
| 65 to 74 Years | 95 (57.6%) | 136 (82.4%) |
| 75 Years and over | 90 (100.0%) | 48 (53.3%) |
| Total | 216 (43.3%) | 351 (70.3%) |
Disability Status by Sex by Age in Walker
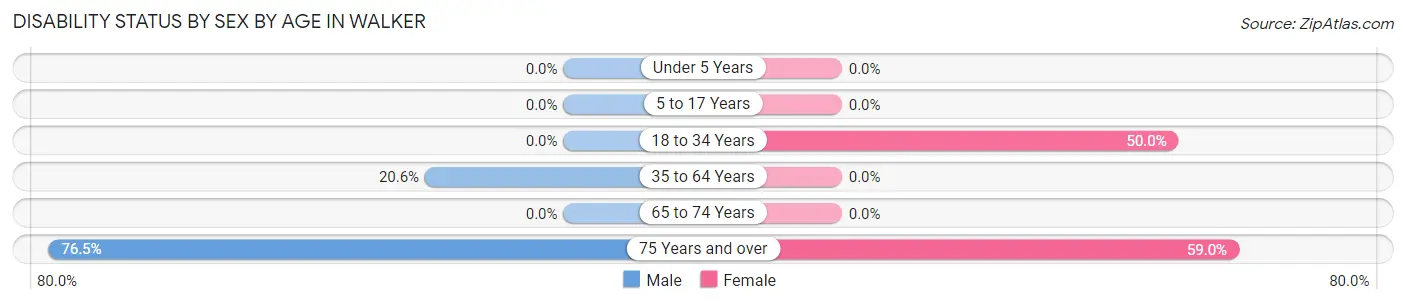
| Age Bracket | Male | Female |
| Under 5 Years | 0 (0.0%) | 0 (0.0%) |
| 5 to 17 Years | 0 (0.0%) | 0 (0.0%) |
| 18 to 34 Years | 0 (0.0%) | 23 (50.0%) |
| 35 to 64 Years | 15 (20.5%) | 0 (0.0%) |
| 65 to 74 Years | 0 (0.0%) | 0 (0.0%) |
| 75 Years and over | 39 (76.5%) | 23 (59.0%) |
Disability Class by Sex by Age in Walker
Disability Class: Hearing Difficulty
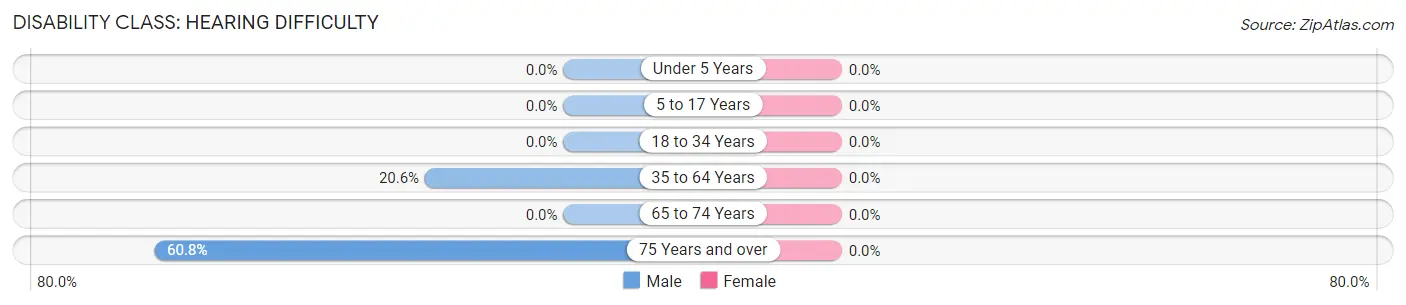
| Age Bracket | Male | Female |
| Under 5 Years | 0 (0.0%) | 0 (0.0%) |
| 5 to 17 Years | 0 (0.0%) | 0 (0.0%) |
| 18 to 34 Years | 0 (0.0%) | 0 (0.0%) |
| 35 to 64 Years | 15 (20.5%) | 0 (0.0%) |
| 65 to 74 Years | 0 (0.0%) | 0 (0.0%) |
| 75 Years and over | 31 (60.8%) | 0 (0.0%) |
Disability Class: Vision Difficulty
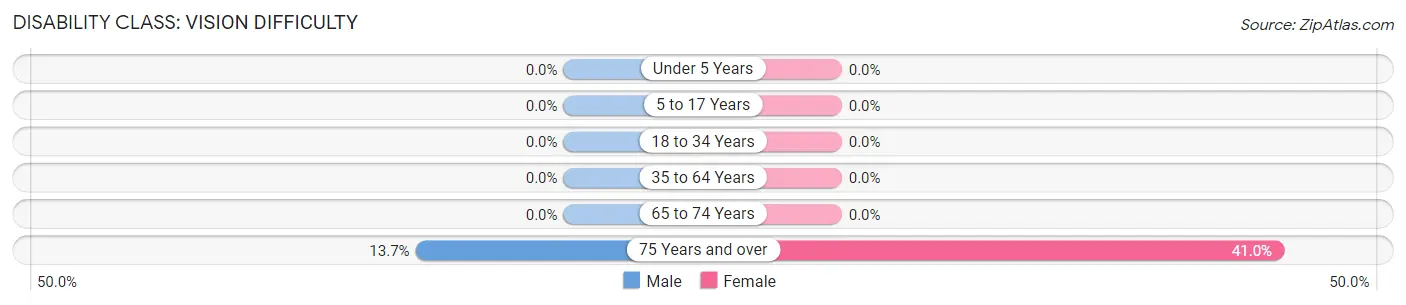
| Age Bracket | Male | Female |
| Under 5 Years | 0 (0.0%) | 0 (0.0%) |
| 5 to 17 Years | 0 (0.0%) | 0 (0.0%) |
| 18 to 34 Years | 0 (0.0%) | 0 (0.0%) |
| 35 to 64 Years | 0 (0.0%) | 0 (0.0%) |
| 65 to 74 Years | 0 (0.0%) | 0 (0.0%) |
| 75 Years and over | 7 (13.7%) | 16 (41.0%) |
Disability Class: Cognitive Difficulty
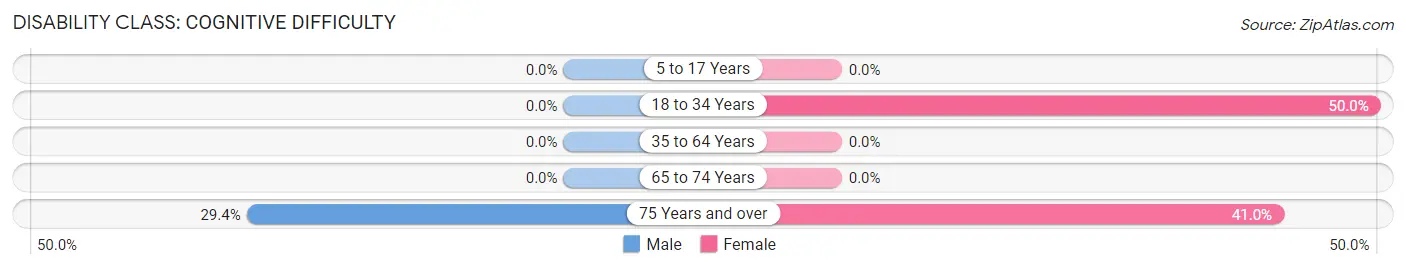
| Age Bracket | Male | Female |
| 5 to 17 Years | 0 (0.0%) | 0 (0.0%) |
| 18 to 34 Years | 0 (0.0%) | 23 (50.0%) |
| 35 to 64 Years | 0 (0.0%) | 0 (0.0%) |
| 65 to 74 Years | 0 (0.0%) | 0 (0.0%) |
| 75 Years and over | 15 (29.4%) | 16 (41.0%) |
Disability Class: Ambulatory Difficulty
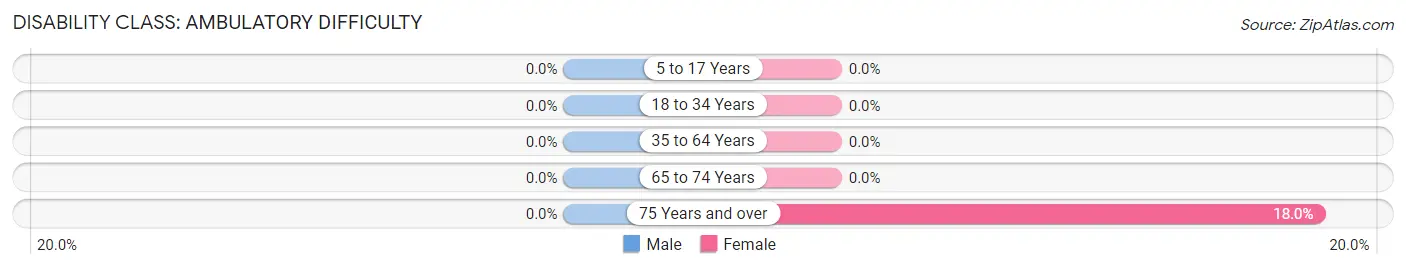
| Age Bracket | Male | Female |
| 5 to 17 Years | 0 (0.0%) | 0 (0.0%) |
| 18 to 34 Years | 0 (0.0%) | 0 (0.0%) |
| 35 to 64 Years | 0 (0.0%) | 0 (0.0%) |
| 65 to 74 Years | 0 (0.0%) | 0 (0.0%) |
| 75 Years and over | 0 (0.0%) | 7 (17.9%) |
Disability Class: Self-Care Difficulty
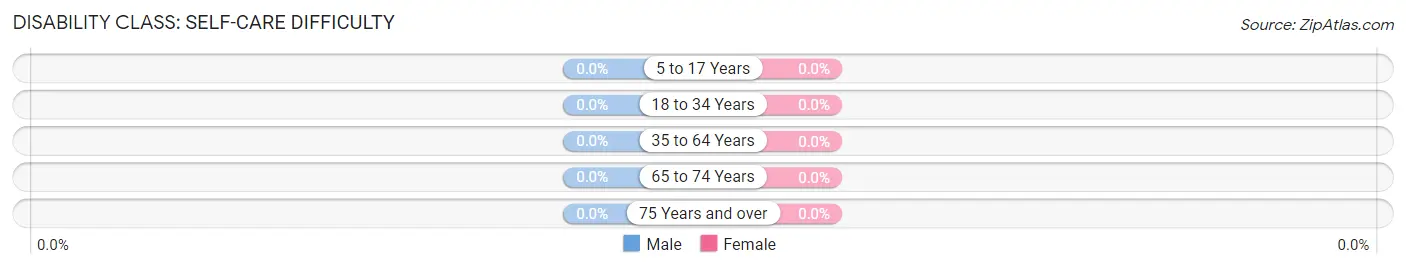
| Age Bracket | Male | Female |
| 5 to 17 Years | 0 (0.0%) | 0 (0.0%) |
| 18 to 34 Years | 0 (0.0%) | 0 (0.0%) |
| 35 to 64 Years | 0 (0.0%) | 0 (0.0%) |
| 65 to 74 Years | 0 (0.0%) | 0 (0.0%) |
| 75 Years and over | 0 (0.0%) | 0 (0.0%) |
Technology Access in Walker
Computing Device Access in Walker
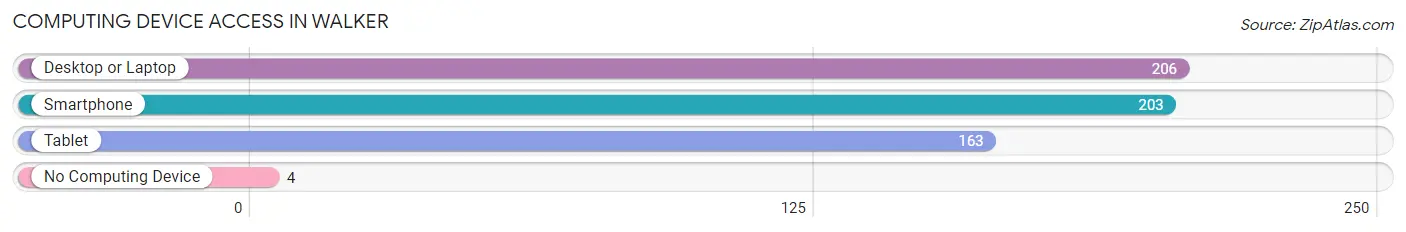
| Device Type | # Households | % Households |
| Desktop or Laptop | 206 | 90.0% |
| Smartphone | 203 | 88.6% |
| Tablet | 163 | 71.2% |
| No Computing Device | 4 | 1.8% |
| Total | 229 | 100.0% |
Internet Access in Walker
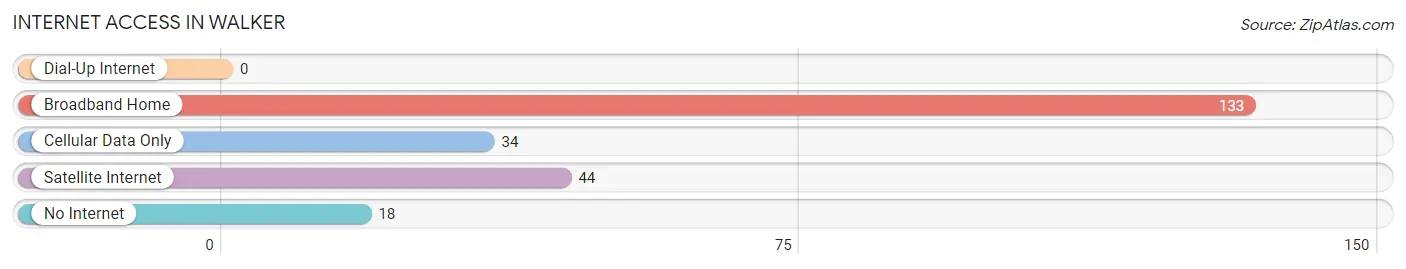
| Internet Type | # Households | % Households |
| Dial-Up Internet | 0 | 0.0% |
| Broadband Home | 133 | 58.1% |
| Cellular Data Only | 34 | 14.8% |
| Satellite Internet | 44 | 19.2% |
| No Internet | 18 | 7.9% |
| Total | 229 | 100.0% |
Walker Summary
Walker is a small unincorporated community located in the Sierra Nevada foothills of California, in Placer County. It is situated in the Sierra Nevada mountain range, approximately 25 miles northeast of Sacramento. The community is located along the North Fork of the American River, and is surrounded by the Tahoe National Forest.
History
Walker was first settled in the late 1800s by miners and loggers who were attracted to the area by the abundance of natural resources. The town was named after a local miner, John Walker, who was one of the first settlers in the area. The town was officially established in 1891, and the first post office was established in 1892.
In the early 1900s, Walker was a thriving community with a population of over 500 people. The town had a general store, a hotel, a blacksmith shop, a school, and several other businesses. The town was also home to a number of logging and mining operations.
In the 1920s, the population of Walker began to decline as the logging and mining operations moved away. By the 1950s, the population had dropped to less than 100 people.
Geography
Walker is located in the Sierra Nevada mountain range, approximately 25 miles northeast of Sacramento. The town is situated along the North Fork of the American River, and is surrounded by the Tahoe National Forest. The area is known for its rugged terrain and scenic beauty.
The climate in Walker is typical of the Sierra Nevada foothills, with hot summers and cold winters. The average annual temperature is around 50 degrees Fahrenheit, and the average annual precipitation is around 25 inches.
Economy
Walker is a small, rural community with a population of less than 200 people. The town is primarily a bedroom community, with most of its residents commuting to nearby towns and cities for work.
The primary industries in Walker are tourism and recreation. The town is a popular destination for outdoor enthusiasts, and there are several campgrounds and recreational areas in the area. The town is also home to a number of small businesses, including a general store, a cafe, and a few other retail establishments.
Demographics
As of the 2010 census, the population of Walker was 186 people. The racial makeup of the town was 94.3% White, 0.5% African American, 0.5% Native American, 0.5% Asian, 0.5% Pacific Islander, and 3.2% from other races. The median household income was $45,000, and the median age was 44.
Walker is a small, rural community with a population of less than 200 people. The town is primarily a bedroom community, with most of its residents commuting to nearby towns and cities for work. The town is a popular destination for outdoor enthusiasts, and there are several campgrounds and recreational areas in the area. The town is also home to a number of small businesses, including a general store, a cafe, and a few other retail establishments.
Common Questions
What is Per Capita Income in Walker?
Per Capita income in Walker is $36,828.
What is the Median Family Income in Walker?
Median Family Income in Walker is $55,119.
What is the Median Household income in Walker?
Median Household Income in Walker is $55,149.
What is Inequality or Gini Index in Walker?
Inequality or Gini Index in Walker is 0.51.
What is the Total Population of Walker?
Total Population of Walker is 499.
What is the Total Male Population of Walker?
Total Male Population of Walker is 256.
What is the Total Female Population of Walker?
Total Female Population of Walker is 243.
What is the Ratio of Males per 100 Females in Walker?
There are 105.35 Males per 100 Females in Walker.
What is the Ratio of Females per 100 Males in Walker?
There are 94.92 Females per 100 Males in Walker.
What is the Median Population Age in Walker?
Median Population Age in Walker is 66.0 Years.
What is the Average Family Size in Walker
Average Family Size in Walker is 2.3 People.
What is the Average Household Size in Walker
Average Household Size in Walker is 2.0 People.
How Large is the Labor Force in Walker?
There are 117 People in the Labor Forcein in Walker.
What is the Percentage of People in the Labor Force in Walker?
23.4% of People are in the Labor Force in Walker.