Cities with the Highest Percentage of Households with Income Above $200,000 in California
RELATED REPORTS & OPTIONS
Household Income | $200k+
California
Compare Cities
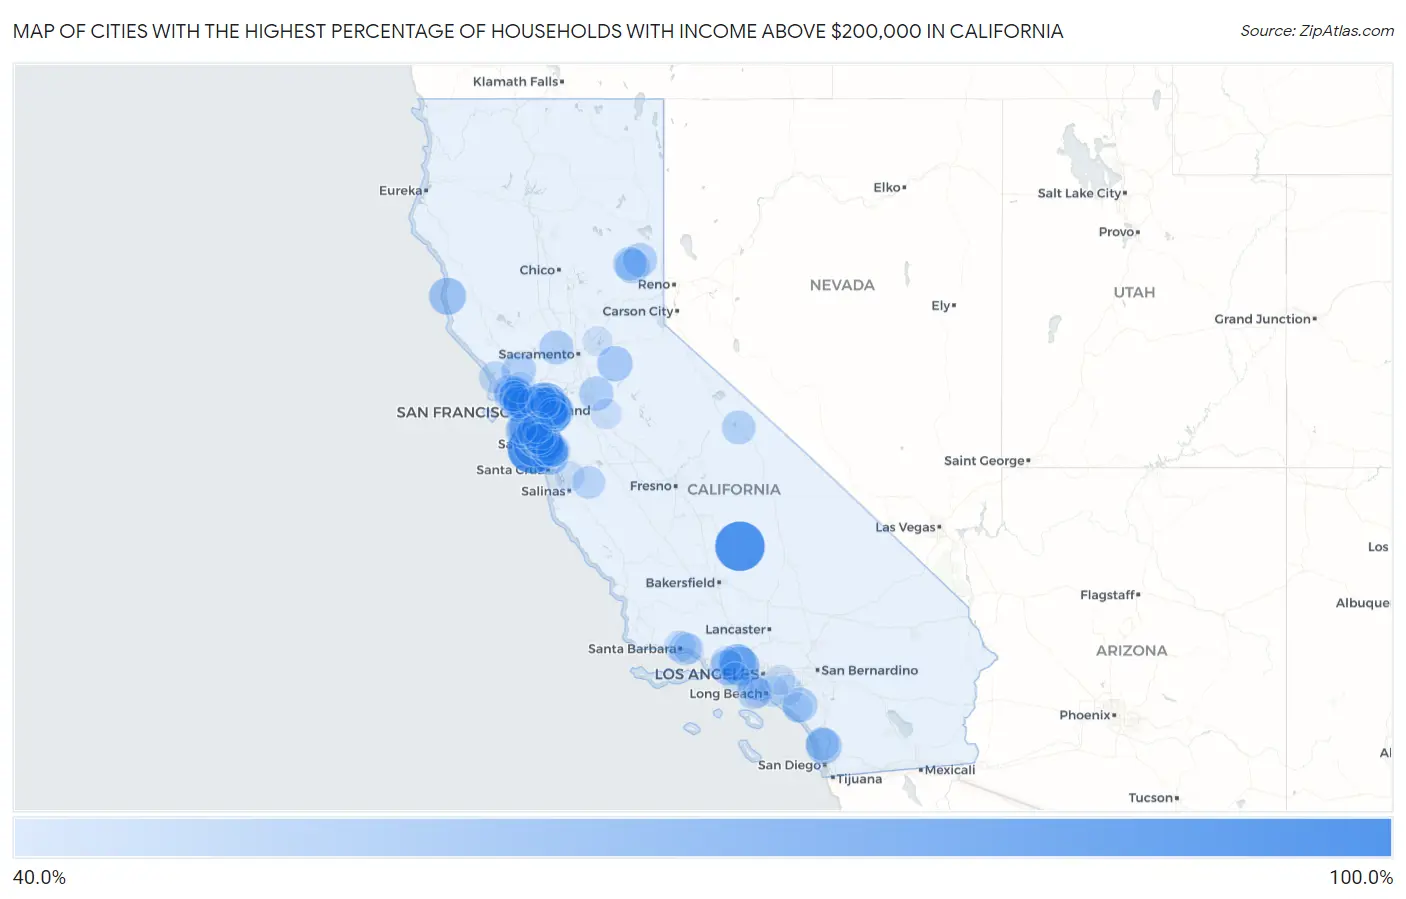
Map of Cities with the Highest Percentage of Households with Income Above $200,000 in California
0.0%
100.0%
Cities with the Highest Percentage of Households with Income Above $200,000 in California
| City | Households with Income > $200k | vs State | vs National | |
| 1. | Loma Mar | 100.0% | 17.9%(+82.1)#1 | 11.4%(+88.6)#5 |
| 2. | California Hot Springs | 100.0% | 17.9%(+82.1)#2 | 11.4%(+88.6)#17 |
| 3. | La Honda | 82.7% | 17.9%(+64.8)#3 | 11.4%(+71.3)#28 |
| 4. | Norris Canyon | 78.4% | 17.9%(+60.5)#4 | 11.4%(+67.0)#37 |
| 5. | Goodmanville | 76.2% | 17.9%(+58.3)#5 | 11.4%(+64.8)#43 |
| 6. | Emerald Lake Hills | 70.3% | 17.9%(+52.4)#6 | 11.4%(+58.9)#72 |
| 7. | Shell Ridge | 69.9% | 17.9%(+52.0)#7 | 11.4%(+58.5)#76 |
| 8. | Hillsborough | 69.6% | 17.9%(+51.7)#8 | 11.4%(+58.2)#78 |
| 9. | Hidden Hills | 69.5% | 17.9%(+51.6)#9 | 11.4%(+58.1)#80 |
| 10. | Woodside | 69.0% | 17.9%(+51.1)#10 | 11.4%(+57.6)#86 |
| 11. | Piedmont | 68.2% | 17.9%(+50.3)#11 | 11.4%(+56.8)#90 |
| 12. | Atherton | 68.1% | 17.9%(+50.2)#12 | 11.4%(+56.7)#92 |
| 13. | Castle Hill | 66.6% | 17.9%(+48.7)#13 | 11.4%(+55.2)#103 |
| 14. | Los Altos Hills | 66.3% | 17.9%(+48.4)#14 | 11.4%(+54.9)#104 |
| 15. | Loyola | 66.3% | 17.9%(+48.4)#15 | 11.4%(+54.9)#105 |
| 16. | Alamo | 65.7% | 17.9%(+47.8)#16 | 11.4%(+54.3)#108 |
| 17. | Lexington Hills | 64.9% | 17.9%(+47.0)#17 | 11.4%(+53.5)#115 |
| 18. | Caspar | 64.8% | 17.9%(+46.9)#18 | 11.4%(+53.4)#117 |
| 19. | West Menlo Park | 64.6% | 17.9%(+46.7)#19 | 11.4%(+53.2)#121 |
| 20. | Los Altos | 64.2% | 17.9%(+46.3)#20 | 11.4%(+52.8)#123 |
| 21. | Bell Canyon | 64.2% | 17.9%(+46.3)#21 | 11.4%(+52.8)#124 |
| 22. | Mountain Meadows | 63.9% | 17.9%(+46.0)#22 | 11.4%(+52.5)#126 |
| 23. | Ross | 63.0% | 17.9%(+45.1)#23 | 11.4%(+51.6)#137 |
| 24. | Williams Canyon | 62.5% | 17.9%(+44.6)#24 | 11.4%(+51.1)#145 |
| 25. | Fairbanks Ranch | 61.3% | 17.9%(+43.4)#25 | 11.4%(+49.9)#158 |
| 26. | Diablo | 61.2% | 17.9%(+43.3)#26 | 11.4%(+49.8)#159 |
| 27. | Monte Sereno | 60.9% | 17.9%(+43.0)#27 | 11.4%(+49.5)#167 |
| 28. | Orinda | 60.8% | 17.9%(+42.9)#28 | 11.4%(+49.4)#169 |
| 29. | Reliez Valley | 60.4% | 17.9%(+42.5)#29 | 11.4%(+49.0)#176 |
| 30. | Drytown | 60.0% | 17.9%(+42.1)#30 | 11.4%(+48.6)#188 |
| 31. | Camino Tassajara | 59.6% | 17.9%(+41.7)#31 | 11.4%(+48.2)#196 |
| 32. | Alto | 59.3% | 17.9%(+41.4)#32 | 11.4%(+47.9)#207 |
| 33. | Lake Sherwood | 59.1% | 17.9%(+41.2)#33 | 11.4%(+47.7)#209 |
| 34. | Belvedere | 58.9% | 17.9%(+41.0)#34 | 11.4%(+47.5)#212 |
| 35. | Highlands | 58.7% | 17.9%(+40.8)#35 | 11.4%(+47.3)#214 |
| 36. | Coto De Caza | 58.6% | 17.9%(+40.7)#36 | 11.4%(+47.2)#217 |
| 37. | Portola Valley | 58.6% | 17.9%(+40.7)#37 | 11.4%(+47.2)#218 |
| 38. | Saratoga | 58.3% | 17.9%(+40.4)#38 | 11.4%(+46.9)#223 |
| 39. | Tamalpais Homestead Valley | 58.0% | 17.9%(+40.1)#39 | 11.4%(+46.6)#228 |
| 40. | Blackhawk | 57.4% | 17.9%(+39.5)#40 | 11.4%(+46.0)#240 |
| 41. | Waterloo | 57.3% | 17.9%(+39.4)#41 | 11.4%(+45.9)#243 |
| 42. | Mabie | 57.3% | 17.9%(+39.4)#42 | 11.4%(+45.9)#244 |
| 43. | San Geronimo | 56.7% | 17.9%(+38.8)#43 | 11.4%(+45.3)#253 |
| 44. | Beckwourth | 56.5% | 17.9%(+38.6)#44 | 11.4%(+45.1)#258 |
| 45. | Monument Hills | 56.3% | 17.9%(+38.4)#45 | 11.4%(+44.9)#264 |
| 46. | Glen Ellen | 56.3% | 17.9%(+38.4)#46 | 11.4%(+44.9)#265 |
| 47. | El Granada | 56.1% | 17.9%(+38.2)#47 | 11.4%(+44.7)#269 |
| 48. | Foresta | 55.8% | 17.9%(+37.9)#48 | 11.4%(+44.4)#278 |
| 49. | Sunny Slopes | 55.6% | 17.9%(+37.7)#49 | 11.4%(+44.2)#280 |
| 50. | Mohawk Vista | 55.6% | 17.9%(+37.7)#50 | 11.4%(+44.2)#281 |
| 51. | Palos Verdes Estates | 54.9% | 17.9%(+37.0)#51 | 11.4%(+43.5)#295 |
| 52. | San Miguel Cdp Contra Costa County | 54.9% | 17.9%(+37.0)#52 | 11.4%(+43.5)#297 |
| 53. | Cupertino | 54.7% | 17.9%(+36.8)#53 | 11.4%(+43.3)#304 |
| 54. | Rancho Santa Fe | 54.6% | 17.9%(+36.7)#54 | 11.4%(+43.2)#311 |
| 55. | Sleepy Hollow | 54.2% | 17.9%(+36.3)#55 | 11.4%(+42.8)#327 |
| 56. | Montecito | 53.9% | 17.9%(+36.0)#56 | 11.4%(+42.5)#335 |
| 57. | Lafayette | 53.6% | 17.9%(+35.7)#57 | 11.4%(+42.2)#342 |
| 58. | Corte Madera | 53.6% | 17.9%(+35.7)#58 | 11.4%(+42.2)#343 |
| 59. | Harmony Grove | 53.6% | 17.9%(+35.7)#59 | 11.4%(+42.2)#345 |
| 60. | San Carlos | 53.2% | 17.9%(+35.3)#60 | 11.4%(+41.8)#352 |
| 61. | Nicasio | 53.1% | 17.9%(+35.2)#61 | 11.4%(+41.7)#362 |
| 62. | Cambrian Park | 53.0% | 17.9%(+35.1)#62 | 11.4%(+41.6)#364 |
| 63. | Tres Pinos | 52.6% | 17.9%(+34.7)#63 | 11.4%(+41.2)#375 |
| 64. | La Canada Flintridge | 52.4% | 17.9%(+34.5)#64 | 11.4%(+41.0)#379 |
| 65. | Palo Alto | 52.0% | 17.9%(+34.1)#65 | 11.4%(+40.6)#385 |
| 66. | Lucas Valley Marinwood | 52.0% | 17.9%(+34.1)#66 | 11.4%(+40.6)#387 |
| 67. | Danville | 51.4% | 17.9%(+33.5)#67 | 11.4%(+40.0)#409 |
| 68. | Kentfield | 51.1% | 17.9%(+33.2)#68 | 11.4%(+39.7)#417 |
| 69. | Dillon Beach | 51.1% | 17.9%(+33.2)#69 | 11.4%(+39.7)#420 |
| 70. | Tiburon | 50.8% | 17.9%(+32.9)#70 | 11.4%(+39.4)#426 |
| 71. | North Gate | 50.4% | 17.9%(+32.5)#71 | 11.4%(+39.0)#434 |
| 72. | Mill Valley | 50.1% | 17.9%(+32.2)#72 | 11.4%(+38.7)#439 |
| 73. | Baywood Park | 50.0% | 17.9%(+32.1)#73 | 11.4%(+38.6)#445 |
| 74. | Kensington | 49.9% | 17.9%(+32.0)#74 | 11.4%(+38.5)#457 |
| 75. | Los Gatos | 49.5% | 17.9%(+31.6)#75 | 11.4%(+38.1)#468 |
| 76. | Menlo Park | 49.2% | 17.9%(+31.3)#76 | 11.4%(+37.8)#475 |
| 77. | Moraga | 49.2% | 17.9%(+31.3)#77 | 11.4%(+37.8)#476 |
| 78. | Mission Canyon | 49.1% | 17.9%(+31.2)#78 | 11.4%(+37.7)#480 |
| 79. | Alhambra Valley | 48.7% | 17.9%(+30.8)#79 | 11.4%(+37.3)#490 |
| 80. | Black Point Green Point | 48.4% | 17.9%(+30.5)#80 | 11.4%(+37.0)#497 |
| 81. | Dublin | 48.2% | 17.9%(+30.3)#81 | 11.4%(+36.8)#500 |
| 82. | Belmont | 48.2% | 17.9%(+30.3)#82 | 11.4%(+36.8)#501 |
| 83. | San Ramon | 47.9% | 17.9%(+30.0)#83 | 11.4%(+36.5)#509 |
| 84. | Rossmoor | 47.9% | 17.9%(+30.0)#84 | 11.4%(+36.5)#510 |
| 85. | Ladera | 47.4% | 17.9%(+29.5)#85 | 11.4%(+36.0)#522 |
| 86. | Foster City | 47.2% | 17.9%(+29.3)#86 | 11.4%(+35.8)#527 |
| 87. | Manhattan Beach | 47.1% | 17.9%(+29.2)#87 | 11.4%(+35.7)#533 |
| 88. | Woodacre | 47.1% | 17.9%(+29.2)#88 | 11.4%(+35.7)#534 |
| 89. | Acalanes Ridge | 46.9% | 17.9%(+29.0)#89 | 11.4%(+35.5)#539 |
| 90. | Villa Park | 46.8% | 17.9%(+28.9)#90 | 11.4%(+35.4)#544 |
| 91. | Santa Rosa Valley | 46.8% | 17.9%(+28.9)#91 | 11.4%(+35.4)#547 |
| 92. | Del Rio | 46.8% | 17.9%(+28.9)#92 | 11.4%(+35.4)#549 |
| 93. | La Habra Heights | 46.7% | 17.9%(+28.8)#93 | 11.4%(+35.3)#556 |
| 94. | Toro Canyon | 46.6% | 17.9%(+28.7)#94 | 11.4%(+35.2)#562 |
| 95. | Rolling Hills Estates | 46.4% | 17.9%(+28.5)#95 | 11.4%(+35.0)#565 |
| 96. | Montara | 46.1% | 17.9%(+28.2)#96 | 11.4%(+34.7)#574 |
| 97. | Malibu | 45.9% | 17.9%(+28.0)#97 | 11.4%(+34.5)#580 |
| 98. | Aromas | 45.8% | 17.9%(+27.9)#98 | 11.4%(+34.4)#584 |
| 99. | Ladera Ranch | 45.6% | 17.9%(+27.7)#99 | 11.4%(+34.2)#591 |
| 100. | Granite Bay | 45.6% | 17.9%(+27.7)#100 | 11.4%(+34.2)#592 |
Common Questions
What are the Top 10 Cities with the Highest Percentage of Households with Income Above $200,000 in California?
Top 10 Cities with the Highest Percentage of Households with Income Above $200,000 in California are:
#1
100.0%
#2
100.0%
#3
82.7%
#4
78.4%
#5
70.3%
#6
69.9%
#7
69.6%
#8
69.5%
#9
69.0%
#10
68.2%
What city has the Highest Percentage of Households with Income Above $200,000 in California?
Loma Mar has the Highest Percentage of Households with Income Above $200,000 in California with 100.0%.
What is the Percentage of Households with Income Above $200,000 in the State of California?
Percentage of Households with Income Above $200,000 in California is 17.9%.
What is the Percentage of Households with Income Above $200,000 in the United States?
Percentage of Households with Income Above $200,000 in the United States is 11.4%.