Cities with the Highest Percentage of Population Employed in Health Care & Social Assistance in California
RELATED REPORTS & OPTIONS
Health Care & Social Assistance
California
Compare Cities
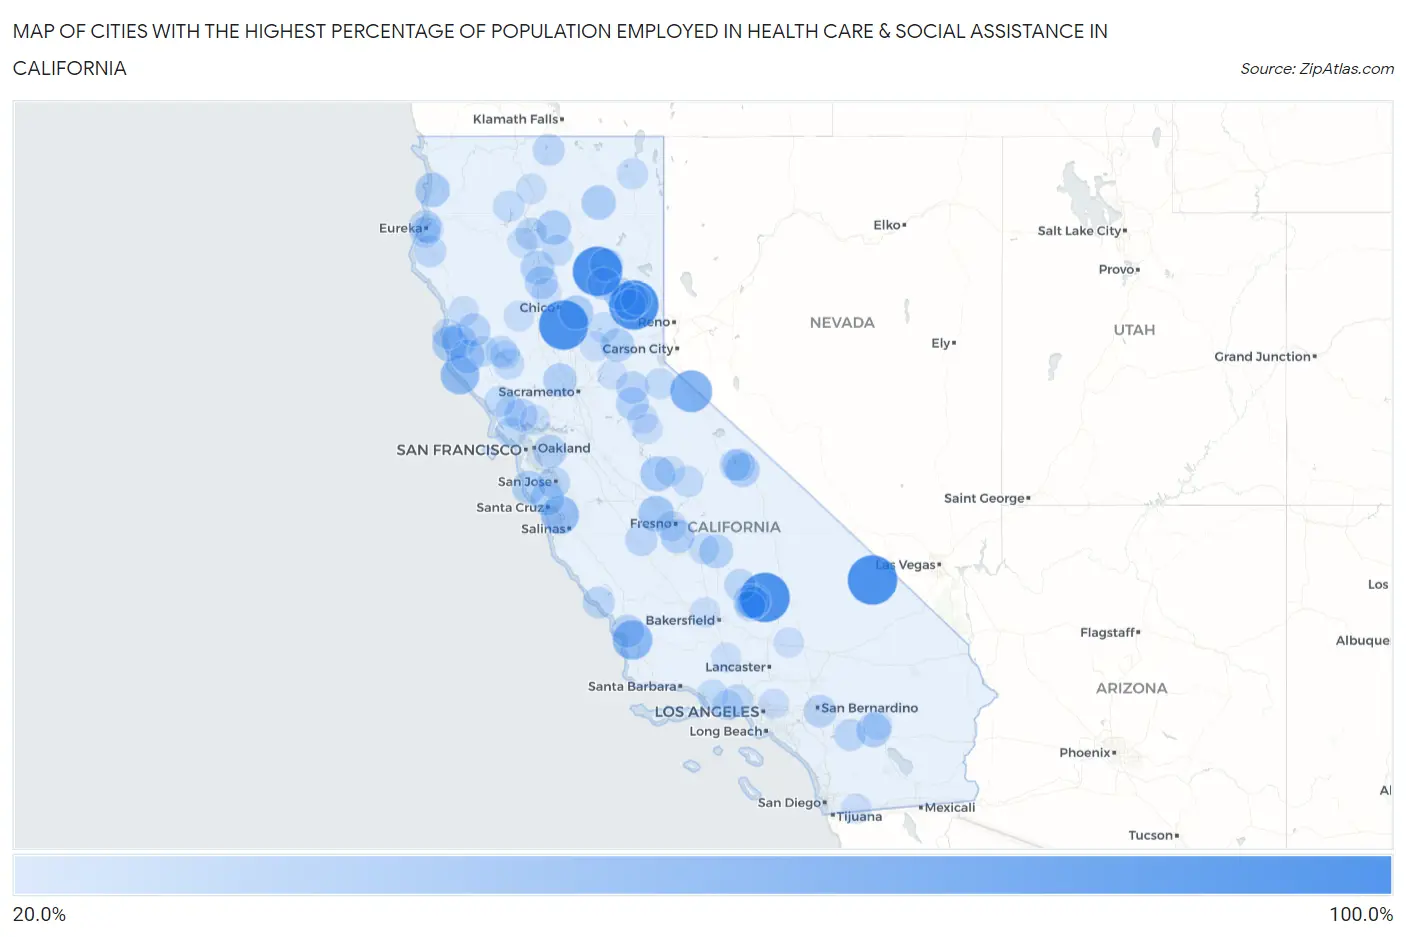
Map of Cities with the Highest Percentage of Population Employed in Health Care & Social Assistance in California
0.0%
100.0%
Cities with the Highest Percentage of Population Employed in Health Care & Social Assistance in California
| City | % Employed | vs State | vs National | |
| 1. | Onyx | 100.0% | 12.7%(+87.3)#1 | 13.9%(+86.1)#3 |
| 2. | Richvale | 100.0% | 12.7%(+87.3)#2 | 13.9%(+86.1)#9 |
| 3. | El Monte Mobile | 100.0% | 12.7%(+87.3)#3 | 13.9%(+86.1)#22 |
| 4. | Gold Mountain | 100.0% | 12.7%(+87.3)#4 | 13.9%(+86.1)#26 |
| 5. | Prattville | 100.0% | 12.7%(+87.3)#5 | 13.9%(+86.1)#41 |
| 6. | Shoshone | 100.0% | 12.7%(+87.3)#6 | 13.9%(+86.1)#58 |
| 7. | Coleville | 69.0% | 12.7%(+56.3)#7 | 13.9%(+55.1)#123 |
| 8. | Los Berros | 59.5% | 12.7%(+46.8)#8 | 13.9%(+45.6)#189 |
| 9. | Anchor Bay | 55.7% | 12.7%(+43.0)#9 | 13.9%(+41.8)#228 |
| 10. | Pajaro Dunes | 53.3% | 12.7%(+40.6)#10 | 13.9%(+39.4)#269 |
| 11. | Mohawk Vista | 50.0% | 12.7%(+37.3)#11 | 13.9%(+36.1)#338 |
| 12. | Ono | 50.0% | 12.7%(+37.3)#12 | 13.9%(+36.1)#339 |
| 13. | La Vina | 44.7% | 12.7%(+32.0)#13 | 13.9%(+30.8)#450 |
| 14. | Albion | 43.8% | 12.7%(+31.0)#14 | 13.9%(+29.8)#476 |
| 15. | Catheys Valley | 41.4% | 12.7%(+28.7)#15 | 13.9%(+27.5)#543 |
| 16. | Orick | 40.1% | 12.7%(+27.4)#16 | 13.9%(+26.2)#581 |
| 17. | Mountain Mesa | 40.0% | 12.7%(+27.3)#17 | 13.9%(+26.1)#584 |
| 18. | Round Mountain | 40.0% | 12.7%(+27.3)#18 | 13.9%(+26.1)#593 |
| 19. | Desert Palms | 39.8% | 12.7%(+27.1)#19 | 13.9%(+25.9)#605 |
| 20. | Bieber | 39.4% | 12.7%(+26.7)#20 | 13.9%(+25.5)#614 |
| 21. | Cherokee | 39.0% | 12.7%(+26.2)#21 | 13.9%(+25.0)#638 |
| 22. | Comptche | 38.8% | 12.7%(+26.0)#22 | 13.9%(+24.8)#646 |
| 23. | Monmouth | 38.7% | 12.7%(+26.0)#23 | 13.9%(+24.8)#648 |
| 24. | Knights Ferry | 38.2% | 12.7%(+25.4)#24 | 13.9%(+24.2)#681 |
| 25. | Philo | 37.9% | 12.7%(+25.2)#25 | 13.9%(+24.0)#690 |
| 26. | Paradise | 37.7% | 12.7%(+25.0)#26 | 13.9%(+23.8)#696 |
| 27. | Lindcove | 37.4% | 12.7%(+24.6)#27 | 13.9%(+23.4)#717 |
| 28. | Bend | 37.2% | 12.7%(+24.5)#28 | 13.9%(+23.3)#722 |
| 29. | Zayante | 37.2% | 12.7%(+24.4)#29 | 13.9%(+23.2)#725 |
| 30. | Alta | 36.5% | 12.7%(+23.7)#30 | 13.9%(+22.5)#767 |
| 31. | Yolo | 36.4% | 12.7%(+23.6)#31 | 13.9%(+22.4)#774 |
| 32. | Pescadero | 36.3% | 12.7%(+23.6)#32 | 13.9%(+22.4)#784 |
| 33. | Lake Isabella | 36.1% | 12.7%(+23.4)#33 | 13.9%(+22.2)#788 |
| 34. | Norris Canyon | 35.7% | 12.7%(+22.9)#34 | 13.9%(+21.7)#823 |
| 35. | Westwood | 35.4% | 12.7%(+22.7)#35 | 13.9%(+21.5)#848 |
| 36. | Los Ranchos | 34.6% | 12.7%(+21.9)#36 | 13.9%(+20.7)#906 |
| 37. | Gerber | 34.4% | 12.7%(+21.7)#37 | 13.9%(+20.5)#929 |
| 38. | Greenhorn | 34.0% | 12.7%(+21.2)#38 | 13.9%(+20.0)#963 |
| 39. | Willits | 33.9% | 12.7%(+21.1)#39 | 13.9%(+19.9)#975 |
| 40. | West Point | 33.7% | 12.7%(+20.9)#40 | 13.9%(+19.7)#991 |
| 41. | Twain | 33.3% | 12.7%(+20.6)#41 | 13.9%(+19.4)#1,011 |
| 42. | Sunny Slopes | 33.3% | 12.7%(+20.6)#42 | 13.9%(+19.4)#1,035 |
| 43. | Loma Linda | 32.8% | 12.7%(+20.1)#43 | 13.9%(+18.9)#1,092 |
| 44. | Temelec | 32.7% | 12.7%(+20.0)#44 | 13.9%(+18.8)#1,099 |
| 45. | Grizzly Flats | 32.6% | 12.7%(+19.8)#45 | 13.9%(+18.6)#1,114 |
| 46. | Fruitdale | 32.1% | 12.7%(+19.3)#46 | 13.9%(+18.1)#1,184 |
| 47. | Samoa | 31.6% | 12.7%(+18.9)#47 | 13.9%(+17.7)#1,245 |
| 48. | Three Rocks | 31.4% | 12.7%(+18.7)#48 | 13.9%(+17.5)#1,272 |
| 49. | San Simeon | 30.7% | 12.7%(+18.0)#49 | 13.9%(+16.8)#1,364 |
| 50. | Scotia | 30.6% | 12.7%(+17.9)#50 | 13.9%(+16.7)#1,374 |
| 51. | Mountain Gate | 30.1% | 12.7%(+17.3)#51 | 13.9%(+16.1)#1,454 |
| 52. | Pine Flat | 30.0% | 12.7%(+17.3)#52 | 13.9%(+16.1)#1,465 |
| 53. | Mountain Center | 30.0% | 12.7%(+17.3)#53 | 13.9%(+16.1)#1,477 |
| 54. | Macdoel | 29.9% | 12.7%(+17.1)#54 | 13.9%(+15.9)#1,502 |
| 55. | Squirrel Mountain Valley | 29.6% | 12.7%(+16.8)#55 | 13.9%(+15.6)#1,542 |
| 56. | Franklin Cdp Merced County | 28.7% | 12.7%(+16.0)#56 | 13.9%(+14.8)#1,688 |
| 57. | Coffee Creek | 28.4% | 12.7%(+15.7)#57 | 13.9%(+14.5)#1,759 |
| 58. | Penngrove | 28.2% | 12.7%(+15.4)#58 | 13.9%(+14.2)#1,814 |
| 59. | Bass Lake | 27.9% | 12.7%(+15.2)#59 | 13.9%(+14.0)#1,848 |
| 60. | San Geronimo | 27.9% | 12.7%(+15.1)#60 | 13.9%(+13.9)#1,863 |
| 61. | Clio | 27.8% | 12.7%(+15.0)#61 | 13.9%(+13.8)#1,875 |
| 62. | Crowley Lake | 27.7% | 12.7%(+15.0)#62 | 13.9%(+13.8)#1,888 |
| 63. | Shingletown | 27.6% | 12.7%(+14.9)#63 | 13.9%(+13.7)#1,909 |
| 64. | Nice | 27.6% | 12.7%(+14.8)#64 | 13.9%(+13.6)#1,929 |
| 65. | Daphnedale Park | 27.5% | 12.7%(+14.8)#65 | 13.9%(+13.6)#1,931 |
| 66. | Bell Canyon | 27.5% | 12.7%(+14.8)#66 | 13.9%(+13.6)#1,933 |
| 67. | Graton | 27.5% | 12.7%(+14.8)#67 | 13.9%(+13.6)#1,943 |
| 68. | Clearlake Riviera | 27.3% | 12.7%(+14.6)#68 | 13.9%(+13.4)#1,965 |
| 69. | Saticoy | 27.1% | 12.7%(+14.4)#69 | 13.9%(+13.2)#2,013 |
| 70. | Del Dios | 27.1% | 12.7%(+14.3)#70 | 13.9%(+13.1)#2,023 |
| 71. | Patterson Tract | 26.7% | 12.7%(+14.0)#71 | 13.9%(+12.8)#2,109 |
| 72. | Camptonville | 26.7% | 12.7%(+13.9)#72 | 13.9%(+12.7)#2,118 |
| 73. | Kirkwood | 26.5% | 12.7%(+13.7)#73 | 13.9%(+12.5)#2,179 |
| 74. | Humboldt Hill | 26.2% | 12.7%(+13.5)#74 | 13.9%(+12.3)#2,240 |
| 75. | Talmage | 26.1% | 12.7%(+13.4)#75 | 13.9%(+12.2)#2,271 |
| 76. | Lake Sherwood | 26.0% | 12.7%(+13.3)#76 | 13.9%(+12.1)#2,295 |
| 77. | West Park | 25.8% | 12.7%(+13.0)#77 | 13.9%(+11.8)#2,365 |
| 78. | Laytonville | 25.5% | 12.7%(+12.8)#78 | 13.9%(+11.6)#2,432 |
| 79. | Mount Shasta | 25.4% | 12.7%(+12.7)#79 | 13.9%(+11.5)#2,455 |
| 80. | Bootjack | 25.4% | 12.7%(+12.7)#80 | 13.9%(+11.5)#2,466 |
| 81. | Caspar | 25.3% | 12.7%(+12.6)#81 | 13.9%(+11.4)#2,493 |
| 82. | Bodfish | 25.2% | 12.7%(+12.4)#82 | 13.9%(+11.2)#2,550 |
| 83. | Elk Creek | 25.0% | 12.7%(+12.3)#83 | 13.9%(+11.1)#2,632 |
| 84. | Amador Pines | 24.9% | 12.7%(+12.2)#84 | 13.9%(+11.0)#2,669 |
| 85. | Avery | 24.7% | 12.7%(+12.0)#85 | 13.9%(+10.8)#2,732 |
| 86. | American Canyon | 24.6% | 12.7%(+11.8)#86 | 13.9%(+10.6)#2,776 |
| 87. | Cedar Ridge | 24.5% | 12.7%(+11.7)#87 | 13.9%(+10.5)#2,807 |
| 88. | Smith Corner | 24.4% | 12.7%(+11.6)#88 | 13.9%(+10.4)#2,839 |
| 89. | Sierra Madre | 24.3% | 12.7%(+11.6)#89 | 13.9%(+10.4)#2,857 |
| 90. | Penn Valley | 24.3% | 12.7%(+11.6)#90 | 13.9%(+10.4)#2,864 |
| 91. | North Edwards | 24.3% | 12.7%(+11.6)#91 | 13.9%(+10.4)#2,865 |
| 92. | Potrero | 23.8% | 12.7%(+11.1)#92 | 13.9%(+9.87)#3,053 |
| 93. | Shasta | 23.4% | 12.7%(+10.7)#93 | 13.9%(+9.51)#3,223 |
| 94. | Vina | 23.4% | 12.7%(+10.6)#94 | 13.9%(+9.42)#3,276 |
| 95. | Portola | 23.4% | 12.7%(+10.6)#95 | 13.9%(+9.42)#3,277 |
| 96. | Indio Hills | 23.2% | 12.7%(+10.5)#96 | 13.9%(+9.26)#3,341 |
| 97. | Lebec | 23.1% | 12.7%(+10.4)#97 | 13.9%(+9.20)#3,367 |
| 98. | Lucerne | 23.1% | 12.7%(+10.4)#98 | 13.9%(+9.15)#3,394 |
| 99. | Myrtletown | 22.9% | 12.7%(+10.2)#99 | 13.9%(+9.00)#3,478 |
| 100. | Coloma | 22.7% | 12.7%(+9.99)#100 | 13.9%(+8.79)#3,577 |
Common Questions
What are the Top 10 Cities with the Highest Percentage of Population Employed in Health Care & Social Assistance in California?
Top 10 Cities with the Highest Percentage of Population Employed in Health Care & Social Assistance in California are:
#1
100.0%
#2
100.0%
#3
100.0%
#4
100.0%
#5
100.0%
#6
69.0%
#7
59.5%
#8
55.7%
#9
53.3%
#10
50.0%
What city has the Highest Percentage of Population Employed in Health Care & Social Assistance in California?
Onyx has the Highest Percentage of Population Employed in Health Care & Social Assistance in California with 100.0%.
What is the Percentage of Population Employed in Health Care & Social Assistance in the State of California?
Percentage of Population Employed in Health Care & Social Assistance in California is 12.7%.
What is the Percentage of Population Employed in Health Care & Social Assistance in the United States?
Percentage of Population Employed in Health Care & Social Assistance in the United States is 13.9%.