Cities with the Highest Percentage of Households With One or more Vehicles in California
RELATED REPORTS & OPTIONS
Households with 1 or more Cars
California
Compare Cities
Map of Cities with the Highest Percentage of Households With One or more Vehicles in California
0.0%
100.0%
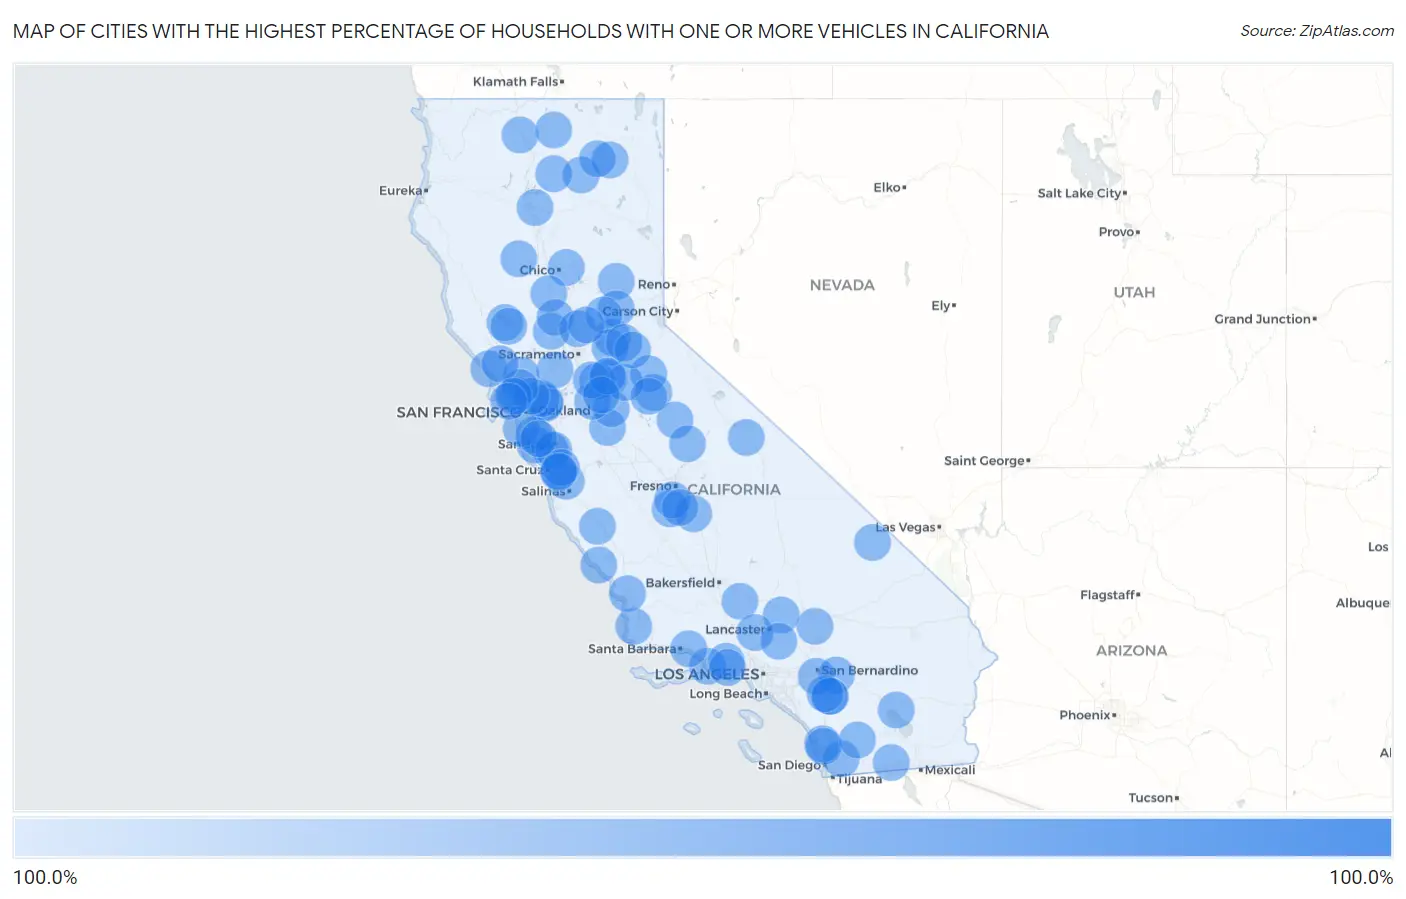
Cities with the Highest Percentage of Households With One or more Vehicles in California
| City | Housholds With 1+ Cars | vs State | vs National | |
| 1. | Camp Pendleton Mainside | 100.0% | 93.0% (+7.00)#1 | 91.7% (+8.30)#3 |
| 2. | Highgrove | 100.0% | 93.0% (+7.00)#2 | 91.7% (+8.30)#5 |
| 3. | Saranap | 100.0% | 93.0% (+7.00)#3 | 91.7% (+8.30)#8 |
| 4. | Monte Sereno | 100.0% | 93.0% (+7.00)#4 | 91.7% (+8.30)#20 |
| 5. | Baywood Park | 100.0% | 93.0% (+7.00)#5 | 91.7% (+8.30)#74 |
| 6. | Bakersfield Country Club | 100.0% | 93.0% (+7.00)#6 | 91.7% (+8.30)#76 |
| 7. | La Honda | 100.0% | 93.0% (+7.00)#7 | 91.7% (+8.30)#97 |
| 8. | Elkhorn | 100.0% | 93.0% (+7.00)#8 | 91.7% (+8.30)#105 |
| 9. | Camanche North Shore | 100.0% | 93.0% (+7.00)#9 | 91.7% (+8.30)#128 |
| 10. | Dunnigan | 100.0% | 93.0% (+7.00)#10 | 91.7% (+8.30)#135 |
| 11. | Mi Wuk Village | 100.0% | 93.0% (+7.00)#11 | 91.7% (+8.30)#142 |
| 12. | Acalanes Ridge | 100.0% | 93.0% (+7.00)#12 | 91.7% (+8.30)#150 |
| 13. | Alhambra Valley | 100.0% | 93.0% (+7.00)#13 | 91.7% (+8.30)#157 |
| 14. | Soda Bay | 100.0% | 93.0% (+7.00)#14 | 91.7% (+8.30)#184 |
| 15. | Butte Creek Canyon | 100.0% | 93.0% (+7.00)#15 | 91.7% (+8.30)#197 |
| 16. | Fall River Mills | 100.0% | 93.0% (+7.00)#16 | 91.7% (+8.30)#199 |
| 17. | West Goshen | 100.0% | 93.0% (+7.00)#17 | 91.7% (+8.30)#228 |
| 18. | El Centro Naval Air Facility | 100.0% | 93.0% (+7.00)#18 | 91.7% (+8.30)#235 |
| 19. | Dorrington | 100.0% | 93.0% (+7.00)#19 | 91.7% (+8.30)#256 |
| 20. | El Portal | 100.0% | 93.0% (+7.00)#20 | 91.7% (+8.30)#261 |
| 21. | Mesa | 100.0% | 93.0% (+7.00)#21 | 91.7% (+8.30)#304 |
| 22. | Oak Glen | 100.0% | 93.0% (+7.00)#22 | 91.7% (+8.30)#307 |
| 23. | Princeton | 100.0% | 93.0% (+7.00)#23 | 91.7% (+8.30)#315 |
| 24. | Grimes | 100.0% | 93.0% (+7.00)#24 | 91.7% (+8.30)#317 |
| 25. | Bass Lake | 100.0% | 93.0% (+7.00)#25 | 91.7% (+8.30)#340 |
| 26. | San Simeon | 100.0% | 93.0% (+7.00)#26 | 91.7% (+8.30)#347 |
| 27. | Coloma | 100.0% | 93.0% (+7.00)#27 | 91.7% (+8.30)#370 |
| 28. | Cowan | 100.0% | 93.0% (+7.00)#28 | 91.7% (+8.30)#383 |
| 29. | Mountain Meadows | 100.0% | 93.0% (+7.00)#29 | 91.7% (+8.30)#396 |
| 30. | Valley Home | 100.0% | 93.0% (+7.00)#30 | 91.7% (+8.30)#404 |
| 31. | Trowbridge | 100.0% | 93.0% (+7.00)#31 | 91.7% (+8.30)#468 |
| 32. | Big Bend | 100.0% | 93.0% (+7.00)#32 | 91.7% (+8.30)#493 |
| 33. | Ocotillo | 100.0% | 93.0% (+7.00)#33 | 91.7% (+8.30)#533 |
| 34. | Elmira | 100.0% | 93.0% (+7.00)#34 | 91.7% (+8.30)#541 |
| 35. | Gazelle | 100.0% | 93.0% (+7.00)#35 | 91.7% (+8.30)#566 |
| 36. | Downieville | 100.0% | 93.0% (+7.00)#36 | 91.7% (+8.30)#593 |
| 37. | Dutch Flat | 100.0% | 93.0% (+7.00)#37 | 91.7% (+8.30)#596 |
| 38. | Sereno Del Mar | 100.0% | 93.0% (+7.00)#38 | 91.7% (+8.30)#607 |
| 39. | Adin | 100.0% | 93.0% (+7.00)#39 | 91.7% (+8.30)#608 |
| 40. | Tennant | 100.0% | 93.0% (+7.00)#40 | 91.7% (+8.30)#629 |
| 41. | Paskenta | 100.0% | 93.0% (+7.00)#41 | 91.7% (+8.30)#665 |
| 42. | Lookout | 100.0% | 93.0% (+7.00)#42 | 91.7% (+8.30)#711 |
| 43. | Shoshone | 100.0% | 93.0% (+7.00)#43 | 91.7% (+8.30)#736 |
| 44. | Alta Sierra | 100.0% | 93.0% (+7.00)#44 | 91.7% (+8.30)#763 |
| 45. | Pinon Hills | 100.0% | 93.0% (+7.00)#45 | 91.7% (+8.30)#766 |
| 46. | California Polytechnic State University | 100.0% | 93.0% (+7.00)#46 | 91.7% (+8.30)#768 |
| 47. | Silver Lakes | 100.0% | 93.0% (+7.00)#47 | 91.7% (+8.30)#797 |
| 48. | Clearlake Riviera | 100.0% | 93.0% (+7.00)#48 | 91.7% (+8.30)#828 |
| 49. | Emerald Lake Hills | 100.0% | 93.0% (+7.00)#49 | 91.7% (+8.30)#830 |
| 50. | Shingle Springs | 100.0% | 93.0% (+7.00)#50 | 91.7% (+8.30)#870 |
| 51. | Vandenberg Afb | 100.0% | 93.0% (+7.00)#51 | 91.7% (+8.30)#872 |
| 52. | Cambrian Park | 100.0% | 93.0% (+7.00)#52 | 91.7% (+8.30)#886 |
| 53. | Palo Cedro | 100.0% | 93.0% (+7.00)#53 | 91.7% (+8.30)#896 |
| 54. | Crest | 100.0% | 93.0% (+7.00)#54 | 91.7% (+8.30)#914 |
| 55. | El Verano | 100.0% | 93.0% (+7.00)#55 | 91.7% (+8.30)#934 |
| 56. | Rancho Santa Fe | 100.0% | 93.0% (+7.00)#56 | 91.7% (+8.30)#936 |
| 57. | Green Acres | 100.0% | 93.0% (+7.00)#57 | 91.7% (+8.30)#938 |
| 58. | Fairbanks Ranch | 100.0% | 93.0% (+7.00)#58 | 91.7% (+8.30)#939 |
| 59. | San Andreas | 100.0% | 93.0% (+7.00)#59 | 91.7% (+8.30)#947 |
| 60. | Winchester | 100.0% | 93.0% (+7.00)#60 | 91.7% (+8.30)#949 |
| 61. | Dogtown | 100.0% | 93.0% (+7.00)#61 | 91.7% (+8.30)#950 |
| 62. | Sleepy Hollow | 100.0% | 93.0% (+7.00)#62 | 91.7% (+8.30)#958 |
| 63. | Riverdale | 100.0% | 93.0% (+7.00)#63 | 91.7% (+8.30)#960 |
| 64. | Pepperdine University | 100.0% | 93.0% (+7.00)#64 | 91.7% (+8.30)#963 |
| 65. | Romoland | 100.0% | 93.0% (+7.00)#65 | 91.7% (+8.30)#966 |
| 66. | Channel Islands Beach | 100.0% | 93.0% (+7.00)#66 | 91.7% (+8.30)#971 |
| 67. | Edwards Afb | 100.0% | 93.0% (+7.00)#67 | 91.7% (+8.30)#973 |
| 68. | Montara | 100.0% | 93.0% (+7.00)#68 | 91.7% (+8.30)#978 |
| 69. | North Shore | 100.0% | 93.0% (+7.00)#69 | 91.7% (+8.30)#982 |
| 70. | Bayview Cdp Contra Costa County | 100.0% | 93.0% (+7.00)#70 | 91.7% (+8.30)#992 |
| 71. | Kennedy | 100.0% | 93.0% (+7.00)#71 | 91.7% (+8.30)#994 |
| 72. | Santa Rosa Valley | 100.0% | 93.0% (+7.00)#72 | 91.7% (+8.30)#995 |
| 73. | Stallion Springs | 100.0% | 93.0% (+7.00)#73 | 91.7% (+8.30)#1,013 |
| 74. | La Selva Beach | 100.0% | 93.0% (+7.00)#74 | 91.7% (+8.30)#1,025 |
| 75. | Montalvin Manor | 100.0% | 93.0% (+7.00)#75 | 91.7% (+8.30)#1,042 |
| 76. | Corralitos | 100.0% | 93.0% (+7.00)#76 | 91.7% (+8.30)#1,047 |
| 77. | Meyers | 100.0% | 93.0% (+7.00)#77 | 91.7% (+8.30)#1,055 |
| 78. | Collierville | 100.0% | 93.0% (+7.00)#78 | 91.7% (+8.30)#1,063 |
| 79. | Pine Canyon | 100.0% | 93.0% (+7.00)#79 | 91.7% (+8.30)#1,069 |
| 80. | Camino | 100.0% | 93.0% (+7.00)#80 | 91.7% (+8.30)#1,091 |
| 81. | Soulsbyville | 100.0% | 93.0% (+7.00)#81 | 91.7% (+8.30)#1,098 |
| 82. | Caruthers | 100.0% | 93.0% (+7.00)#82 | 91.7% (+8.30)#1,105 |
| 83. | Camanche Village | 100.0% | 93.0% (+7.00)#83 | 91.7% (+8.30)#1,106 |
| 84. | Linden | 100.0% | 93.0% (+7.00)#84 | 91.7% (+8.30)#1,125 |
| 85. | Elizabeth Lake | 100.0% | 93.0% (+7.00)#85 | 91.7% (+8.30)#1,147 |
| 86. | Aptos Hills Larkin Valley | 100.0% | 93.0% (+7.00)#86 | 91.7% (+8.30)#1,152 |
| 87. | Toro Canyon | 100.0% | 93.0% (+7.00)#87 | 91.7% (+8.30)#1,166 |
| 88. | Black Point Green Point | 100.0% | 93.0% (+7.00)#88 | 91.7% (+8.30)#1,170 |
| 89. | Graton | 100.0% | 93.0% (+7.00)#89 | 91.7% (+8.30)#1,172 |
| 90. | Lake Sherwood | 100.0% | 93.0% (+7.00)#90 | 91.7% (+8.30)#1,195 |
| 91. | Green Valley Cdp Solano County | 100.0% | 93.0% (+7.00)#91 | 91.7% (+8.30)#1,207 |
| 92. | Los Ranchos | 100.0% | 93.0% (+7.00)#92 | 91.7% (+8.30)#1,214 |
| 93. | Littlerock | 100.0% | 93.0% (+7.00)#93 | 91.7% (+8.30)#1,242 |
| 94. | Ladera | 100.0% | 93.0% (+7.00)#94 | 91.7% (+8.30)#1,290 |
| 95. | Sheridan | 100.0% | 93.0% (+7.00)#95 | 91.7% (+8.30)#1,305 |
| 96. | Woodacre | 100.0% | 93.0% (+7.00)#96 | 91.7% (+8.30)#1,315 |
| 97. | Julian | 100.0% | 93.0% (+7.00)#97 | 91.7% (+8.30)#1,324 |
| 98. | Grizzly Flats | 100.0% | 93.0% (+7.00)#98 | 91.7% (+8.30)#1,327 |
| 99. | Laton | 100.0% | 93.0% (+7.00)#99 | 91.7% (+8.30)#1,360 |
| 100. | Bolinas | 100.0% | 93.0% (+7.00)#100 | 91.7% (+8.30)#1,371 |
Common Questions
What are the Top 10 Cities with the Highest Percentage of Households With One or more Vehicles in California?
Top 10 Cities with the Highest Percentage of Households With One or more Vehicles in California are:
#1
100.0%
#2
100.0%
#3
100.0%
#4
100.0%
#5
100.0%
#6
100.0%
#7
100.0%
#8
100.0%
#9
100.0%
#10
100.0%
What city has the Highest Percentage of Households With One or more Vehicles in California?
Highgrove has the Highest Percentage of Households With One or more Vehicles in California with 100.0%.
What is the Percentage of Households With One or more Vehicles in the State of California?
Percentage of Households With One or more Vehicles in California is 93.0%.
What is the Percentage of Households With One or more Vehicles in the United States?
Percentage of Households With One or more Vehicles in the United States is 91.7%.