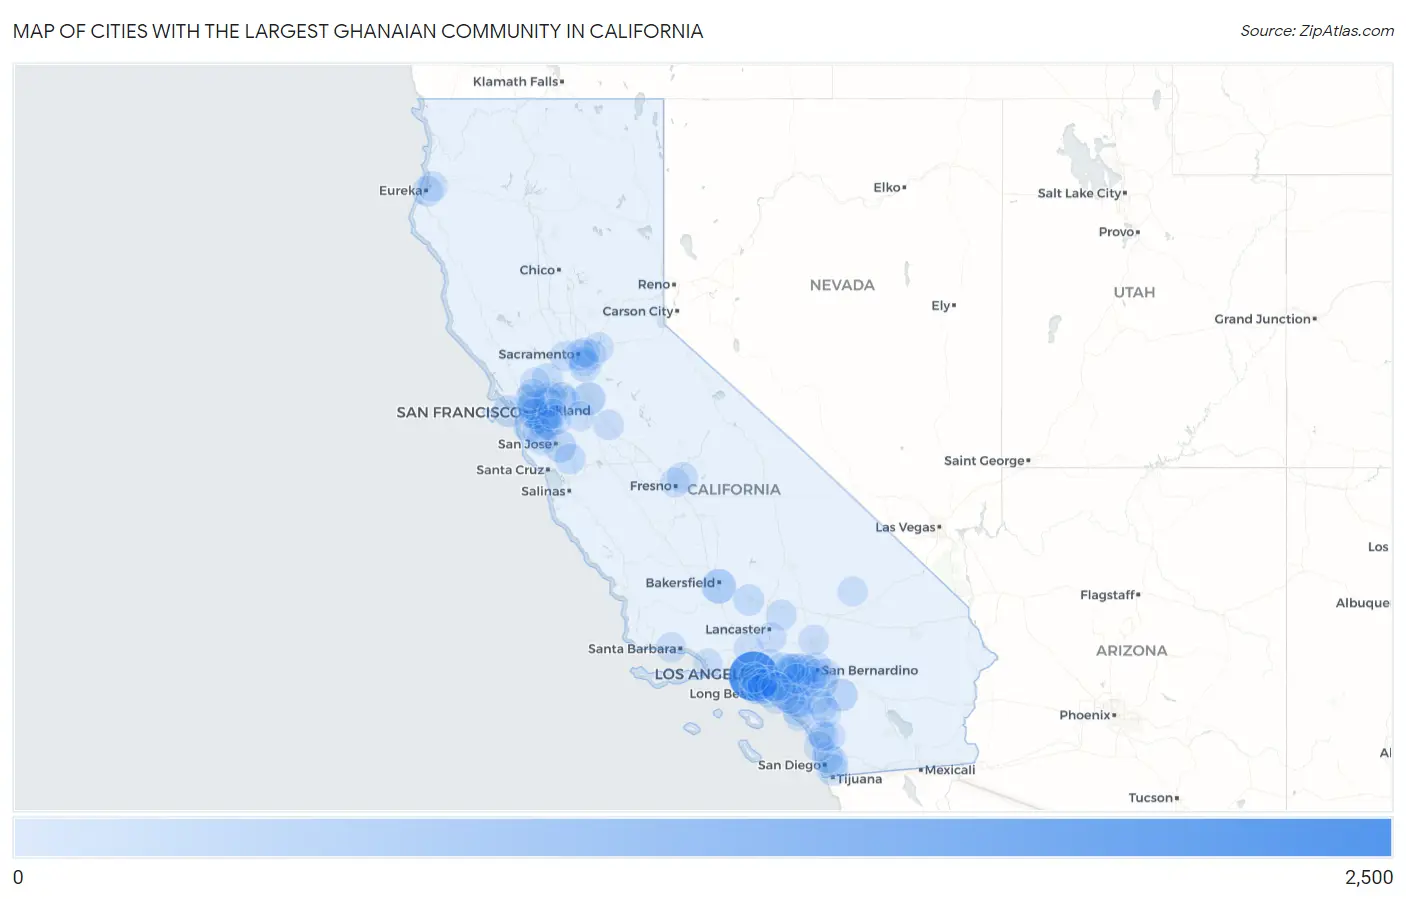
Cities with the Largest Ghanaian Community in California
RELATED REPORTS & OPTIONS
Ghanaian
California
Compare Cities
Map of Cities with the Largest Ghanaian Community in California
0
2,500
Cities with the Largest Ghanaian Community in California
| City | Ghanaian | vs State | vs National | |
| 1. | Los Angeles | 2,203 | 9,384(23.48%)#1 | 185,371(1.19%)#6 |
| 2. | Bakersfield | 488 | 9,384(5.20%)#2 | 185,371(0.26%)#48 |
| 3. | Stockton | 342 | 9,384(3.64%)#3 | 185,371(0.18%)#67 |
| 4. | Valle Vista | 272 | 9,384(2.90%)#4 | 185,371(0.15%)#94 |
| 5. | Ashland | 260 | 9,384(2.77%)#5 | 185,371(0.14%)#98 |
| 6. | San Jose | 252 | 9,384(2.69%)#6 | 185,371(0.14%)#101 |
| 7. | Corona | 201 | 9,384(2.14%)#7 | 185,371(0.11%)#142 |
| 8. | Concord | 191 | 9,384(2.04%)#8 | 185,371(0.10%)#151 |
| 9. | Hayward | 188 | 9,384(2.00%)#9 | 185,371(0.10%)#153 |
| 10. | Rancho Cucamonga | 187 | 9,384(1.99%)#10 | 185,371(0.10%)#155 |
| 11. | San Francisco | 173 | 9,384(1.84%)#11 | 185,371(0.09%)#169 |
| 12. | Chula Vista | 170 | 9,384(1.81%)#12 | 185,371(0.09%)#173 |
| 13. | Elk Grove | 169 | 9,384(1.80%)#13 | 185,371(0.09%)#174 |
| 14. | Ontario | 140 | 9,384(1.49%)#14 | 185,371(0.08%)#214 |
| 15. | San Diego | 133 | 9,384(1.42%)#15 | 185,371(0.07%)#228 |
| 16. | Eastvale | 132 | 9,384(1.41%)#16 | 185,371(0.07%)#233 |
| 17. | Gardena | 130 | 9,384(1.39%)#17 | 185,371(0.07%)#240 |
| 18. | Sacramento | 125 | 9,384(1.33%)#18 | 185,371(0.07%)#253 |
| 19. | Inglewood | 122 | 9,384(1.30%)#19 | 185,371(0.07%)#259 |
| 20. | Lake Elsinore | 117 | 9,384(1.25%)#20 | 185,371(0.06%)#268 |
| 21. | Oakland | 111 | 9,384(1.18%)#21 | 185,371(0.06%)#279 |
| 22. | Castro Valley | 111 | 9,384(1.18%)#22 | 185,371(0.06%)#280 |
| 23. | Tehachapi | 109 | 9,384(1.16%)#23 | 185,371(0.06%)#284 |
| 24. | Morgan Hill | 106 | 9,384(1.13%)#24 | 185,371(0.06%)#297 |
| 25. | Fairfield | 104 | 9,384(1.11%)#25 | 185,371(0.06%)#303 |
| 26. | Brentwood | 103 | 9,384(1.10%)#26 | 185,371(0.06%)#308 |
| 27. | Burlingame | 100 | 9,384(1.07%)#27 | 185,371(0.05%)#312 |
| 28. | Moreno Valley | 90 | 9,384(0.96%)#28 | 185,371(0.05%)#338 |
| 29. | La Mesa | 86 | 9,384(0.92%)#29 | 185,371(0.05%)#354 |
| 30. | Edwards Afb | 86 | 9,384(0.92%)#30 | 185,371(0.05%)#359 |
| 31. | Clovis | 83 | 9,384(0.88%)#31 | 185,371(0.04%)#366 |
| 32. | Lake Forest | 75 | 9,384(0.80%)#32 | 185,371(0.04%)#396 |
| 33. | Shell Ridge | 72 | 9,384(0.77%)#33 | 185,371(0.04%)#408 |
| 34. | San Bernardino | 71 | 9,384(0.76%)#34 | 185,371(0.04%)#409 |
| 35. | Eureka | 71 | 9,384(0.76%)#35 | 185,371(0.04%)#413 |
| 36. | Upland | 68 | 9,384(0.72%)#36 | 185,371(0.04%)#432 |
| 37. | Antioch | 66 | 9,384(0.70%)#37 | 185,371(0.04%)#441 |
| 38. | Anaheim | 64 | 9,384(0.68%)#38 | 185,371(0.03%)#450 |
| 39. | Emeryville | 63 | 9,384(0.67%)#39 | 185,371(0.03%)#461 |
| 40. | Redlands | 61 | 9,384(0.65%)#40 | 185,371(0.03%)#473 |
| 41. | Alameda | 59 | 9,384(0.63%)#41 | 185,371(0.03%)#485 |
| 42. | Hawthorne | 57 | 9,384(0.61%)#42 | 185,371(0.03%)#496 |
| 43. | Escondido | 56 | 9,384(0.60%)#43 | 185,371(0.03%)#503 |
| 44. | Camp Pendleton Mainside | 51 | 9,384(0.54%)#44 | 185,371(0.03%)#541 |
| 45. | Huntington Beach | 47 | 9,384(0.50%)#45 | 185,371(0.03%)#556 |
| 46. | Victorville | 47 | 9,384(0.50%)#46 | 185,371(0.03%)#557 |
| 47. | Torrance | 45 | 9,384(0.48%)#47 | 185,371(0.02%)#573 |
| 48. | Palmdale | 44 | 9,384(0.47%)#48 | 185,371(0.02%)#578 |
| 49. | Downey | 42 | 9,384(0.45%)#49 | 185,371(0.02%)#596 |
| 50. | Paramount | 42 | 9,384(0.45%)#50 | 185,371(0.02%)#602 |
| 51. | Ceres | 41 | 9,384(0.44%)#51 | 185,371(0.02%)#607 |
| 52. | Fontana | 38 | 9,384(0.40%)#52 | 185,371(0.02%)#630 |
| 53. | Redwood City | 38 | 9,384(0.40%)#53 | 185,371(0.02%)#631 |
| 54. | Rancho Santa Margarita | 36 | 9,384(0.38%)#54 | 185,371(0.02%)#647 |
| 55. | Vista | 34 | 9,384(0.36%)#55 | 185,371(0.02%)#660 |
| 56. | Davis | 34 | 9,384(0.36%)#56 | 185,371(0.02%)#662 |
| 57. | Arcata | 34 | 9,384(0.36%)#57 | 185,371(0.02%)#664 |
| 58. | Long Beach | 28 | 9,384(0.30%)#58 | 185,371(0.02%)#714 |
| 59. | South Gate | 28 | 9,384(0.30%)#59 | 185,371(0.02%)#716 |
| 60. | Rancho Cordova | 27 | 9,384(0.29%)#60 | 185,371(0.01%)#724 |
| 61. | Riverside | 25 | 9,384(0.27%)#61 | 185,371(0.01%)#749 |
| 62. | Berkeley | 25 | 9,384(0.27%)#62 | 185,371(0.01%)#751 |
| 63. | Richmond | 25 | 9,384(0.27%)#63 | 185,371(0.01%)#752 |
| 64. | Folsom | 24 | 9,384(0.26%)#64 | 185,371(0.01%)#772 |
| 65. | Goleta | 24 | 9,384(0.26%)#65 | 185,371(0.01%)#779 |
| 66. | Santa Clarita | 23 | 9,384(0.25%)#66 | 185,371(0.01%)#785 |
| 67. | Pleasanton | 23 | 9,384(0.25%)#67 | 185,371(0.01%)#788 |
| 68. | San Clemente | 22 | 9,384(0.23%)#68 | 185,371(0.01%)#802 |
| 69. | Claremont | 22 | 9,384(0.23%)#69 | 185,371(0.01%)#806 |
| 70. | Altadena | 21 | 9,384(0.22%)#70 | 185,371(0.01%)#817 |
| 71. | Fullerton | 19 | 9,384(0.20%)#71 | 185,371(0.01%)#846 |
| 72. | Pomona | 18 | 9,384(0.19%)#72 | 185,371(0.01%)#861 |
| 73. | Florin | 17 | 9,384(0.18%)#73 | 185,371(0.01%)#884 |
| 74. | Palo Alto | 16 | 9,384(0.17%)#74 | 185,371(0.01%)#903 |
| 75. | Colton | 16 | 9,384(0.17%)#75 | 185,371(0.01%)#907 |
| 76. | Fort Irwin | 16 | 9,384(0.17%)#76 | 185,371(0.01%)#920 |
| 77. | Azusa | 15 | 9,384(0.16%)#77 | 185,371(0.01%)#930 |
| 78. | West Carson | 15 | 9,384(0.16%)#78 | 185,371(0.01%)#935 |
| 79. | San Juan Capistrano | 13 | 9,384(0.14%)#79 | 185,371(0.01%)#968 |
| 80. | La Verne | 13 | 9,384(0.14%)#80 | 185,371(0.01%)#971 |
| 81. | Arden Arcade | 12 | 9,384(0.13%)#81 | 185,371(0.01%)#990 |
| 82. | Tracy | 12 | 9,384(0.13%)#82 | 185,371(0.01%)#991 |
| 83. | American Canyon | 12 | 9,384(0.13%)#83 | 185,371(0.01%)#1,001 |
| 84. | Solana Beach | 12 | 9,384(0.13%)#84 | 185,371(0.01%)#1,004 |
| 85. | Santa Ana | 10 | 9,384(0.11%)#85 | 185,371(0.01%)#1,039 |
| 86. | Murrieta | 10 | 9,384(0.11%)#86 | 185,371(0.01%)#1,042 |
| 87. | Union City | 10 | 9,384(0.11%)#87 | 185,371(0.01%)#1,047 |
| 88. | West Rancho Dominguez | 10 | 9,384(0.11%)#88 | 185,371(0.01%)#1,058 |
| 89. | Irvine | 9 | 9,384(0.10%)#89 | 185,371(0.00%)#1,075 |
| 90. | Temecula | 9 | 9,384(0.10%)#90 | 185,371(0.00%)#1,077 |
| 91. | Carson | 9 | 9,384(0.10%)#91 | 185,371(0.00%)#1,078 |
| 92. | San Marcos | 9 | 9,384(0.10%)#92 | 185,371(0.00%)#1,079 |
| 93. | San Ramon | 9 | 9,384(0.10%)#93 | 185,371(0.00%)#1,080 |
| 94. | Cerritos | 9 | 9,384(0.10%)#94 | 185,371(0.00%)#1,083 |
| 95. | Fresno | 8 | 9,384(0.09%)#95 | 185,371(0.00%)#1,099 |
| 96. | Culver City | 8 | 9,384(0.09%)#96 | 185,371(0.00%)#1,103 |
| 97. | Hercules | 8 | 9,384(0.09%)#97 | 185,371(0.00%)#1,106 |
| 98. | Oxnard | 7 | 9,384(0.07%)#98 | 185,371(0.00%)#1,123 |
| 99. | Chino | 7 | 9,384(0.07%)#99 | 185,371(0.00%)#1,124 |
| 100. | Buena Park | 7 | 9,384(0.07%)#100 | 185,371(0.00%)#1,125 |
Common Questions
What are the Top 10 Cities with the Largest Ghanaian Community in California?
Top 10 Cities with the Largest Ghanaian Community in California are:
#1
2,203
#2
488
#3
342
#4
272
#5
260
#6
252
#7
201
#8
191
#9
188
#10
187
What city has the Largest Ghanaian Community in California?
Los Angeles has the Largest Ghanaian Community in California with 2,203.
What is the Total Ghanaian Population in the State of California?
Total Ghanaian Population in California is 9,384.
What is the Total Ghanaian Population in the United States?
Total Ghanaian Population in the United States is 185,371.