Lower Lake, CA Map & Demographics
Lower Lake Map
Lower Lake Overview
$15,644
PER CAPITA INCOME
$38,836
AVG FAMILY INCOME
$35,930
AVG HOUSEHOLD INCOME
0.50
INEQUALITY / GINI INDEX
1,326
TOTAL POPULATION
458
MALE POPULATION
868
FEMALE POPULATION
52.76
MALES / 100 FEMALES
189.52
FEMALES / 100 MALES
34.7
MEDIAN AGE
4.0
AVG FAMILY SIZE
2.9
AVG HOUSEHOLD SIZE
499
LABOR FORCE [ PEOPLE ]
55.6%
PERCENT IN LABOR FORCE
2.4%
UNEMPLOYMENT RATE
Lower Lake Zip Codes
Lower Lake Area Codes
Income in Lower Lake
Income Overview in Lower Lake
Per Capita Income in Lower Lake is $15,644, while median incomes of families and households are $38,836 and $35,930 respectively.
| Characteristic | Number | Measure |
| Per Capita Income | 1,326 | $15,644 |
| Median Family Income | 264 | $38,836 |
| Mean Family Income | 264 | $49,331 |
| Median Household Income | 454 | $35,930 |
| Mean Household Income | 454 | $44,456 |
| Income Deficit | 264 | $0 |
| Wage / Income Gap (%) | 1,326 | 0.00% |
| Wage / Income Gap ($) | 1,326 | 100.00¢ per $1 |
| Gini / Inequality Index | 1,326 | 0.50 |
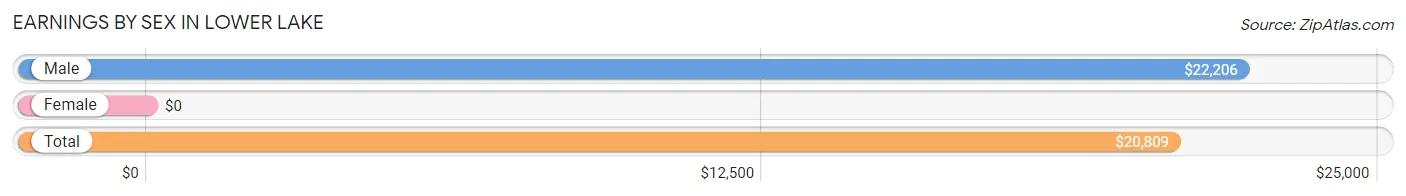
Earnings by Sex in Lower Lake
| Sex | Number | Average Earnings |
| Male | 172 (35.2%) | $22,206 |
| Female | 316 (64.7%) | $0 |
| Total | 488 (100.0%) | $20,809 |
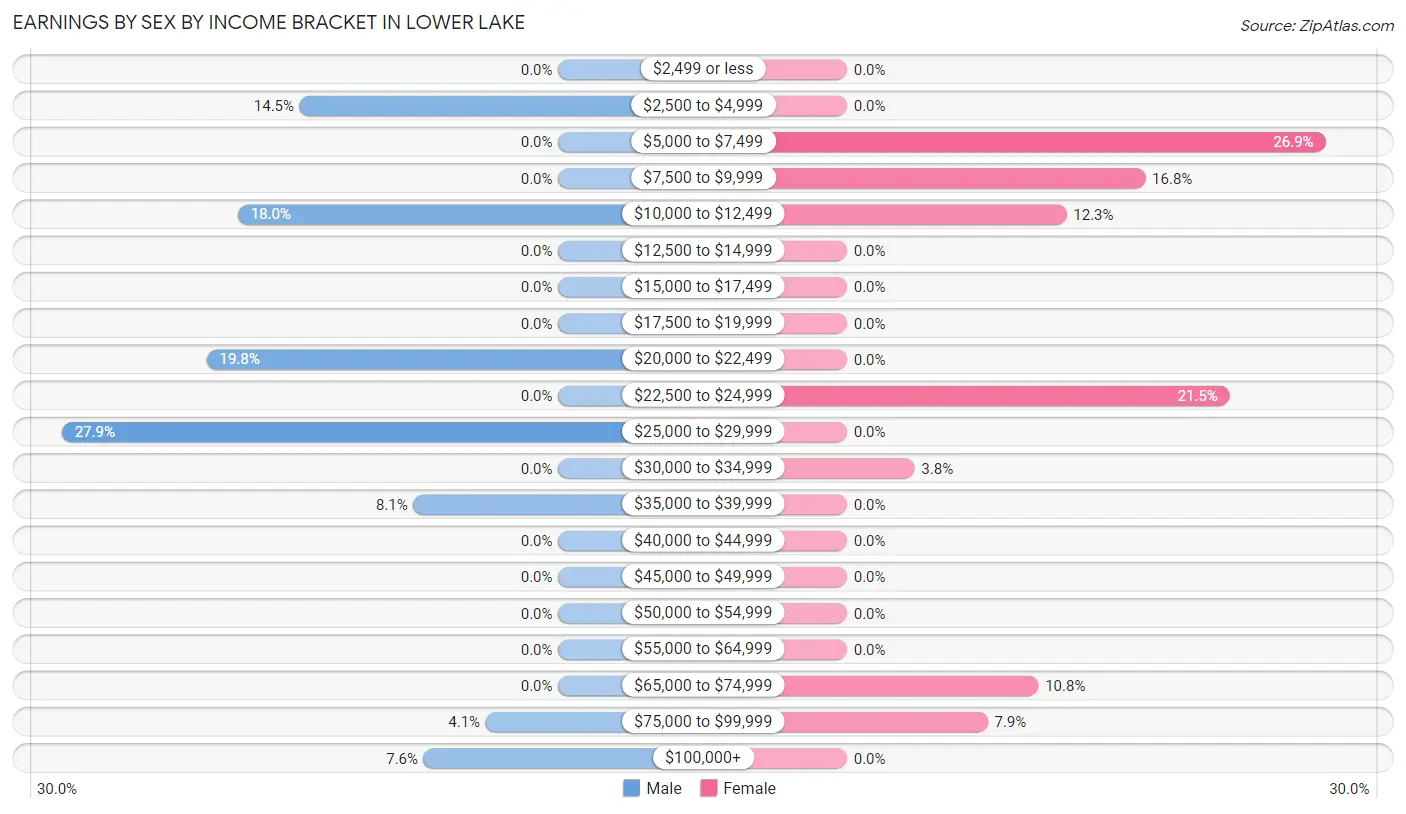
Earnings by Sex by Income Bracket in Lower Lake
The most common earnings brackets in Lower Lake are $25,000 to $29,999 for men (48 | 27.9%) and $5,000 to $7,499 for women (85 | 26.9%).
| Income | Male | Female |
| $2,499 or less | 0 (0.0%) | 0 (0.0%) |
| $2,500 to $4,999 | 25 (14.5%) | 0 (0.0%) |
| $5,000 to $7,499 | 0 (0.0%) | 85 (26.9%) |
| $7,500 to $9,999 | 0 (0.0%) | 53 (16.8%) |
| $10,000 to $12,499 | 31 (18.0%) | 39 (12.3%) |
| $12,500 to $14,999 | 0 (0.0%) | 0 (0.0%) |
| $15,000 to $17,499 | 0 (0.0%) | 0 (0.0%) |
| $17,500 to $19,999 | 0 (0.0%) | 0 (0.0%) |
| $20,000 to $22,499 | 34 (19.8%) | 0 (0.0%) |
| $22,500 to $24,999 | 0 (0.0%) | 68 (21.5%) |
| $25,000 to $29,999 | 48 (27.9%) | 0 (0.0%) |
| $30,000 to $34,999 | 0 (0.0%) | 12 (3.8%) |
| $35,000 to $39,999 | 14 (8.1%) | 0 (0.0%) |
| $40,000 to $44,999 | 0 (0.0%) | 0 (0.0%) |
| $45,000 to $49,999 | 0 (0.0%) | 0 (0.0%) |
| $50,000 to $54,999 | 0 (0.0%) | 0 (0.0%) |
| $55,000 to $64,999 | 0 (0.0%) | 0 (0.0%) |
| $65,000 to $74,999 | 0 (0.0%) | 34 (10.8%) |
| $75,000 to $99,999 | 7 (4.1%) | 25 (7.9%) |
| $100,000+ | 13 (7.6%) | 0 (0.0%) |
| Total | 172 (100.0%) | 316 (100.0%) |
Earnings by Sex by Educational Attainment in Lower Lake
| Educational Attainment | Male Income | Female Income |
| Less than High School | - | - |
| High School Diploma | - | - |
| College or Associate's Degree | - | - |
| Bachelor's Degree | - | - |
| Graduate Degree | - | - |
| Total | $22,206 | $0 |
Family Income in Lower Lake
Family Income Brackets in Lower Lake
According to the Lower Lake family income data, there are 101 families falling into the $35,000 to $49,999 income range, which is the most common income bracket and makes up 38.3% of all families.
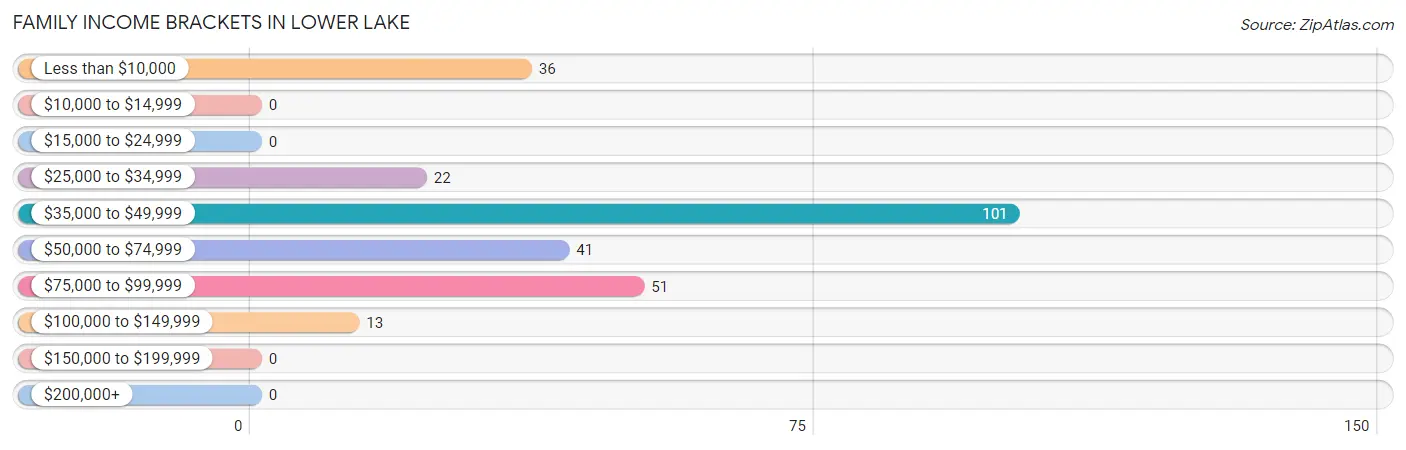
| Income Bracket | # Families | % Families |
| Less than $10,000 | 36 | 13.6% |
| $10,000 to $14,999 | 0 | 0.0% |
| $15,000 to $24,999 | 0 | 0.0% |
| $25,000 to $34,999 | 22 | 8.3% |
| $35,000 to $49,999 | 101 | 38.3% |
| $50,000 to $74,999 | 41 | 15.5% |
| $75,000 to $99,999 | 51 | 19.3% |
| $100,000 to $149,999 | 13 | 4.9% |
| $150,000 to $199,999 | 0 | 0.0% |
| $200,000+ | 0 | 0.0% |
Family Income by Famaliy Size in Lower Lake
2-person families (151 | 57.2%) account for the highest median family income in Lower Lake with $54,125 per family, while 2-person families (151 | 57.2%) have the highest median income of $27,062 per family member.
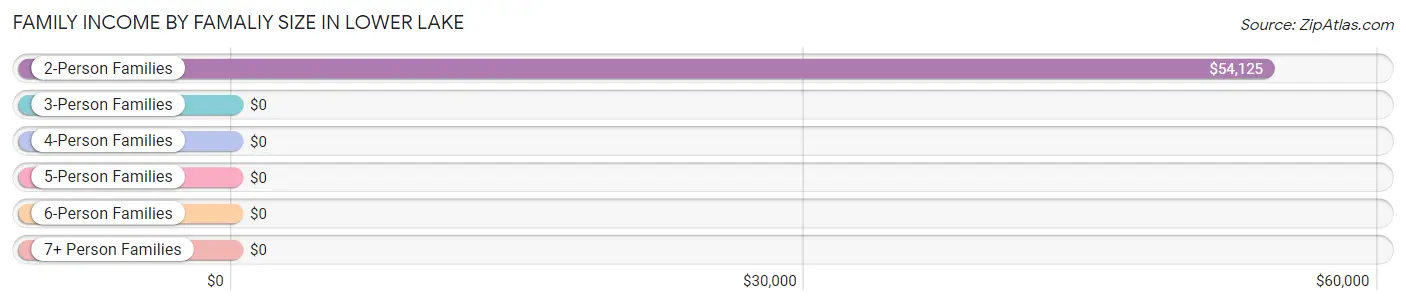
| Income Bracket | # Families | Median Income |
| 2-Person Families | 151 (57.2%) | $54,125 |
| 3-Person Families | 10 (3.8%) | $0 |
| 4-Person Families | 47 (17.8%) | $0 |
| 5-Person Families | 13 (4.9%) | $0 |
| 6-Person Families | 0 (0.0%) | $0 |
| 7+ Person Families | 43 (16.3%) | $0 |
| Total | 264 (100.0%) | $38,836 |
Family Income by Number of Earners in Lower Lake
| Number of Earners | # Families | Median Income |
| No Earners | 95 (36.0%) | $0 |
| 1 Earner | 48 (18.2%) | $0 |
| 2 Earners | 78 (29.5%) | $0 |
| 3+ Earners | 43 (16.3%) | $0 |
| Total | 264 (100.0%) | $38,836 |
Household Income in Lower Lake
Household Income Brackets in Lower Lake
With 109 households falling in the category, the less than $10,000 income range is the most frequent in Lower Lake, accounting for 24.0% of all households.
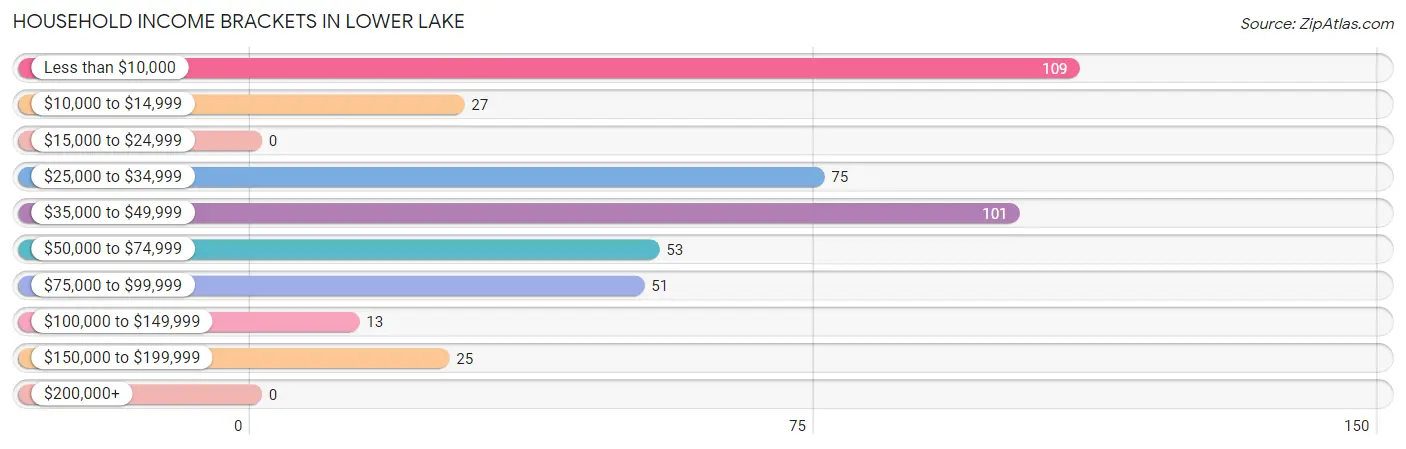
| Income Bracket | # Households | % Households |
| Less than $10,000 | 109 | 24.0% |
| $10,000 to $14,999 | 27 | 5.9% |
| $15,000 to $24,999 | 0 | 0.0% |
| $25,000 to $34,999 | 75 | 16.5% |
| $35,000 to $49,999 | 101 | 22.2% |
| $50,000 to $74,999 | 53 | 11.7% |
| $75,000 to $99,999 | 51 | 11.2% |
| $100,000 to $149,999 | 13 | 2.9% |
| $150,000 to $199,999 | 25 | 5.5% |
| $200,000+ | 0 | 0.0% |
Household Income by Householder Age in Lower Lake
| Income Bracket | # Households | Median Income |
| 15 to 24 Years | 0 (0.0%) | $0 |
| 25 to 44 Years | 127 (28.0%) | $0 |
| 45 to 64 Years | 182 (40.1%) | $0 |
| 65+ Years | 145 (31.9%) | $0 |
| Total | 454 (100.0%) | $35,930 |
Poverty in Lower Lake
Income Below Poverty by Sex and Age in Lower Lake
With 35.9% poverty level for males and 52.1% for females among the residents of Lower Lake, under 5 year old males and under 5 year old females are the most vulnerable to poverty, with 75 males (100.0%) and 11 females (100.0%) in their respective age groups living below the poverty level.
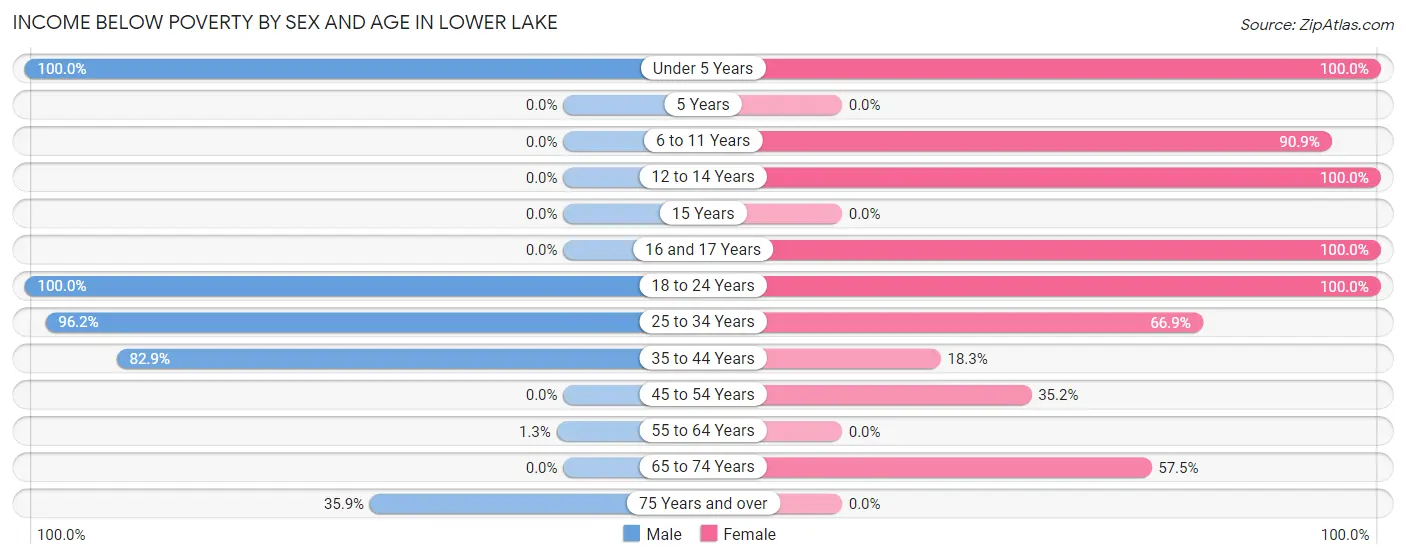
| Age Bracket | Male | Female |
| Under 5 Years | 75 (100.0%) | 11 (100.0%) |
| 5 Years | 0 (0.0%) | 0 (0.0%) |
| 6 to 11 Years | 0 (0.0%) | 80 (90.9%) |
| 12 to 14 Years | 0 (0.0%) | 104 (100.0%) |
| 15 Years | 0 (0.0%) | 0 (0.0%) |
| 16 and 17 Years | 0 (0.0%) | 53 (100.0%) |
| 18 to 24 Years | 1 (100.0%) | 53 (100.0%) |
| 25 to 34 Years | 25 (96.2%) | 81 (66.9%) |
| 35 to 44 Years | 34 (82.9%) | 11 (18.3%) |
| 45 to 54 Years | 0 (0.0%) | 32 (35.2%) |
| 55 to 64 Years | 1 (1.3%) | 0 (0.0%) |
| 65 to 74 Years | 0 (0.0%) | 27 (57.5%) |
| 75 Years and over | 28 (35.9%) | 0 (0.0%) |
| Total | 164 (35.9%) | 452 (52.1%) |
Income Above Poverty by Sex and Age in Lower Lake
According to the poverty statistics in Lower Lake, males aged 5 years and females aged 15 years are the age groups that are most secure financially, with 100.0% of males and 100.0% of females in these age groups living above the poverty line.
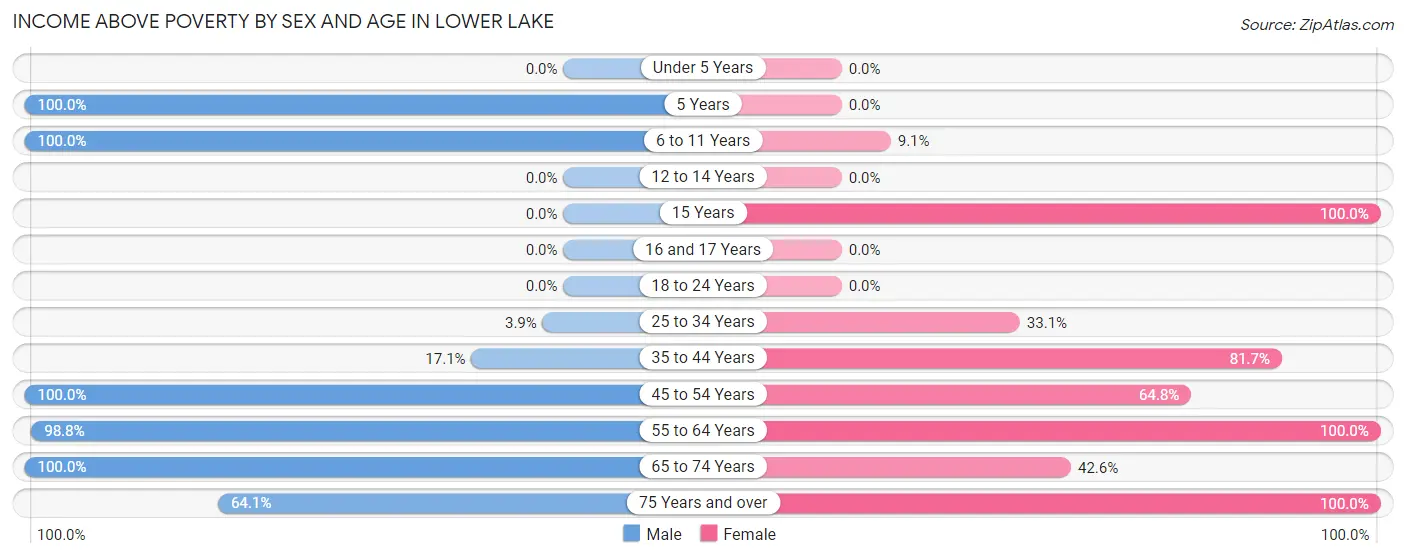
| Age Bracket | Male | Female |
| Under 5 Years | 0 (0.0%) | 0 (0.0%) |
| 5 Years | 19 (100.0%) | 0 (0.0%) |
| 6 to 11 Years | 62 (100.0%) | 8 (9.1%) |
| 12 to 14 Years | 0 (0.0%) | 0 (0.0%) |
| 15 Years | 0 (0.0%) | 70 (100.0%) |
| 16 and 17 Years | 0 (0.0%) | 0 (0.0%) |
| 18 to 24 Years | 0 (0.0%) | 0 (0.0%) |
| 25 to 34 Years | 1 (3.8%) | 40 (33.1%) |
| 35 to 44 Years | 7 (17.1%) | 49 (81.7%) |
| 45 to 54 Years | 47 (100.0%) | 59 (64.8%) |
| 55 to 64 Years | 79 (98.8%) | 108 (100.0%) |
| 65 to 74 Years | 28 (100.0%) | 20 (42.5%) |
| 75 Years and over | 50 (64.1%) | 62 (100.0%) |
| Total | 293 (64.1%) | 416 (47.9%) |
Income Below Poverty Among Married-Couple Families in Lower Lake
The poverty statistics for married-couple families in Lower Lake show that 19.8% or 43 of the total 217 families live below the poverty line. Families with 5 or more children have the highest poverty rate of 100.0%, comprising of 43 families. On the other hand, families with no children have the lowest poverty rate of 0.0%, which includes 0 families.
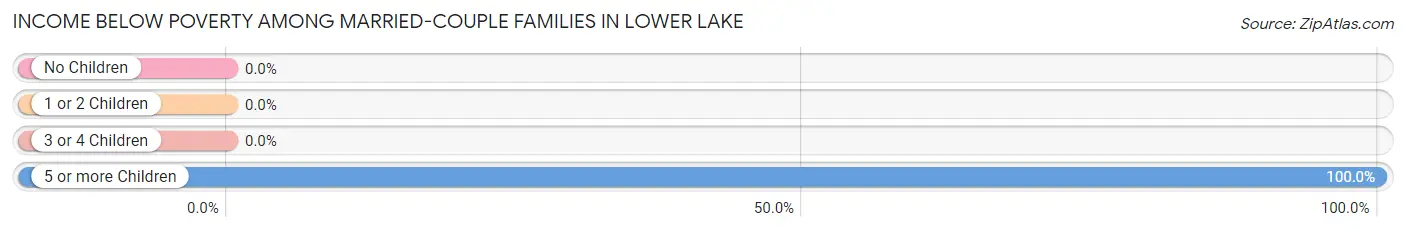
| Children | Above Poverty | Below Poverty |
| No Children | 104 (100.0%) | 0 (0.0%) |
| 1 or 2 Children | 70 (100.0%) | 0 (0.0%) |
| 3 or 4 Children | 0 (0.0%) | 0 (0.0%) |
| 5 or more Children | 0 (0.0%) | 43 (100.0%) |
| Total | 174 (80.2%) | 43 (19.8%) |
Income Below Poverty Among Single-Parent Households in Lower Lake
According to the poverty data in Lower Lake, 100.0% or 25 single-father households and 50.0% or 11 single-mother households are living below the poverty line. Among single-father households, those with 1 or 2 children have the highest poverty rate, with 25 households (100.0%) experiencing poverty. Likewise, among single-mother households, those with 1 or 2 children have the highest poverty rate, with 11 households (100.0%) falling below the poverty line.
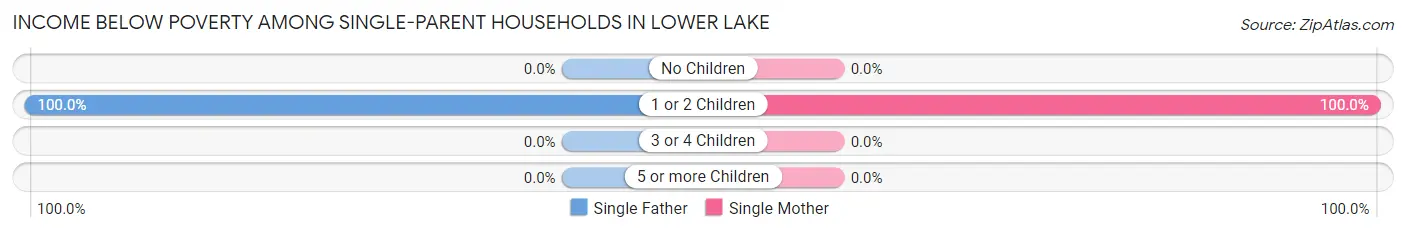
| Children | Single Father | Single Mother |
| No Children | 0 (0.0%) | 0 (0.0%) |
| 1 or 2 Children | 25 (100.0%) | 11 (100.0%) |
| 3 or 4 Children | 0 (0.0%) | 0 (0.0%) |
| 5 or more Children | 0 (0.0%) | 0 (0.0%) |
| Total | 25 (100.0%) | 11 (50.0%) |
Income Below Poverty Among Married-Couple vs Single-Parent Households in Lower Lake
The poverty data for Lower Lake shows that 43 of the married-couple family households (19.8%) and 36 of the single-parent households (76.6%) are living below the poverty level. Within the married-couple family households, those with 5 or more children have the highest poverty rate, with 43 households (100.0%) falling below the poverty line. Among the single-parent households, those with 1 or 2 children have the highest poverty rate, with 36 household (100.0%) living below poverty.
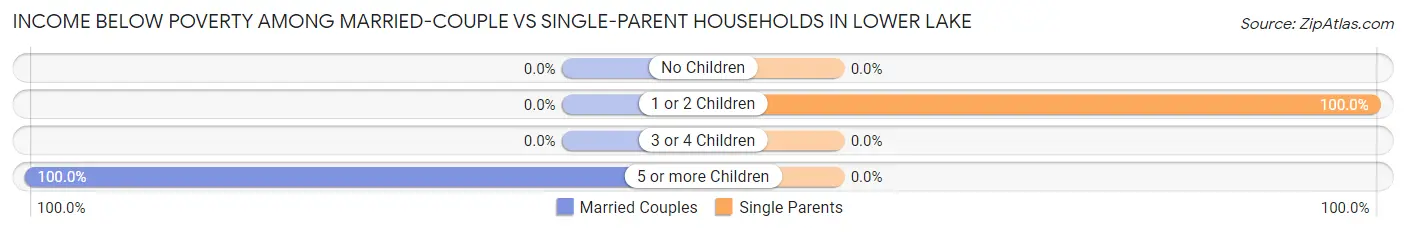
| Children | Married-Couple Families | Single-Parent Households |
| No Children | 0 (0.0%) | 0 (0.0%) |
| 1 or 2 Children | 0 (0.0%) | 36 (100.0%) |
| 3 or 4 Children | 0 (0.0%) | 0 (0.0%) |
| 5 or more Children | 43 (100.0%) | 0 (0.0%) |
| Total | 43 (19.8%) | 36 (76.6%) |
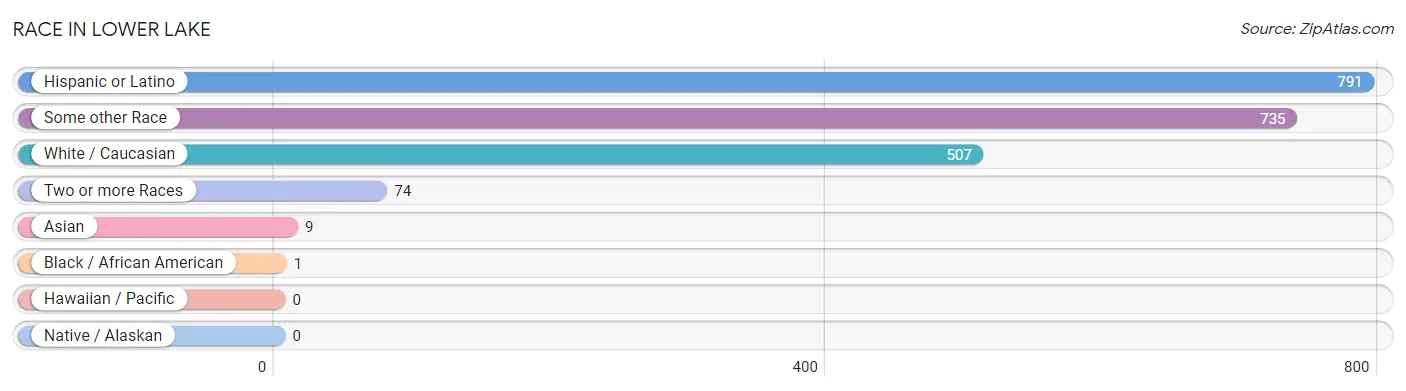
Race in Lower Lake
The most populous races in Lower Lake are Hispanic or Latino (791 | 59.7%), Some other Race (735 | 55.4%), and White / Caucasian (507 | 38.2%).
| Race | # Population | % Population |
| Asian | 9 | 0.7% |
| Black / African American | 1 | 0.1% |
| Hawaiian / Pacific | 0 | 0.0% |
| Hispanic or Latino | 791 | 59.7% |
| Native / Alaskan | 0 | 0.0% |
| White / Caucasian | 507 | 38.2% |
| Two or more Races | 74 | 5.6% |
| Some other Race | 735 | 55.4% |
| Total | 1,326 | 100.0% |
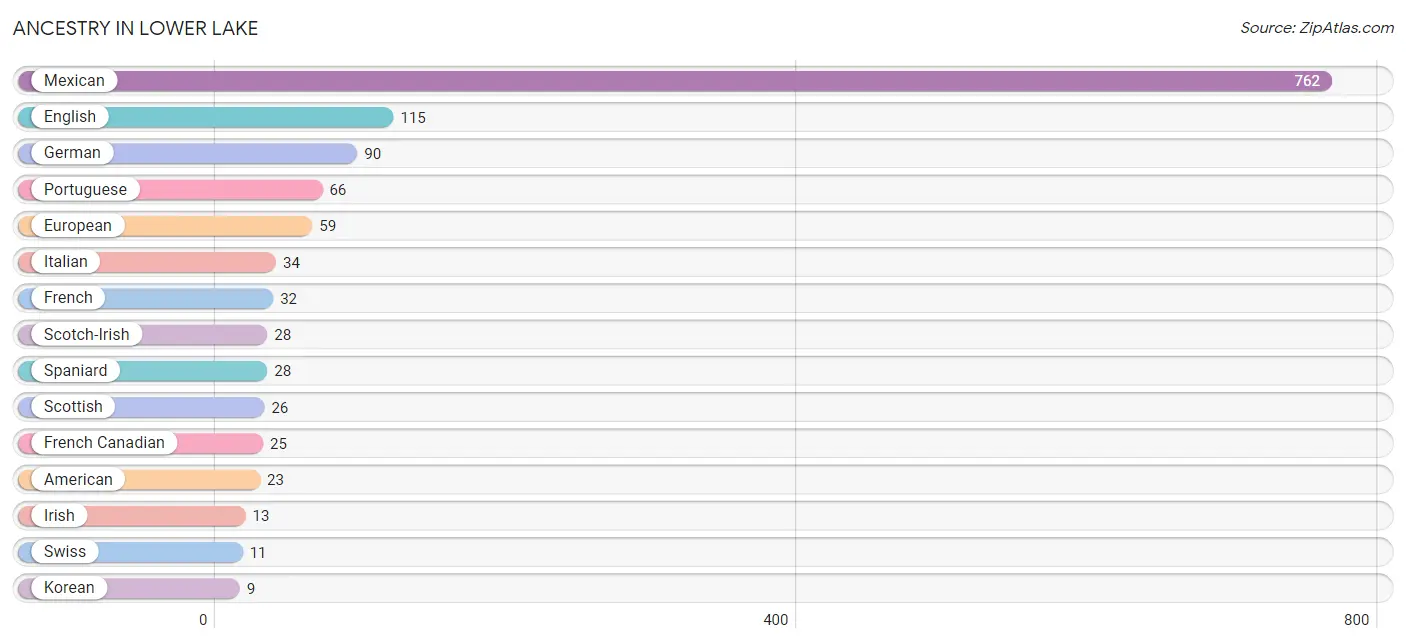
Ancestry in Lower Lake
The most populous ancestries reported in Lower Lake are Mexican (762 | 57.5%), English (115 | 8.7%), German (90 | 6.8%), Portuguese (66 | 5.0%), and European (59 | 4.4%), together accounting for 82.4% of all Lower Lake residents.
| Ancestry | # Population | % Population |
| American | 23 | 1.7% |
| English | 115 | 8.7% |
| European | 59 | 4.4% |
| French | 32 | 2.4% |
| French Canadian | 25 | 1.9% |
| German | 90 | 6.8% |
| Irish | 13 | 1.0% |
| Italian | 34 | 2.6% |
| Korean | 9 | 0.7% |
| Mexican | 762 | 57.5% |
| Portuguese | 66 | 5.0% |
| Scotch-Irish | 28 | 2.1% |
| Scottish | 26 | 2.0% |
| Spaniard | 28 | 2.1% |
| Swiss | 11 | 0.8% | View All 15 Rows |
Immigrants in Lower Lake
The most numerous immigrant groups reported in Lower Lake came from Central America (179 | 13.5%), Latin America (179 | 13.5%), Mexico (179 | 13.5%), Asia (9 | 0.7%), and Philippines (9 | 0.7%), together accounting for 41.9% of all Lower Lake residents.
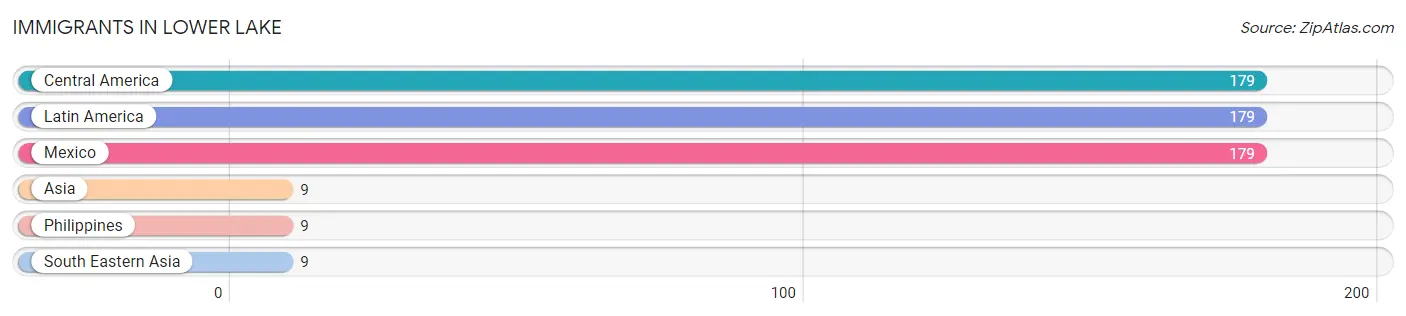
| Immigration Origin | # Population | % Population |
| Asia | 9 | 0.7% |
| Central America | 179 | 13.5% |
| Latin America | 179 | 13.5% |
| Mexico | 179 | 13.5% |
| Philippines | 9 | 0.7% |
| South Eastern Asia | 9 | 0.7% | View All 6 Rows |
Sex and Age in Lower Lake
Sex and Age in Lower Lake
The most populous age groups in Lower Lake are 5 to 9 Years (81 | 17.7%) for men and 15 to 19 Years (176 | 20.3%) for women.
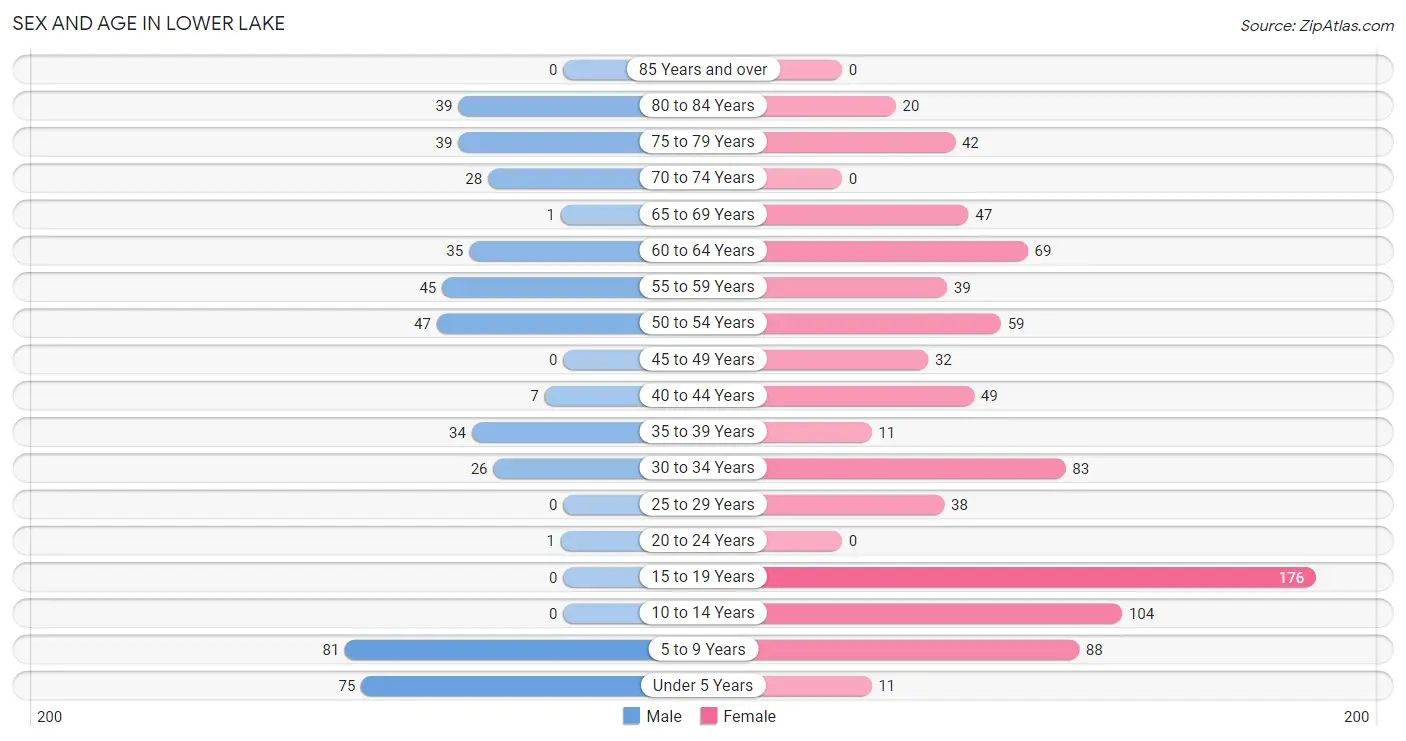
| Age Bracket | Male | Female |
| Under 5 Years | 75 (16.4%) | 11 (1.3%) |
| 5 to 9 Years | 81 (17.7%) | 88 (10.1%) |
| 10 to 14 Years | 0 (0.0%) | 104 (12.0%) |
| 15 to 19 Years | 0 (0.0%) | 176 (20.3%) |
| 20 to 24 Years | 1 (0.2%) | 0 (0.0%) |
| 25 to 29 Years | 0 (0.0%) | 38 (4.4%) |
| 30 to 34 Years | 26 (5.7%) | 83 (9.6%) |
| 35 to 39 Years | 34 (7.4%) | 11 (1.3%) |
| 40 to 44 Years | 7 (1.5%) | 49 (5.7%) |
| 45 to 49 Years | 0 (0.0%) | 32 (3.7%) |
| 50 to 54 Years | 47 (10.3%) | 59 (6.8%) |
| 55 to 59 Years | 45 (9.8%) | 39 (4.5%) |
| 60 to 64 Years | 35 (7.6%) | 69 (8.0%) |
| 65 to 69 Years | 1 (0.2%) | 47 (5.4%) |
| 70 to 74 Years | 28 (6.1%) | 0 (0.0%) |
| 75 to 79 Years | 39 (8.5%) | 42 (4.8%) |
| 80 to 84 Years | 39 (8.5%) | 20 (2.3%) |
| 85 Years and over | 0 (0.0%) | 0 (0.0%) |
| Total | 458 (100.0%) | 868 (100.0%) |
Families and Households in Lower Lake
Median Family Size in Lower Lake
The median family size in Lower Lake is 3.95 persons per family, with married-couple families (217 | 82.2%) accounting for the largest median family size of 4.38 persons per family. On the other hand, single male/father families (25 | 9.5%) represent the smallest median family size with 1.96 persons per family.
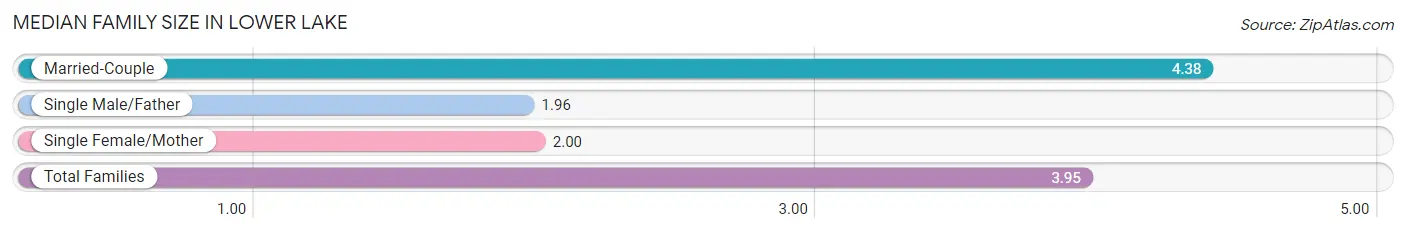
| Family Type | # Families | Family Size |
| Married-Couple | 217 (82.2%) | 4.38 |
| Single Male/Father | 25 (9.5%) | 1.96 |
| Single Female/Mother | 22 (8.3%) | 2.00 |
| Total Families | 264 (100.0%) | 3.95 |
Median Household Size in Lower Lake
The median household size in Lower Lake is 2.91 persons per household, with married-couple households (217 | 47.8%) accounting for the largest median household size of 4.38 persons per household. non-family households (190 | 41.8%) represent the smallest median household size with 1.25 persons per household.
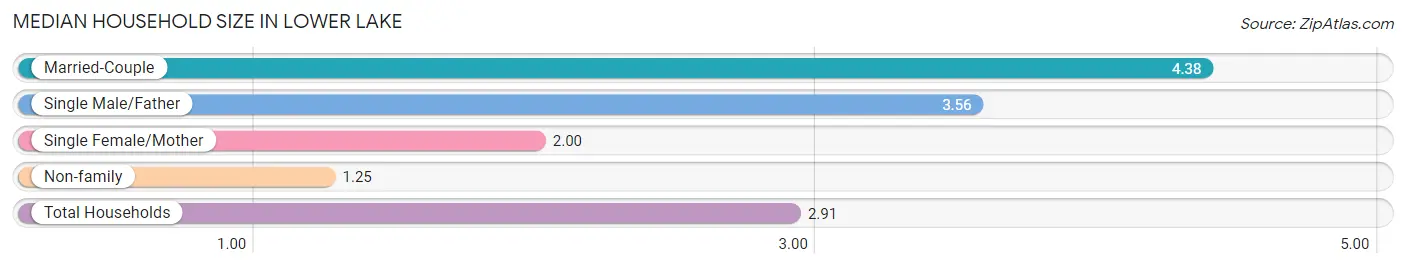
| Household Type | # Households | Household Size |
| Married-Couple | 217 (47.8%) | 4.38 |
| Single Male/Father | 25 (5.5%) | 3.56 |
| Single Female/Mother | 22 (4.9%) | 2.00 |
| Non-family | 190 (41.8%) | 1.25 |
| Total Households | 454 (100.0%) | 2.91 |
Household Size by Marriage Status in Lower Lake
Out of a total of 454 households in Lower Lake, 264 (58.2%) are family households, while 190 (41.8%) are nonfamily households. The most numerous type of family households are 2-person households, comprising 126, and the most common type of nonfamily households are 1-person households, comprising 153.
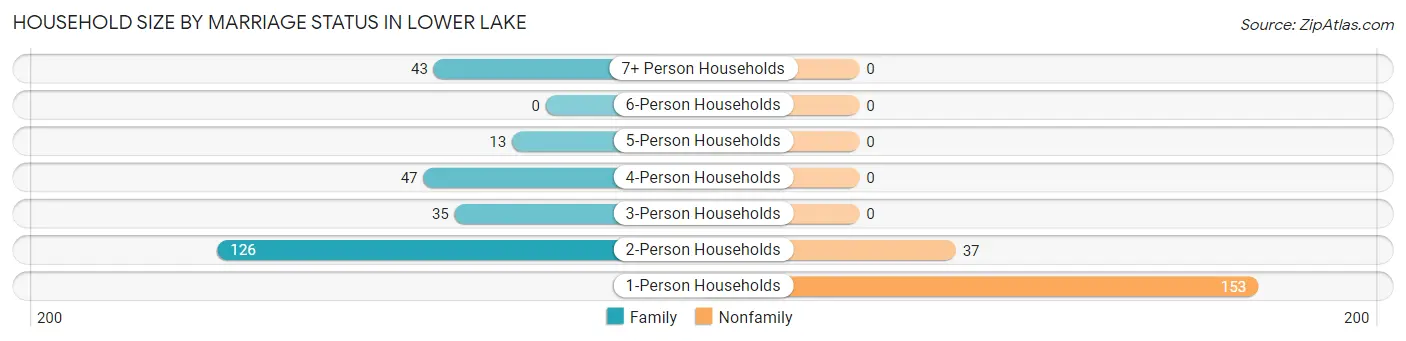
| Household Size | Family Households | Nonfamily Households |
| 1-Person Households | - | 153 (33.7%) |
| 2-Person Households | 126 (27.8%) | 37 (8.2%) |
| 3-Person Households | 35 (7.7%) | 0 (0.0%) |
| 4-Person Households | 47 (10.3%) | 0 (0.0%) |
| 5-Person Households | 13 (2.9%) | 0 (0.0%) |
| 6-Person Households | 0 (0.0%) | 0 (0.0%) |
| 7+ Person Households | 43 (9.5%) | 0 (0.0%) |
| Total | 264 (58.2%) | 190 (41.8%) |
Female Fertility in Lower Lake
Fertility by Age in Lower Lake
Average fertility rate in Lower Lake is 28.0 births per 1,000 women. Women in the age bracket of 35 to 50 years have the highest fertility rate with 120.0 births per 1,000 women. Women in the age bracket of 35 to 50 years acount for 100.0% of all women with births.
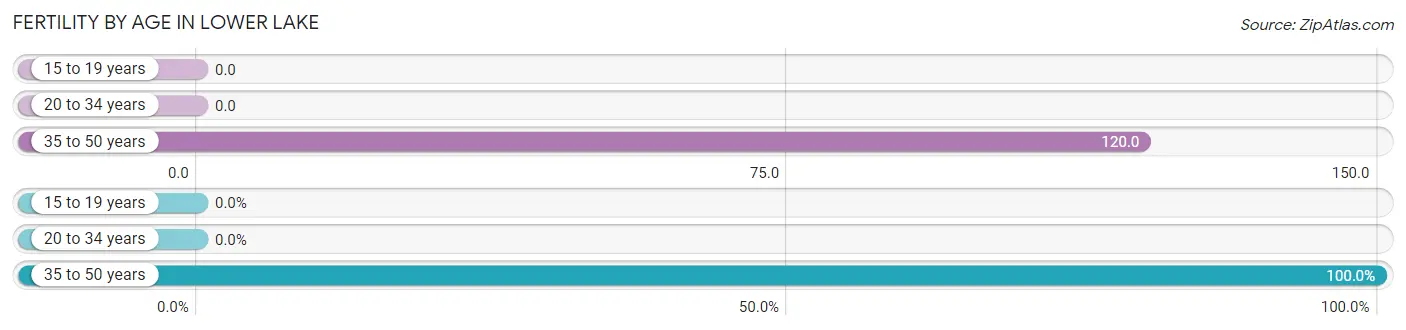
| Age Bracket | Women with Births | Births / 1,000 Women |
| 15 to 19 years | 0 (0.0%) | 0.0 |
| 20 to 34 years | 0 (0.0%) | 0.0 |
| 35 to 50 years | 11 (100.0%) | 120.0 |
| Total | 11 (100.0%) | 28.0 |
Fertility by Age by Marriage Status in Lower Lake
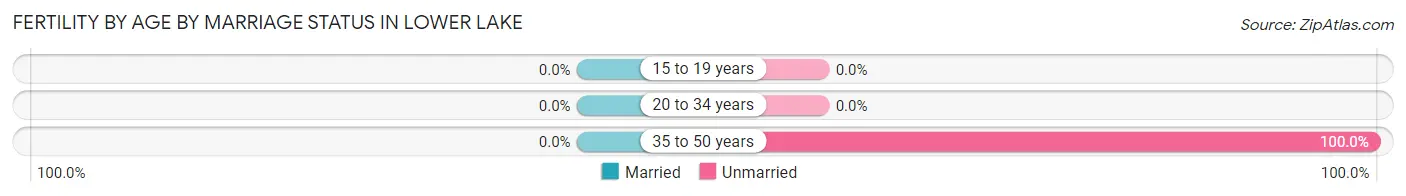
| Age Bracket | Married | Unmarried |
| 15 to 19 years | 0 (0.0%) | 0 (0.0%) |
| 20 to 34 years | 0 (0.0%) | 0 (0.0%) |
| 35 to 50 years | 0 (0.0%) | 11 (100.0%) |
| Total | 0 (0.0%) | 11 (100.0%) |
Fertility by Education in Lower Lake
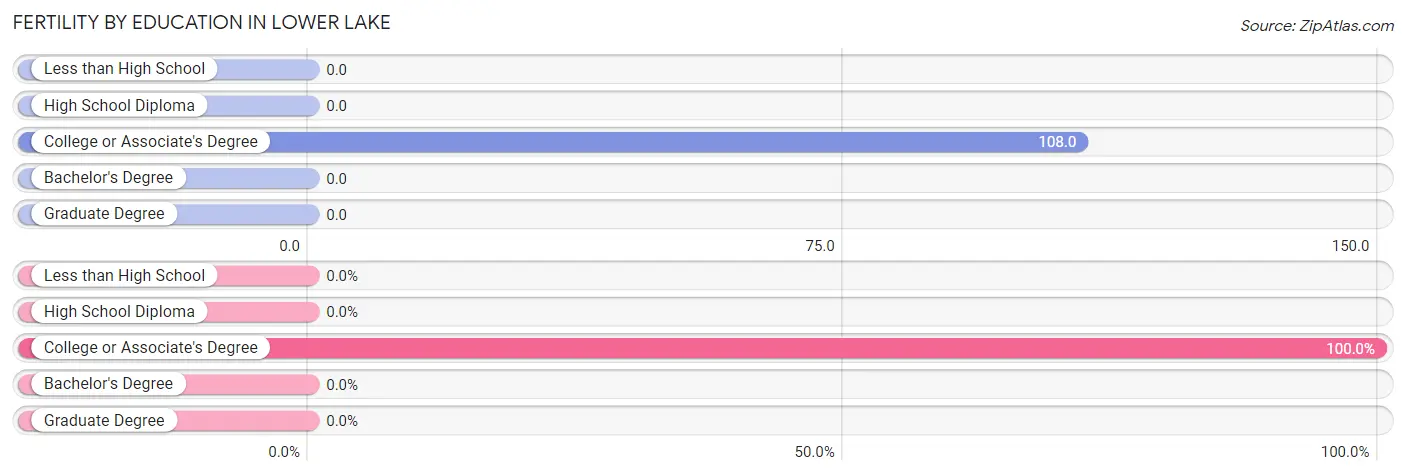
| Educational Attainment | Women with Births | Births / 1,000 Women |
| Less than High School | 0 (0.0%) | 0.0 |
| High School Diploma | 0 (0.0%) | 0.0 |
| College or Associate's Degree | 11 (100.0%) | 108.0 |
| Bachelor's Degree | 0 (0.0%) | 0.0 |
| Graduate Degree | 0 (0.0%) | 0.0 |
| Total | 11 (100.0%) | 28.0 |
Fertility by Education by Marriage Status in Lower Lake
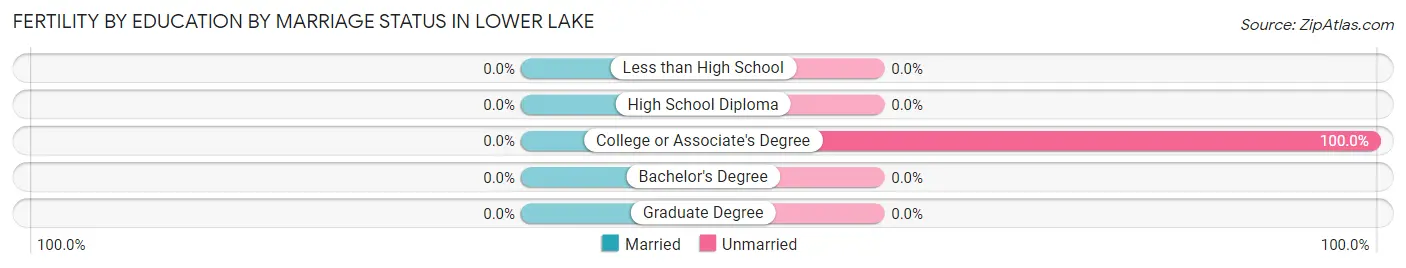
| Educational Attainment | Married | Unmarried |
| Less than High School | 0 (0.0%) | 0 (0.0%) |
| High School Diploma | 0 (0.0%) | 0 (0.0%) |
| College or Associate's Degree | 0 (0.0%) | 11 (100.0%) |
| Bachelor's Degree | 0 (0.0%) | 0 (0.0%) |
| Graduate Degree | 0 (0.0%) | 0 (0.0%) |
| Total | 0 (0.0%) | 11 (100.0%) |
Employment Characteristics in Lower Lake
Employment by Class of Employer in Lower Lake
Among the 462 employed individuals in Lower Lake, private company employees (350 | 75.8%), federal government employees (59 | 12.8%), and local government employees (46 | 10.0%) make up the most common classes of employment.
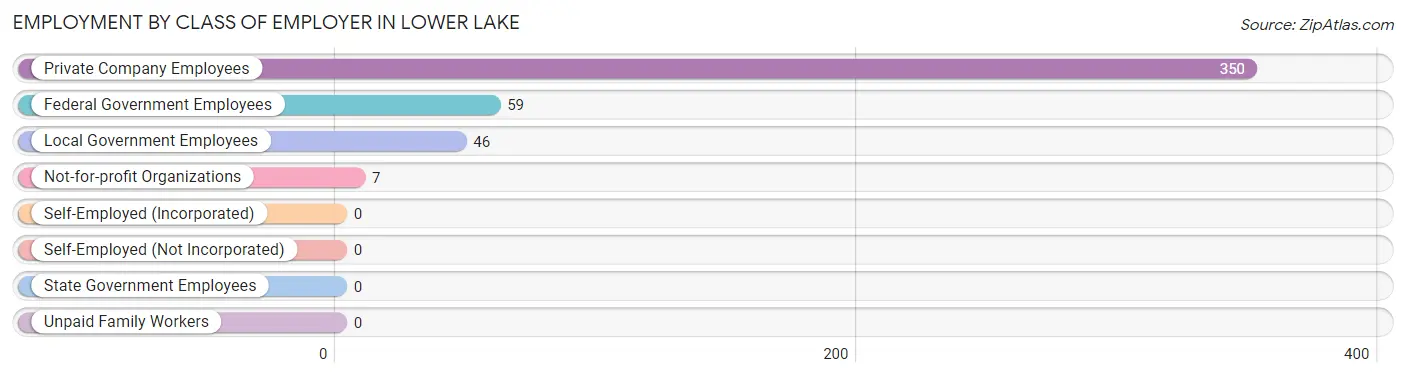
| Employer Class | # Employees | % Employees |
| Private Company Employees | 350 | 75.8% |
| Self-Employed (Incorporated) | 0 | 0.0% |
| Self-Employed (Not Incorporated) | 0 | 0.0% |
| Not-for-profit Organizations | 7 | 1.5% |
| Local Government Employees | 46 | 10.0% |
| State Government Employees | 0 | 0.0% |
| Federal Government Employees | 59 | 12.8% |
| Unpaid Family Workers | 0 | 0.0% |
| Total | 462 | 100.0% |
Employment Status by Age in Lower Lake
According to the labor force statistics for Lower Lake, out of the total population over 16 years of age (897), 55.6% or 499 individuals are in the labor force, with 2.4% or 12 of them unemployed. The age group with the highest labor force participation rate is 16 to 19 years, with 100.0% or 106 individuals in the labor force. Within the labor force, the 20 to 24 years age range has the highest percentage of unemployed individuals, with 100.0% or 1 of them being unemployed.
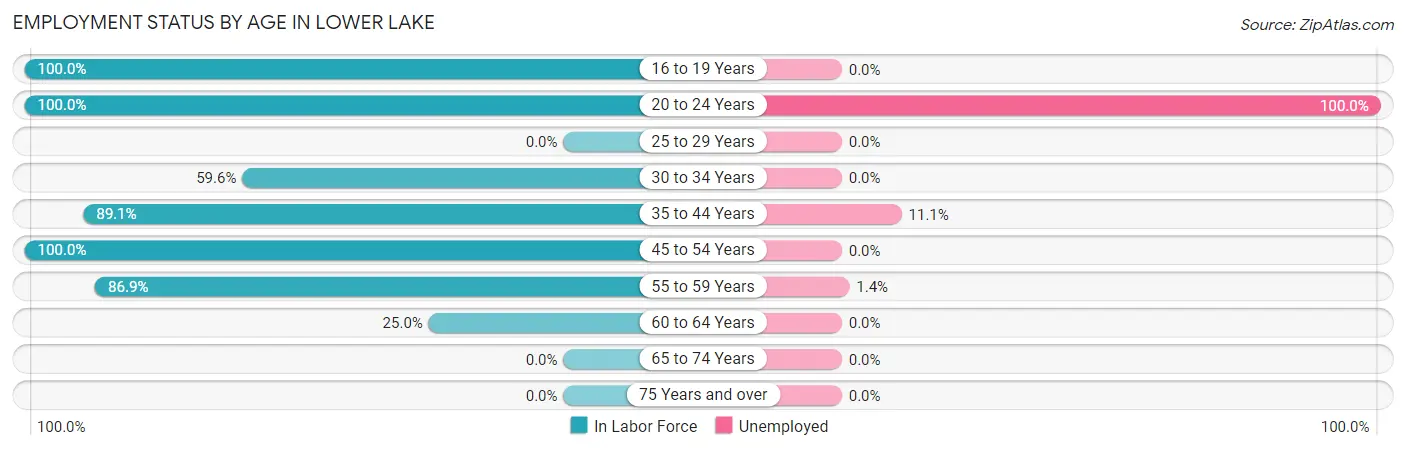
| Age Bracket | In Labor Force | Unemployed |
| 16 to 19 Years | 106 (100.0%) | 0 (0.0%) |
| 20 to 24 Years | 1 (100.0%) | 1 (100.0%) |
| 25 to 29 Years | 0 (0.0%) | 0 (0.0%) |
| 30 to 34 Years | 65 (59.6%) | 0 (0.0%) |
| 35 to 44 Years | 90 (89.1%) | 10 (11.1%) |
| 45 to 54 Years | 138 (100.0%) | 0 (0.0%) |
| 55 to 59 Years | 73 (86.9%) | 1 (1.4%) |
| 60 to 64 Years | 26 (25.0%) | 0 (0.0%) |
| 65 to 74 Years | 0 (0.0%) | 0 (0.0%) |
| 75 Years and over | 0 (0.0%) | 0 (0.0%) |
| Total | 499 (55.6%) | 12 (2.4%) |
Employment Status by Educational Attainment in Lower Lake
According to labor force statistics for Lower Lake, 68.3% of individuals (392) out of the total population between 25 and 64 years of age (574) are in the labor force, with 2.8% or 11 of them being unemployed. The group with the highest labor force participation rate are those with the educational attainment of bachelor's degree or higher, with 98.9% or 91 individuals in the labor force. Within the labor force, individuals with college / associate degree education have the highest percentage of unemployment, with 12.3% or 10 of them being unemployed.
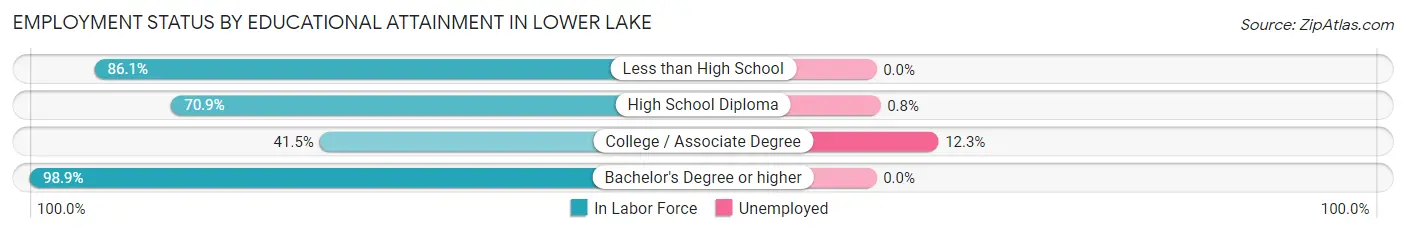
| Educational Attainment | In Labor Force | Unemployed |
| Less than High School | 93 (86.1%) | 0 (0.0%) |
| High School Diploma | 127 (70.9%) | 1 (0.8%) |
| College / Associate Degree | 81 (41.5%) | 24 (12.3%) |
| Bachelor's Degree or higher | 91 (98.9%) | 0 (0.0%) |
| Total | 392 (68.3%) | 16 (2.8%) |
Employment Occupations by Sex in Lower Lake
Management, Business, Science and Arts Occupations
The most common Management, Business, Science and Arts occupations in Lower Lake are Management (32 | 6.6%), Community & Social Service (32 | 6.6%), Education, Arts & Media (32 | 6.6%), and Health Diagnosing & Treating (12 | 2.5%).
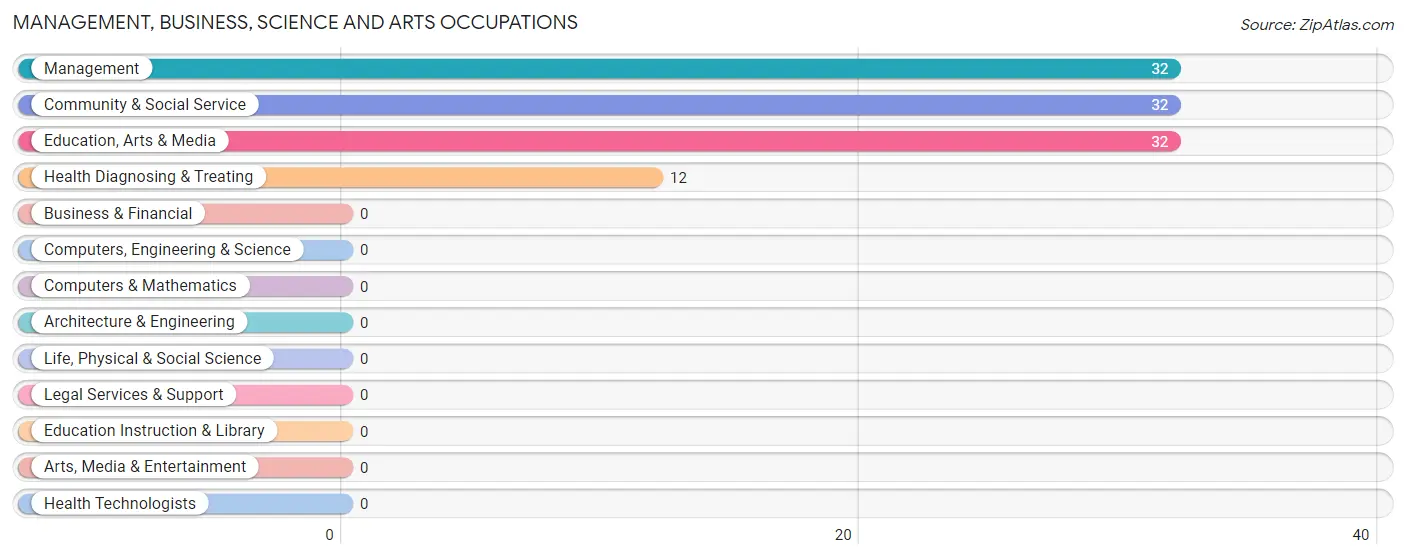
Management, Business, Science and Arts Occupations by Sex
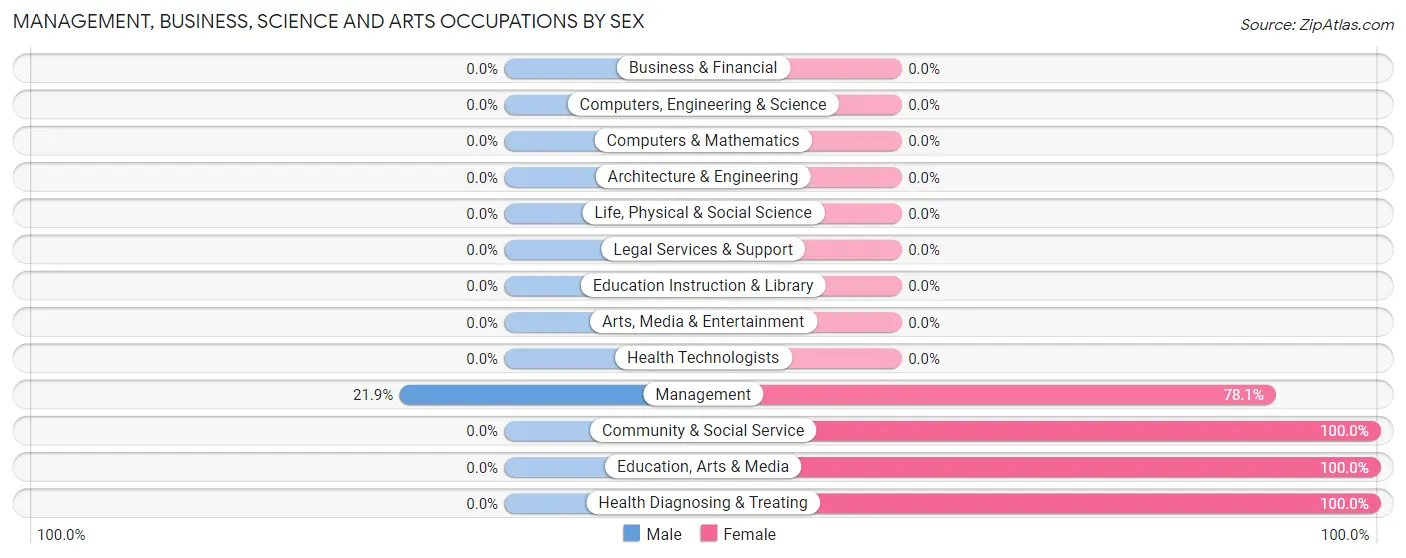
| Occupation | Male | Female |
| Management | 7 (21.9%) | 25 (78.1%) |
| Business & Financial | 0 (0.0%) | 0 (0.0%) |
| Computers, Engineering & Science | 0 (0.0%) | 0 (0.0%) |
| Computers & Mathematics | 0 (0.0%) | 0 (0.0%) |
| Architecture & Engineering | 0 (0.0%) | 0 (0.0%) |
| Life, Physical & Social Science | 0 (0.0%) | 0 (0.0%) |
| Community & Social Service | 0 (0.0%) | 32 (100.0%) |
| Education, Arts & Media | 0 (0.0%) | 32 (100.0%) |
| Legal Services & Support | 0 (0.0%) | 0 (0.0%) |
| Education Instruction & Library | 0 (0.0%) | 0 (0.0%) |
| Arts, Media & Entertainment | 0 (0.0%) | 0 (0.0%) |
| Health Diagnosing & Treating | 0 (0.0%) | 12 (100.0%) |
| Health Technologists | 0 (0.0%) | 0 (0.0%) |
| Total (Category) | 7 (9.2%) | 69 (90.8%) |
| Total (Overall) | 171 (35.1%) | 316 (64.9%) |
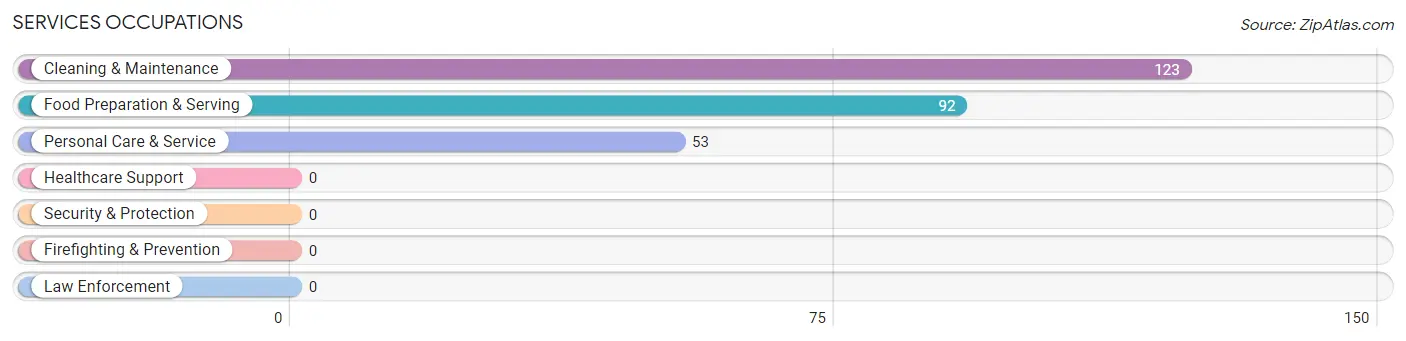
Services Occupations
The most common Services occupations in Lower Lake are Cleaning & Maintenance (123 | 25.3%), Food Preparation & Serving (92 | 18.9%), and Personal Care & Service (53 | 10.9%).
Services Occupations by Sex
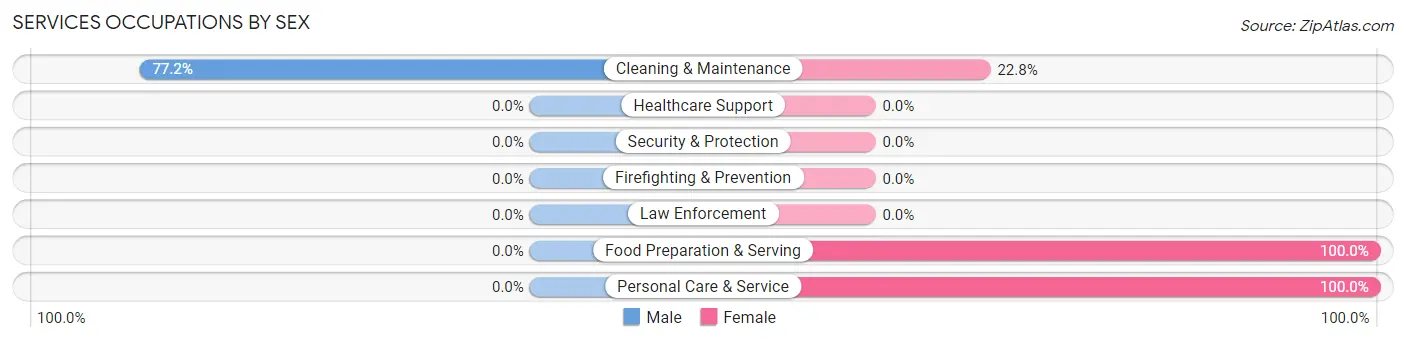
| Occupation | Male | Female |
| Healthcare Support | 0 (0.0%) | 0 (0.0%) |
| Security & Protection | 0 (0.0%) | 0 (0.0%) |
| Firefighting & Prevention | 0 (0.0%) | 0 (0.0%) |
| Law Enforcement | 0 (0.0%) | 0 (0.0%) |
| Food Preparation & Serving | 0 (0.0%) | 92 (100.0%) |
| Cleaning & Maintenance | 95 (77.2%) | 28 (22.8%) |
| Personal Care & Service | 0 (0.0%) | 53 (100.0%) |
| Total (Category) | 95 (35.4%) | 173 (64.5%) |
| Total (Overall) | 171 (35.1%) | 316 (64.9%) |
Sales and Office Occupations
The most common Sales and Office occupations in Lower Lake are , and Sales & Related (25 | 5.1%).
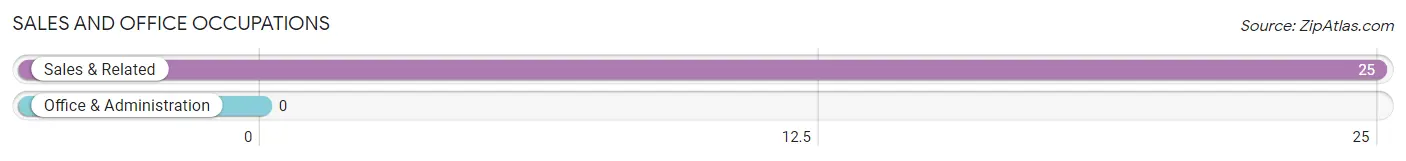
Sales and Office Occupations by Sex
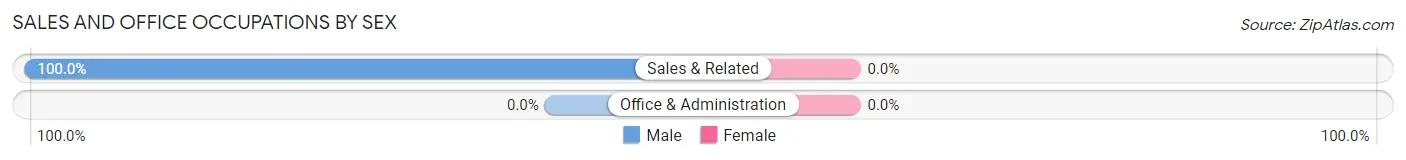
| Occupation | Male | Female |
| Sales & Related | 25 (100.0%) | 0 (0.0%) |
| Office & Administration | 0 (0.0%) | 0 (0.0%) |
| Total (Category) | 25 (100.0%) | 0 (0.0%) |
| Total (Overall) | 171 (35.1%) | 316 (64.9%) |
Natural Resources, Construction and Maintenance Occupations
The most common Natural Resources, Construction and Maintenance occupations in Lower Lake are Installation, Maintenance & Repair (44 | 9.0%), and Construction & Extraction (34 | 7.0%).
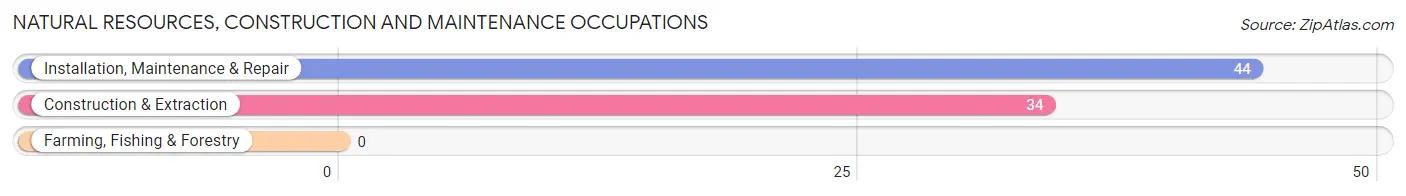
Natural Resources, Construction and Maintenance Occupations by Sex
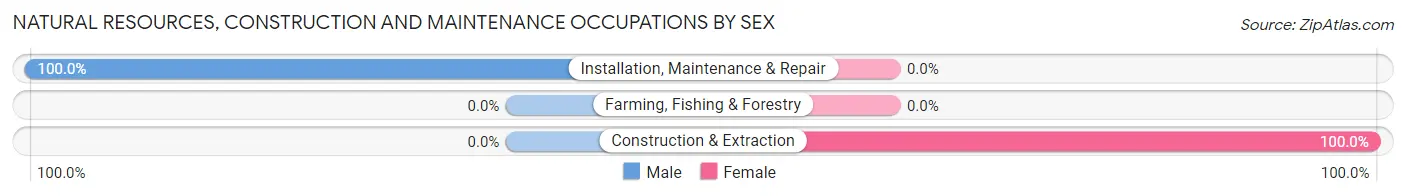
| Occupation | Male | Female |
| Farming, Fishing & Forestry | 0 (0.0%) | 0 (0.0%) |
| Construction & Extraction | 0 (0.0%) | 34 (100.0%) |
| Installation, Maintenance & Repair | 44 (100.0%) | 0 (0.0%) |
| Total (Category) | 44 (56.4%) | 34 (43.6%) |
| Total (Overall) | 171 (35.1%) | 316 (64.9%) |
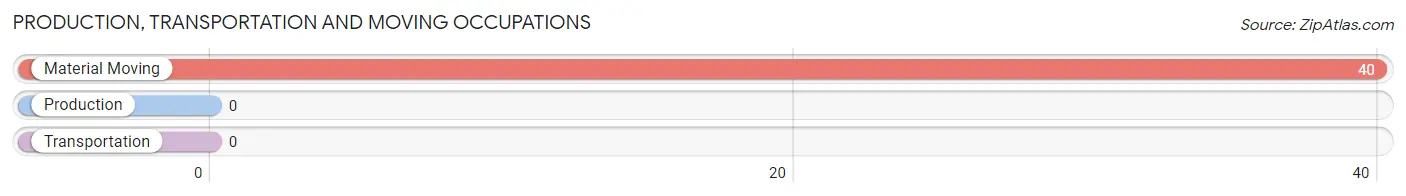
Production, Transportation and Moving Occupations
The most common Production, Transportation and Moving occupations in Lower Lake are , and Material Moving (40 | 8.2%).
Production, Transportation and Moving Occupations by Sex
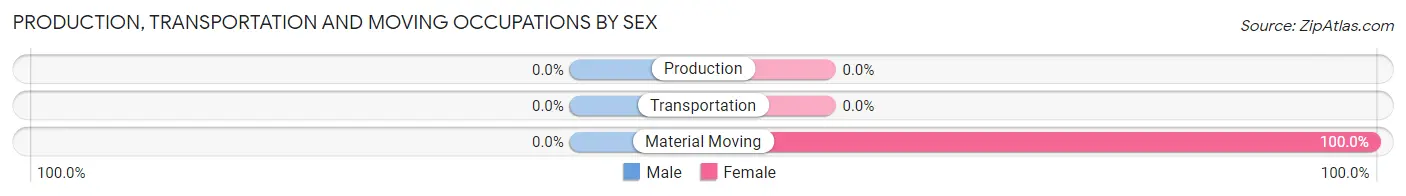
| Occupation | Male | Female |
| Production | 0 (0.0%) | 0 (0.0%) |
| Transportation | 0 (0.0%) | 0 (0.0%) |
| Material Moving | 0 (0.0%) | 40 (100.0%) |
| Total (Category) | 0 (0.0%) | 40 (100.0%) |
| Total (Overall) | 171 (35.1%) | 316 (64.9%) |
Employment Industries by Sex in Lower Lake
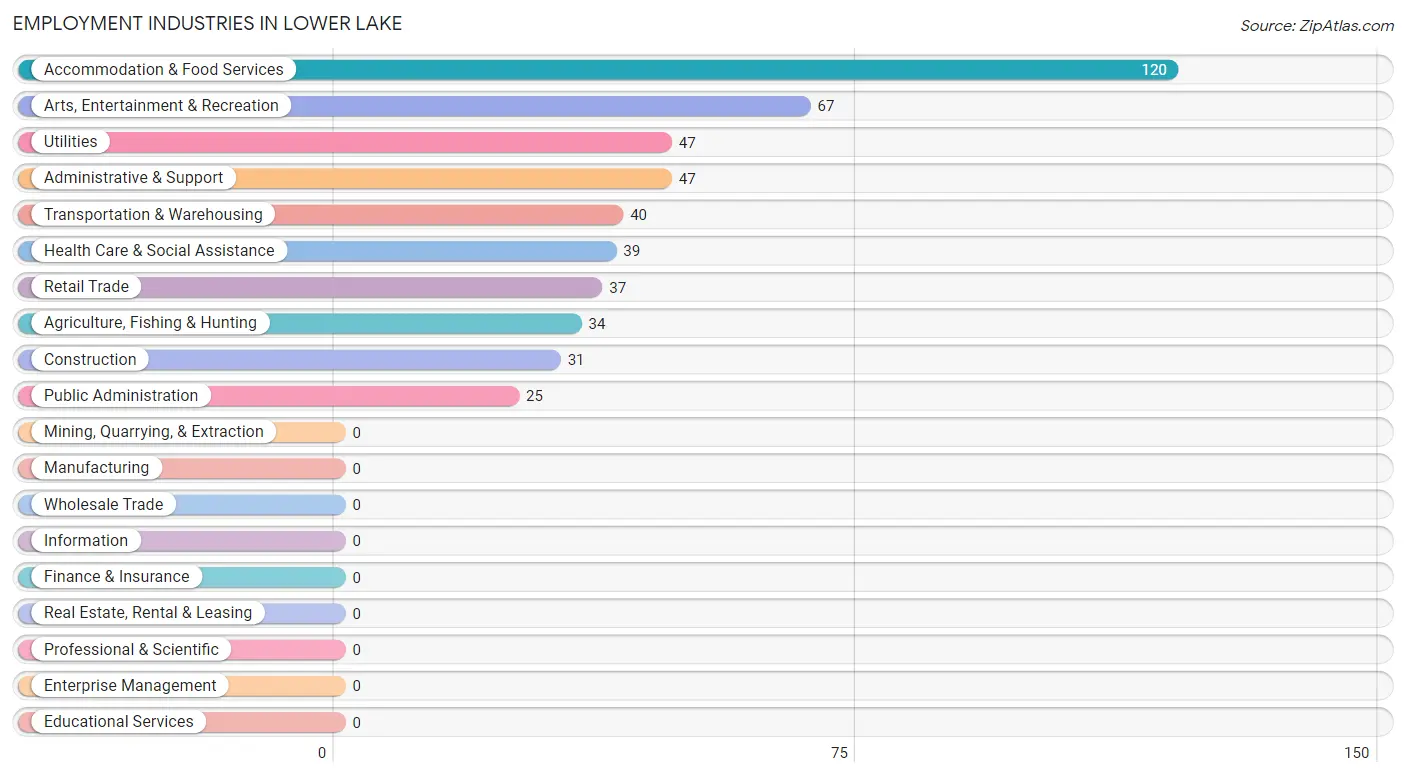
Employment Industries in Lower Lake
The major employment industries in Lower Lake include Accommodation & Food Services (120 | 24.6%), Arts, Entertainment & Recreation (67 | 13.8%), Utilities (47 | 9.7%), Administrative & Support (47 | 9.7%), and Transportation & Warehousing (40 | 8.2%).
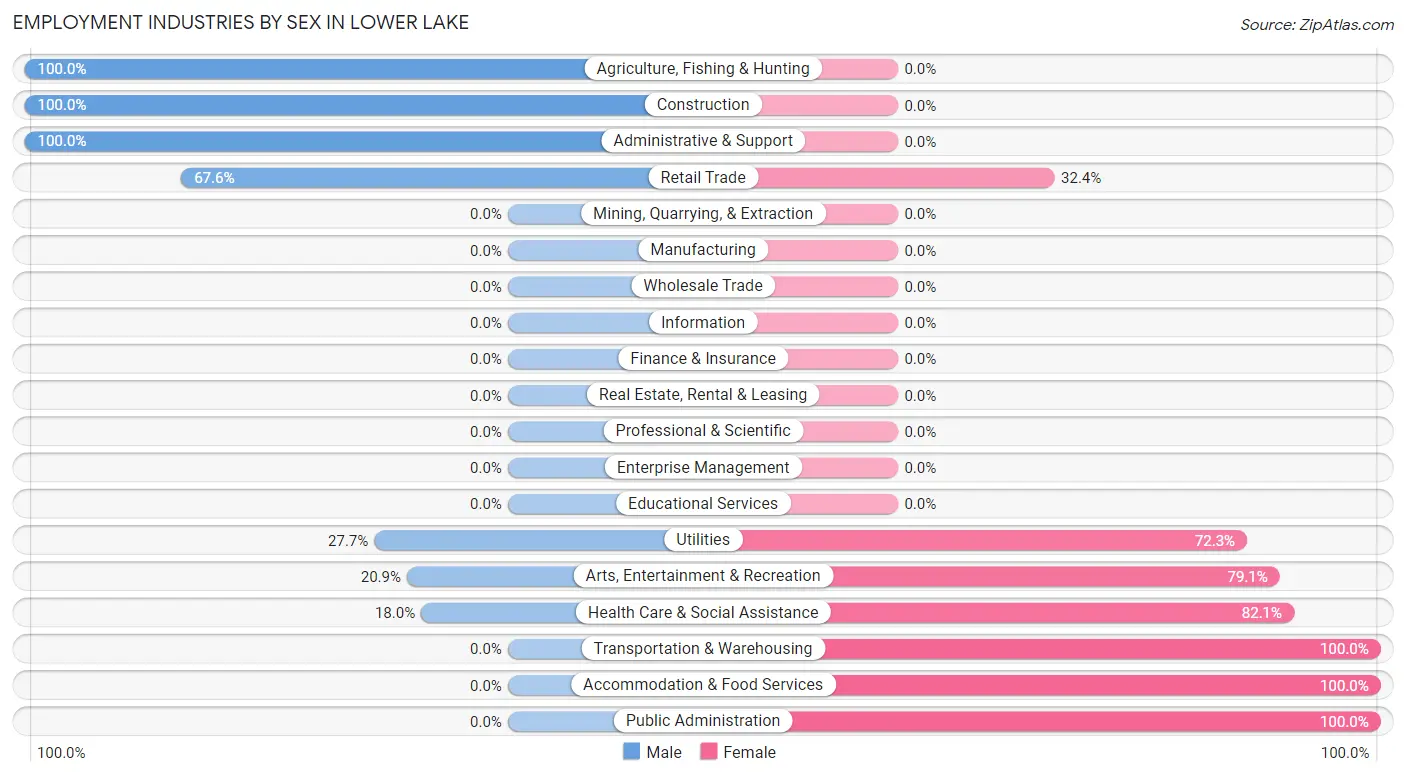
Employment Industries by Sex in Lower Lake
The Lower Lake industries that see more men than women are Agriculture, Fishing & Hunting (100.0%), Construction (100.0%), and Administrative & Support (100.0%), whereas the industries that tend to have a higher number of women are Transportation & Warehousing (100.0%), Accommodation & Food Services (100.0%), and Public Administration (100.0%).
| Industry | Male | Female |
| Agriculture, Fishing & Hunting | 34 (100.0%) | 0 (0.0%) |
| Mining, Quarrying, & Extraction | 0 (0.0%) | 0 (0.0%) |
| Construction | 31 (100.0%) | 0 (0.0%) |
| Manufacturing | 0 (0.0%) | 0 (0.0%) |
| Wholesale Trade | 0 (0.0%) | 0 (0.0%) |
| Retail Trade | 25 (67.6%) | 12 (32.4%) |
| Transportation & Warehousing | 0 (0.0%) | 40 (100.0%) |
| Utilities | 13 (27.7%) | 34 (72.3%) |
| Information | 0 (0.0%) | 0 (0.0%) |
| Finance & Insurance | 0 (0.0%) | 0 (0.0%) |
| Real Estate, Rental & Leasing | 0 (0.0%) | 0 (0.0%) |
| Professional & Scientific | 0 (0.0%) | 0 (0.0%) |
| Enterprise Management | 0 (0.0%) | 0 (0.0%) |
| Administrative & Support | 47 (100.0%) | 0 (0.0%) |
| Educational Services | 0 (0.0%) | 0 (0.0%) |
| Health Care & Social Assistance | 7 (17.9%) | 32 (82.1%) |
| Arts, Entertainment & Recreation | 14 (20.9%) | 53 (79.1%) |
| Accommodation & Food Services | 0 (0.0%) | 120 (100.0%) |
| Public Administration | 0 (0.0%) | 25 (100.0%) |
| Total | 171 (35.1%) | 316 (64.9%) |
Education in Lower Lake
School Enrollment in Lower Lake
The most common levels of schooling among the 449 students in Lower Lake are high school (216 | 48.1%), elementary school (150 | 33.4%), and middle school (64 | 14.2%).
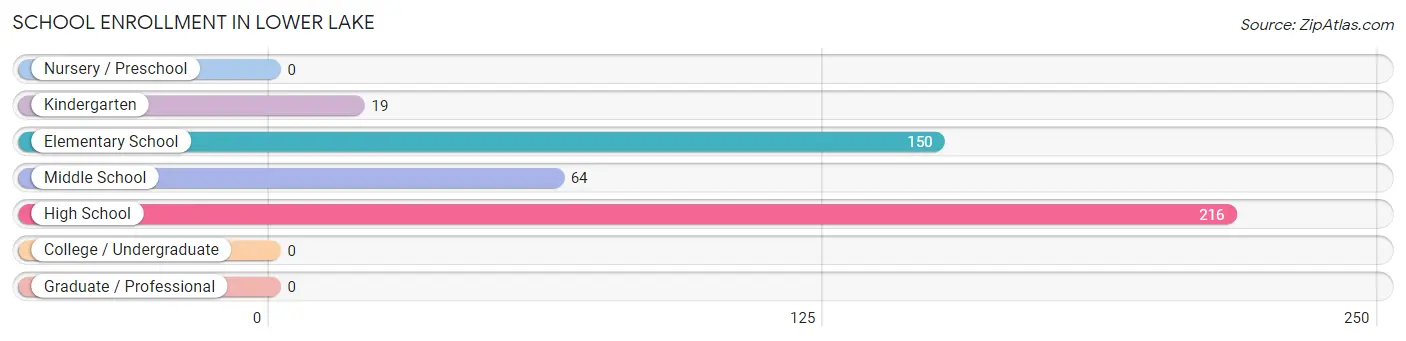
| School Level | # Students | % Students |
| Nursery / Preschool | 0 | 0.0% |
| Kindergarten | 19 | 4.2% |
| Elementary School | 150 | 33.4% |
| Middle School | 64 | 14.2% |
| High School | 216 | 48.1% |
| College / Undergraduate | 0 | 0.0% |
| Graduate / Professional | 0 | 0.0% |
| Total | 449 | 100.0% |
School Enrollment by Age by Funding Source in Lower Lake
Out of a total of 449 students who are enrolled in schools in Lower Lake, 53 (11.8%) attend a private institution, while the remaining 396 (88.2%) are enrolled in public schools. The age group of 18 to 19 year olds has the highest likelihood of being enrolled in private schools, with 53 (100.0% in the age bracket) enrolled. Conversely, the age group of 5 to 9 year old has the lowest likelihood of being enrolled in a private school, with 169 (100.0% in the age bracket) attending a public institution.
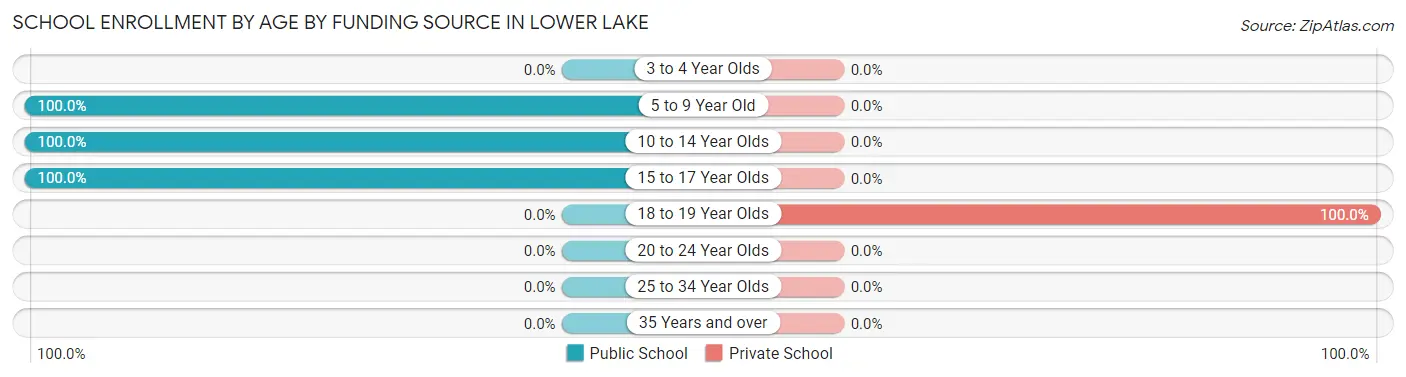
| Age Bracket | Public School | Private School |
| 3 to 4 Year Olds | 0 (0.0%) | 0 (0.0%) |
| 5 to 9 Year Old | 169 (100.0%) | 0 (0.0%) |
| 10 to 14 Year Olds | 104 (100.0%) | 0 (0.0%) |
| 15 to 17 Year Olds | 123 (100.0%) | 0 (0.0%) |
| 18 to 19 Year Olds | 0 (0.0%) | 53 (100.0%) |
| 20 to 24 Year Olds | 0 (0.0%) | 0 (0.0%) |
| 25 to 34 Year Olds | 0 (0.0%) | 0 (0.0%) |
| 35 Years and over | 0 (0.0%) | 0 (0.0%) |
| Total | 396 (88.2%) | 53 (11.8%) |
Educational Attainment by Field of Study in Lower Lake
Engineering (34 | 26.0%), psychology (32 | 24.4%), bio, nature & agricultural (30 | 22.9%), social sciences (25 | 19.1%), and business (9 | 6.9%) are the most common fields of study among 131 individuals in Lower Lake who have obtained a bachelor's degree or higher.
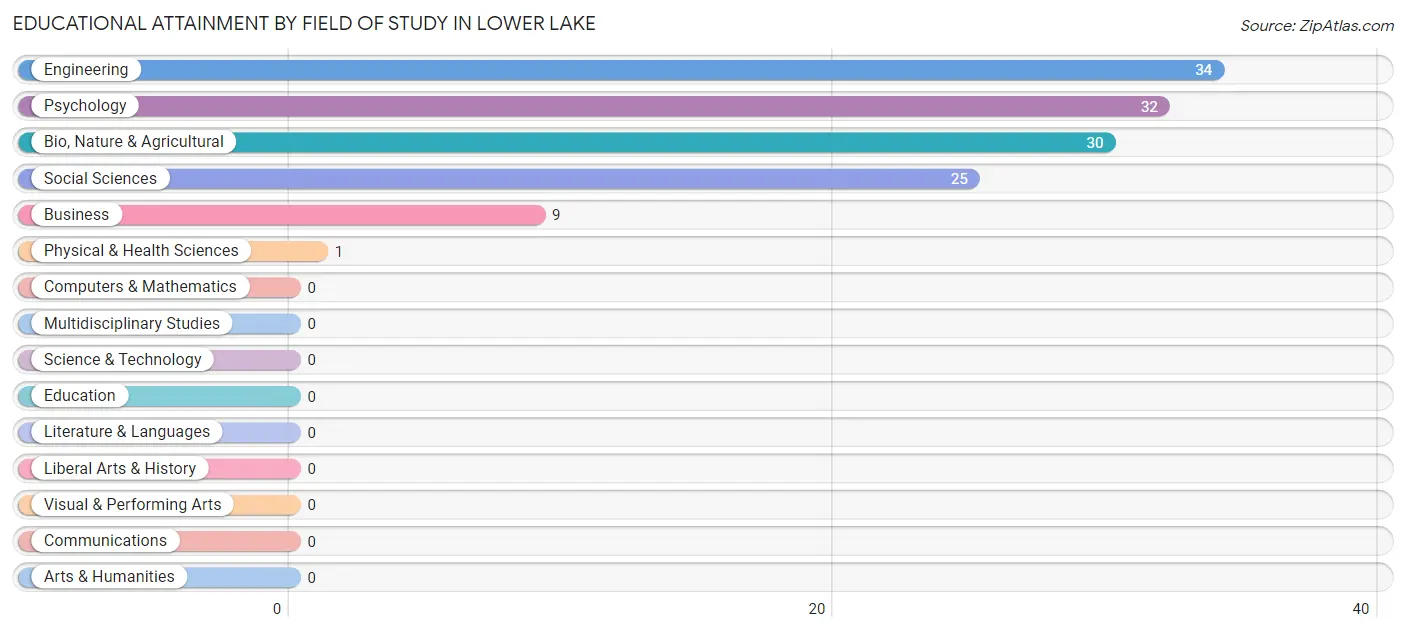
| Field of Study | # Graduates | % Graduates |
| Computers & Mathematics | 0 | 0.0% |
| Bio, Nature & Agricultural | 30 | 22.9% |
| Physical & Health Sciences | 1 | 0.8% |
| Psychology | 32 | 24.4% |
| Social Sciences | 25 | 19.1% |
| Engineering | 34 | 26.0% |
| Multidisciplinary Studies | 0 | 0.0% |
| Science & Technology | 0 | 0.0% |
| Business | 9 | 6.9% |
| Education | 0 | 0.0% |
| Literature & Languages | 0 | 0.0% |
| Liberal Arts & History | 0 | 0.0% |
| Visual & Performing Arts | 0 | 0.0% |
| Communications | 0 | 0.0% |
| Arts & Humanities | 0 | 0.0% |
| Total | 131 | 100.0% |
Transportation & Commute in Lower Lake
Vehicle Availability by Sex in Lower Lake
The most prevalent vehicle ownership categories in Lower Lake are males with 3 vehicles (81, accounting for 55.5%) and females with 3 vehicles (185, making up 25.6%).
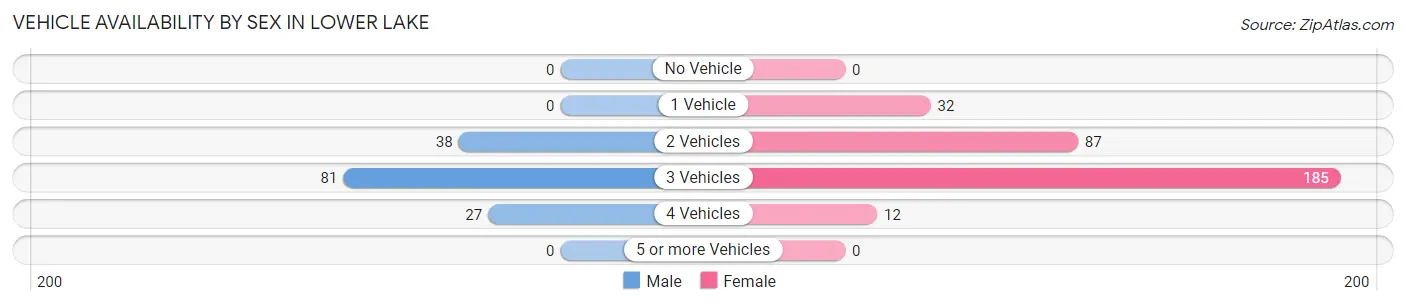
| Vehicles Available | Male | Female |
| No Vehicle | 0 (0.0%) | 0 (0.0%) |
| 1 Vehicle | 0 (0.0%) | 32 (10.1%) |
| 2 Vehicles | 38 (26.0%) | 87 (27.5%) |
| 3 Vehicles | 81 (55.5%) | 185 (58.5%) |
| 4 Vehicles | 27 (18.5%) | 12 (3.8%) |
| 5 or more Vehicles | 0 (0.0%) | 0 (0.0%) |
| Total | 146 (100.0%) | 316 (100.0%) |
Commute Time in Lower Lake
The most frequently occuring commute durations in Lower Lake are 5 to 9 minutes (112 commuters, 24.2%), 90 or more minutes (81 commuters, 17.5%), and 35 to 39 minutes (79 commuters, 17.1%).
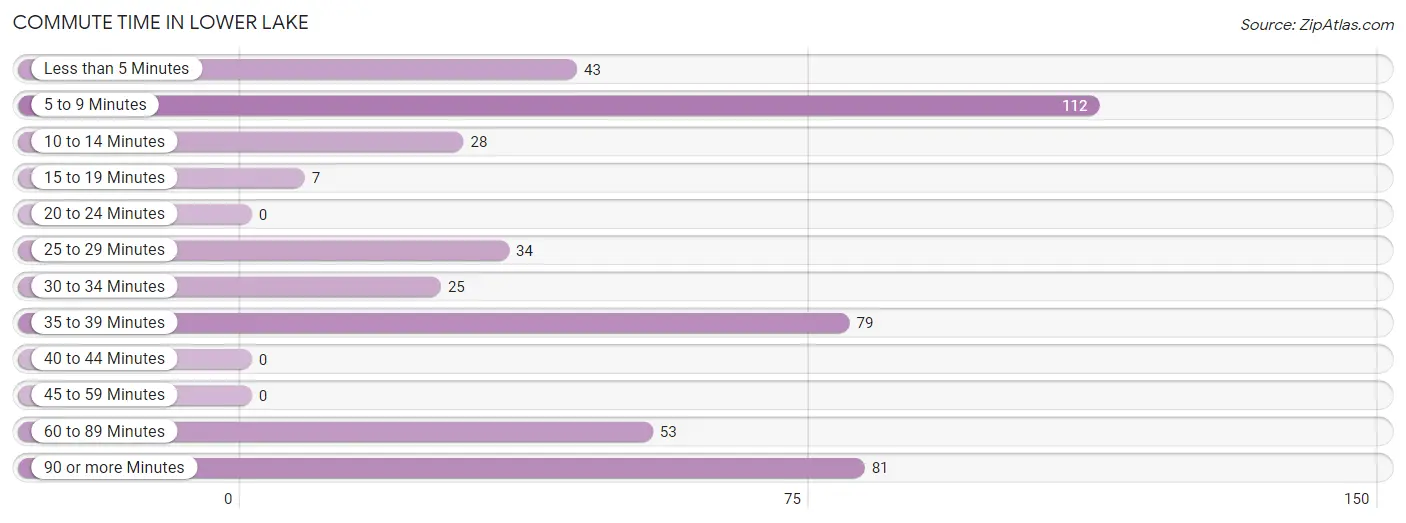
| Commute Time | # Commuters | % Commuters |
| Less than 5 Minutes | 43 | 9.3% |
| 5 to 9 Minutes | 112 | 24.2% |
| 10 to 14 Minutes | 28 | 6.1% |
| 15 to 19 Minutes | 7 | 1.5% |
| 20 to 24 Minutes | 0 | 0.0% |
| 25 to 29 Minutes | 34 | 7.4% |
| 30 to 34 Minutes | 25 | 5.4% |
| 35 to 39 Minutes | 79 | 17.1% |
| 40 to 44 Minutes | 0 | 0.0% |
| 45 to 59 Minutes | 0 | 0.0% |
| 60 to 89 Minutes | 53 | 11.5% |
| 90 or more Minutes | 81 | 17.5% |
Commute Time by Sex in Lower Lake
The most common commute times in Lower Lake are 90 or more minutes (81 commuters, 55.5%) for males and 5 to 9 minutes (85 commuters, 26.9%) for females.
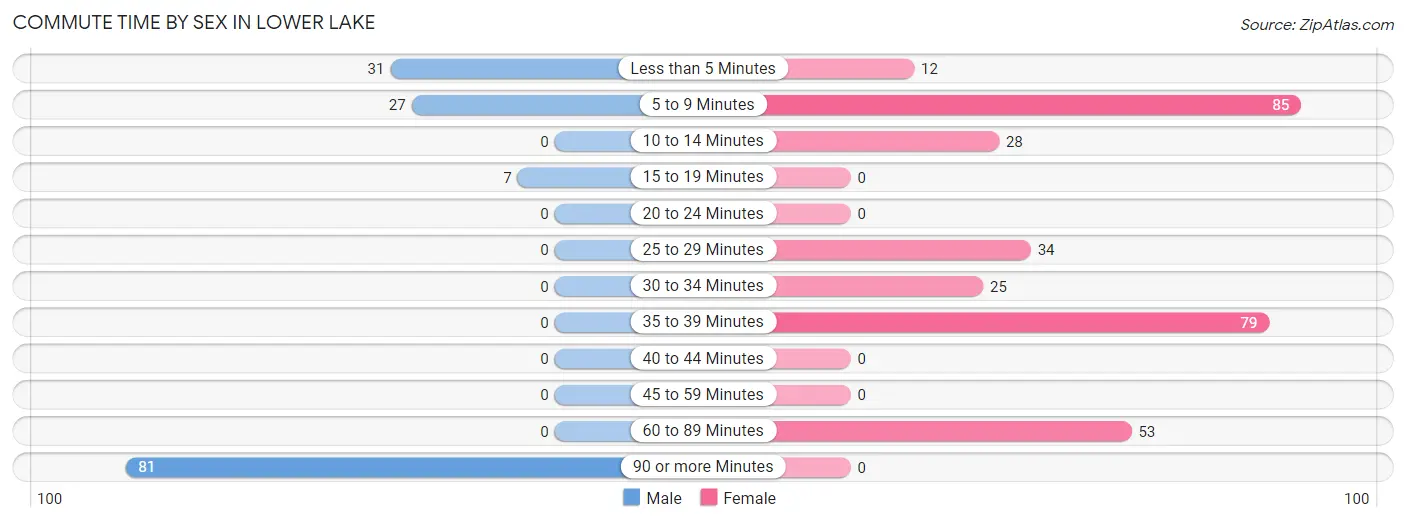
| Commute Time | Male | Female |
| Less than 5 Minutes | 31 (21.2%) | 12 (3.8%) |
| 5 to 9 Minutes | 27 (18.5%) | 85 (26.9%) |
| 10 to 14 Minutes | 0 (0.0%) | 28 (8.9%) |
| 15 to 19 Minutes | 7 (4.8%) | 0 (0.0%) |
| 20 to 24 Minutes | 0 (0.0%) | 0 (0.0%) |
| 25 to 29 Minutes | 0 (0.0%) | 34 (10.8%) |
| 30 to 34 Minutes | 0 (0.0%) | 25 (7.9%) |
| 35 to 39 Minutes | 0 (0.0%) | 79 (25.0%) |
| 40 to 44 Minutes | 0 (0.0%) | 0 (0.0%) |
| 45 to 59 Minutes | 0 (0.0%) | 0 (0.0%) |
| 60 to 89 Minutes | 0 (0.0%) | 53 (16.8%) |
| 90 or more Minutes | 81 (55.5%) | 0 (0.0%) |
Time of Departure to Work by Sex in Lower Lake
The most frequent times of departure to work in Lower Lake are 5:00 AM to 5:29 AM (81, 55.5%) for males and 7:00 AM to 7:29 AM (111, 35.1%) for females.
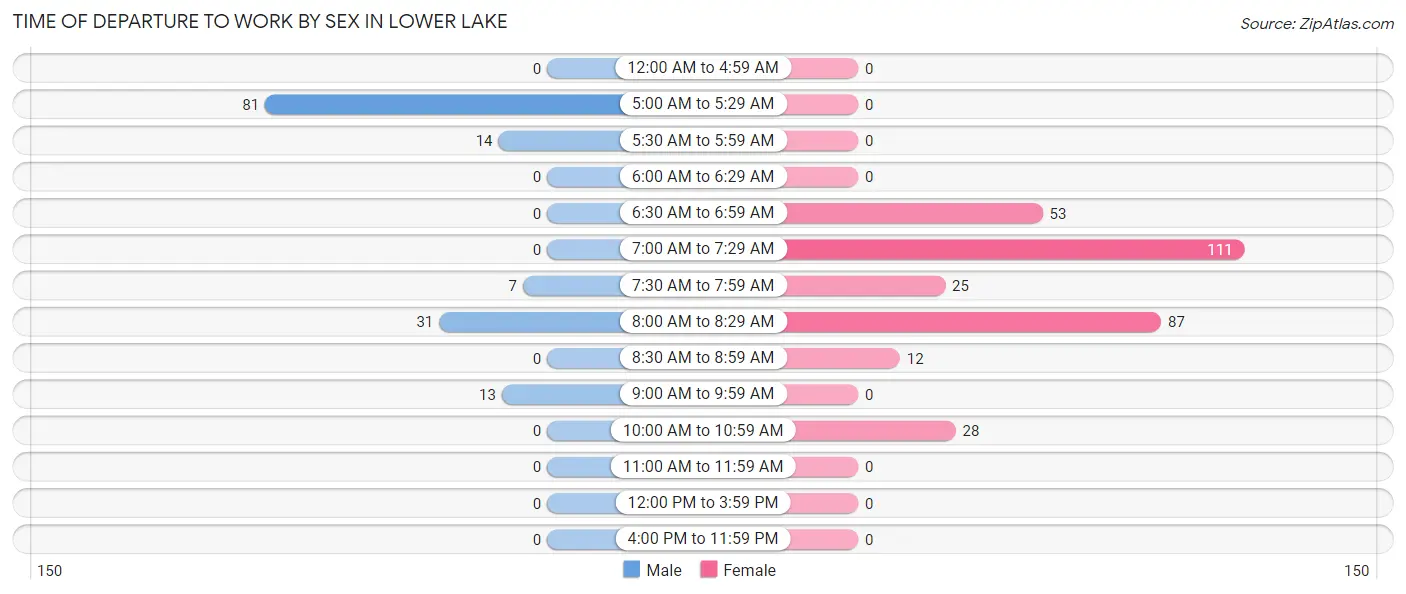
| Time of Departure | Male | Female |
| 12:00 AM to 4:59 AM | 0 (0.0%) | 0 (0.0%) |
| 5:00 AM to 5:29 AM | 81 (55.5%) | 0 (0.0%) |
| 5:30 AM to 5:59 AM | 14 (9.6%) | 0 (0.0%) |
| 6:00 AM to 6:29 AM | 0 (0.0%) | 0 (0.0%) |
| 6:30 AM to 6:59 AM | 0 (0.0%) | 53 (16.8%) |
| 7:00 AM to 7:29 AM | 0 (0.0%) | 111 (35.1%) |
| 7:30 AM to 7:59 AM | 7 (4.8%) | 25 (7.9%) |
| 8:00 AM to 8:29 AM | 31 (21.2%) | 87 (27.5%) |
| 8:30 AM to 8:59 AM | 0 (0.0%) | 12 (3.8%) |
| 9:00 AM to 9:59 AM | 13 (8.9%) | 0 (0.0%) |
| 10:00 AM to 10:59 AM | 0 (0.0%) | 28 (8.9%) |
| 11:00 AM to 11:59 AM | 0 (0.0%) | 0 (0.0%) |
| 12:00 PM to 3:59 PM | 0 (0.0%) | 0 (0.0%) |
| 4:00 PM to 11:59 PM | 0 (0.0%) | 0 (0.0%) |
| Total | 146 (100.0%) | 316 (100.0%) |
Housing Occupancy in Lower Lake
Occupancy by Ownership in Lower Lake
Of the total 454 dwellings in Lower Lake, owner-occupied units account for 161 (35.5%), while renter-occupied units make up 293 (64.5%).
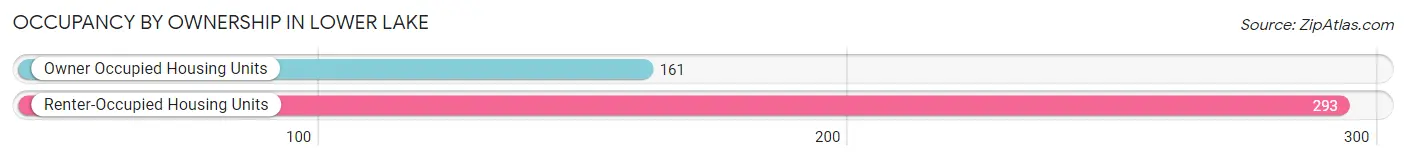
| Occupancy | # Housing Units | % Housing Units |
| Owner Occupied Housing Units | 161 | 35.5% |
| Renter-Occupied Housing Units | 293 | 64.5% |
| Total Occupied Housing Units | 454 | 100.0% |
Occupancy by Household Size in Lower Lake
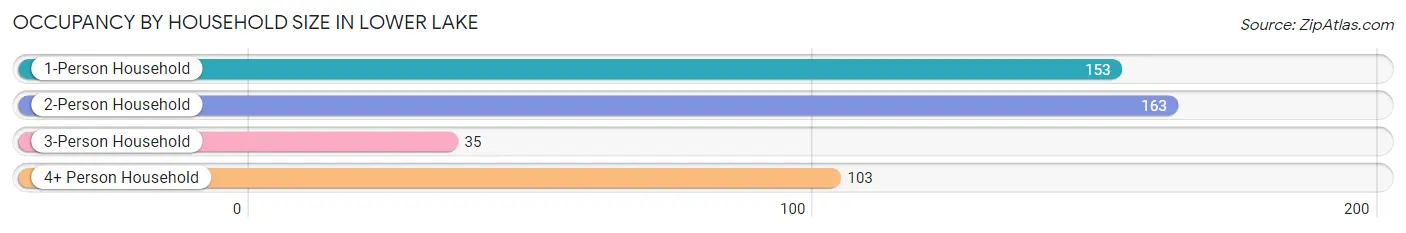
| Household Size | # Housing Units | % Housing Units |
| 1-Person Household | 153 | 33.7% |
| 2-Person Household | 163 | 35.9% |
| 3-Person Household | 35 | 7.7% |
| 4+ Person Household | 103 | 22.7% |
| Total Housing Units | 454 | 100.0% |
Occupancy by Ownership by Household Size in Lower Lake
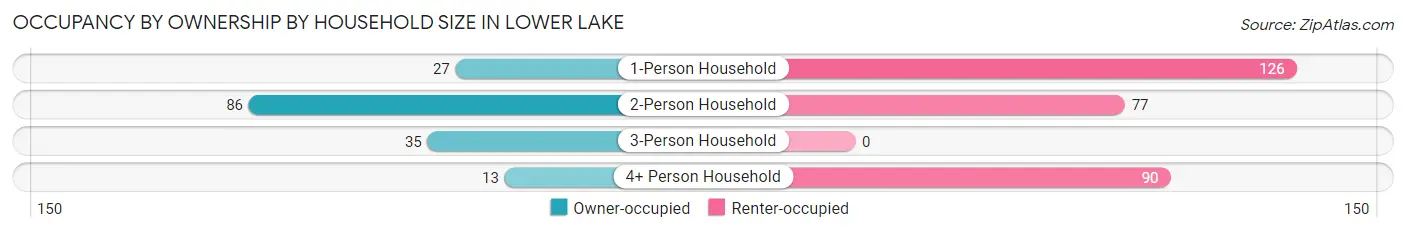
| Household Size | Owner-occupied | Renter-occupied |
| 1-Person Household | 27 (17.6%) | 126 (82.4%) |
| 2-Person Household | 86 (52.8%) | 77 (47.2%) |
| 3-Person Household | 35 (100.0%) | 0 (0.0%) |
| 4+ Person Household | 13 (12.6%) | 90 (87.4%) |
| Total Housing Units | 161 (35.5%) | 293 (64.5%) |
Occupancy by Educational Attainment in Lower Lake
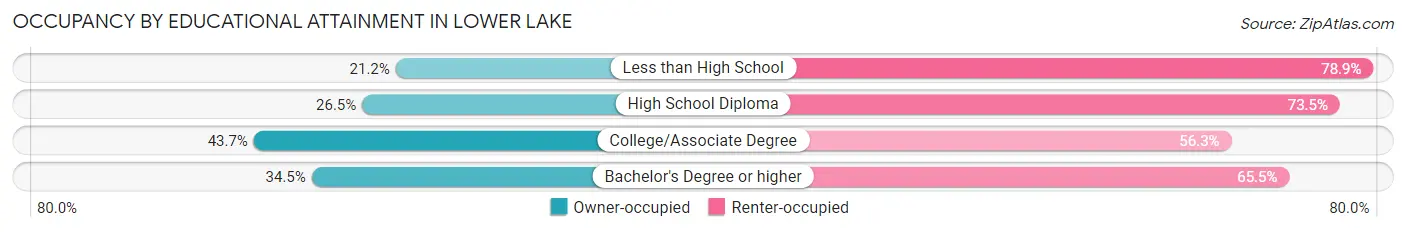
| Household Size | Owner-occupied | Renter-occupied |
| Less than High School | 11 (21.1%) | 41 (78.8%) |
| High School Diploma | 27 (26.5%) | 75 (73.5%) |
| College/Associate Degree | 93 (43.7%) | 120 (56.3%) |
| Bachelor's Degree or higher | 30 (34.5%) | 57 (65.5%) |
Occupancy by Age of Householder in Lower Lake
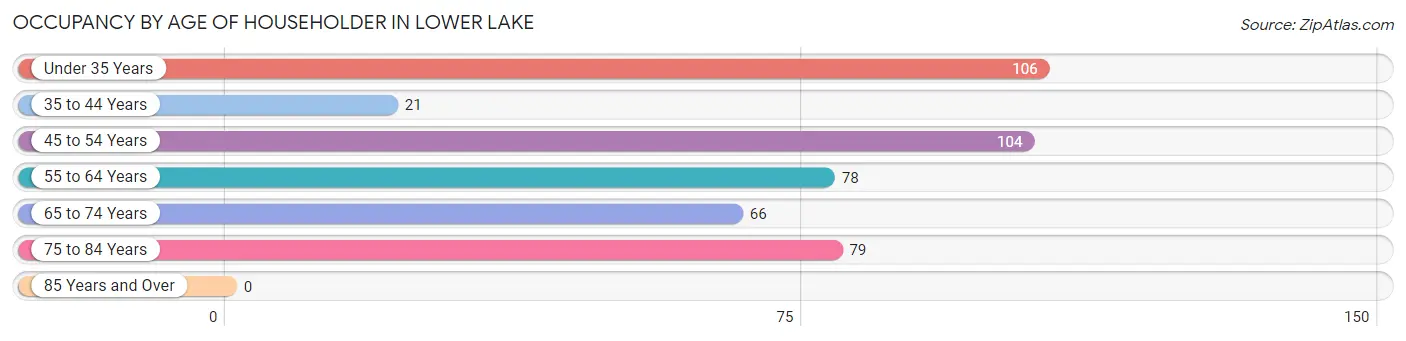
| Age Bracket | # Households | % Households |
| Under 35 Years | 106 | 23.4% |
| 35 to 44 Years | 21 | 4.6% |
| 45 to 54 Years | 104 | 22.9% |
| 55 to 64 Years | 78 | 17.2% |
| 65 to 74 Years | 66 | 14.5% |
| 75 to 84 Years | 79 | 17.4% |
| 85 Years and Over | 0 | 0.0% |
| Total | 454 | 100.0% |
Housing Finances in Lower Lake
Median Income by Occupancy in Lower Lake
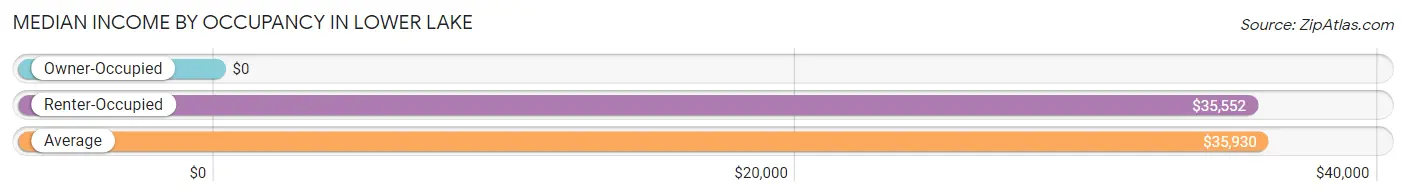
| Occupancy Type | # Households | Median Income |
| Owner-Occupied | 161 (35.5%) | $0 |
| Renter-Occupied | 293 (64.5%) | $35,552 |
| Average | 454 (100.0%) | $35,930 |
Occupancy by Householder Income Bracket in Lower Lake
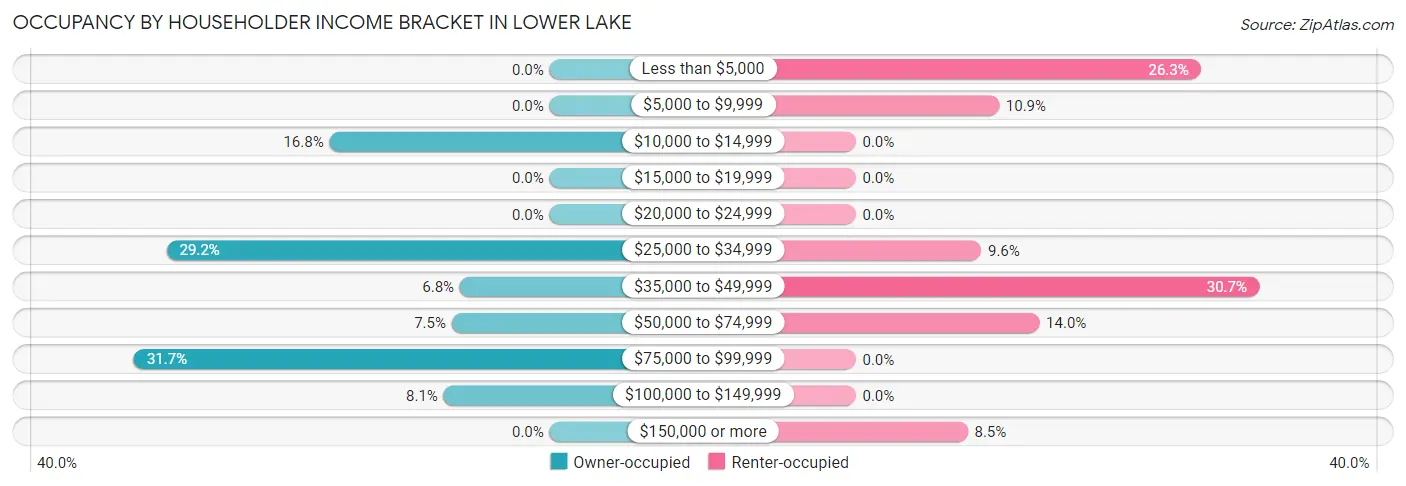
| Income Bracket | Owner-occupied | Renter-occupied |
| Less than $5,000 | 0 (0.0%) | 77 (26.3%) |
| $5,000 to $9,999 | 0 (0.0%) | 32 (10.9%) |
| $10,000 to $14,999 | 27 (16.8%) | 0 (0.0%) |
| $15,000 to $19,999 | 0 (0.0%) | 0 (0.0%) |
| $20,000 to $24,999 | 0 (0.0%) | 0 (0.0%) |
| $25,000 to $34,999 | 47 (29.2%) | 28 (9.6%) |
| $35,000 to $49,999 | 11 (6.8%) | 90 (30.7%) |
| $50,000 to $74,999 | 12 (7.4%) | 41 (14.0%) |
| $75,000 to $99,999 | 51 (31.7%) | 0 (0.0%) |
| $100,000 to $149,999 | 13 (8.1%) | 0 (0.0%) |
| $150,000 or more | 0 (0.0%) | 25 (8.5%) |
| Total | 161 (100.0%) | 293 (100.0%) |
Monthly Housing Cost Tiers in Lower Lake
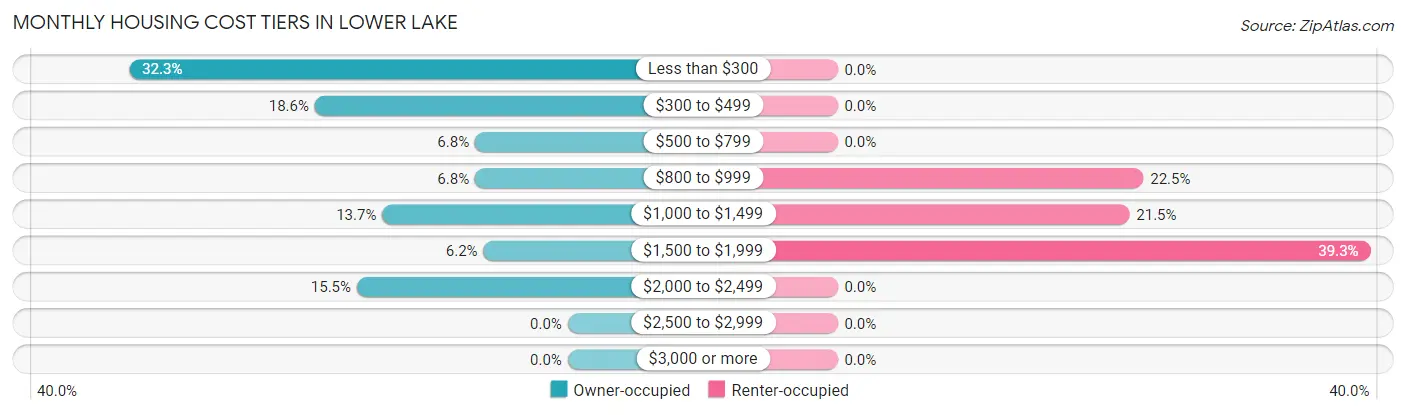
| Monthly Cost | Owner-occupied | Renter-occupied |
| Less than $300 | 52 (32.3%) | 0 (0.0%) |
| $300 to $499 | 30 (18.6%) | 0 (0.0%) |
| $500 to $799 | 11 (6.8%) | 0 (0.0%) |
| $800 to $999 | 11 (6.8%) | 66 (22.5%) |
| $1,000 to $1,499 | 22 (13.7%) | 63 (21.5%) |
| $1,500 to $1,999 | 10 (6.2%) | 115 (39.3%) |
| $2,000 to $2,499 | 25 (15.5%) | 0 (0.0%) |
| $2,500 to $2,999 | 0 (0.0%) | 0 (0.0%) |
| $3,000 or more | 0 (0.0%) | 0 (0.0%) |
| Total | 161 (100.0%) | 293 (100.0%) |
Physical Housing Characteristics in Lower Lake
Housing Structures in Lower Lake
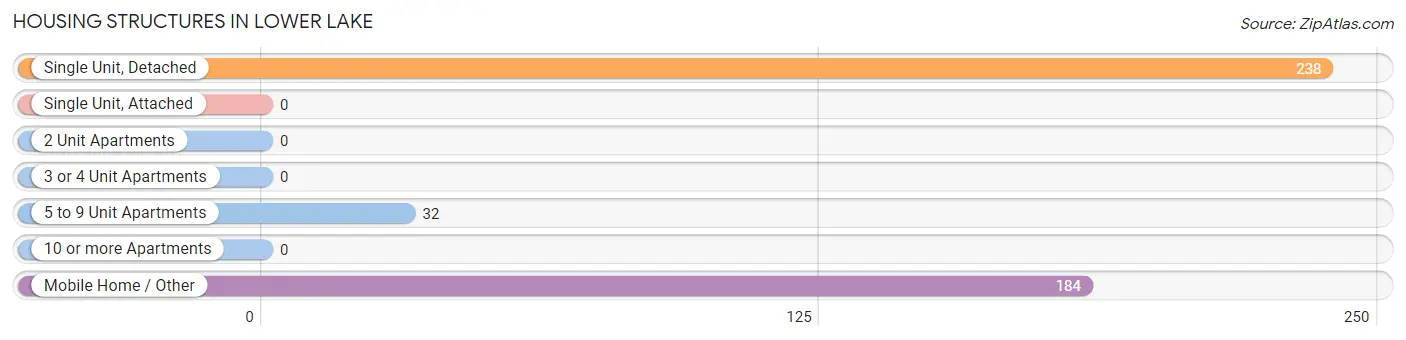
| Structure Type | # Housing Units | % Housing Units |
| Single Unit, Detached | 238 | 52.4% |
| Single Unit, Attached | 0 | 0.0% |
| 2 Unit Apartments | 0 | 0.0% |
| 3 or 4 Unit Apartments | 0 | 0.0% |
| 5 to 9 Unit Apartments | 32 | 7.0% |
| 10 or more Apartments | 0 | 0.0% |
| Mobile Home / Other | 184 | 40.5% |
| Total | 454 | 100.0% |
Housing Structures by Occupancy in Lower Lake
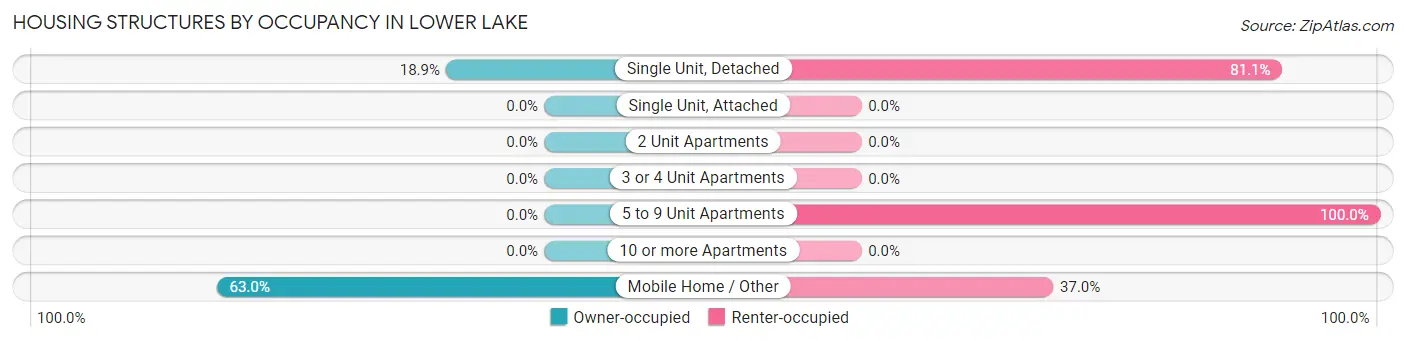
| Structure Type | Owner-occupied | Renter-occupied |
| Single Unit, Detached | 45 (18.9%) | 193 (81.1%) |
| Single Unit, Attached | 0 (0.0%) | 0 (0.0%) |
| 2 Unit Apartments | 0 (0.0%) | 0 (0.0%) |
| 3 or 4 Unit Apartments | 0 (0.0%) | 0 (0.0%) |
| 5 to 9 Unit Apartments | 0 (0.0%) | 32 (100.0%) |
| 10 or more Apartments | 0 (0.0%) | 0 (0.0%) |
| Mobile Home / Other | 116 (63.0%) | 68 (37.0%) |
| Total | 161 (35.5%) | 293 (64.5%) |
Housing Structures by Number of Rooms in Lower Lake
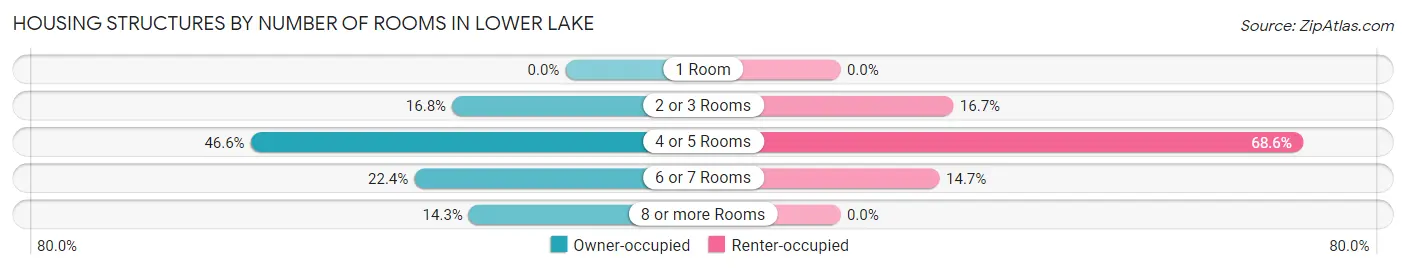
| Number of Rooms | Owner-occupied | Renter-occupied |
| 1 Room | 0 (0.0%) | 0 (0.0%) |
| 2 or 3 Rooms | 27 (16.8%) | 49 (16.7%) |
| 4 or 5 Rooms | 75 (46.6%) | 201 (68.6%) |
| 6 or 7 Rooms | 36 (22.4%) | 43 (14.7%) |
| 8 or more Rooms | 23 (14.3%) | 0 (0.0%) |
| Total | 161 (100.0%) | 293 (100.0%) |
Housing Structure by Heating Type in Lower Lake
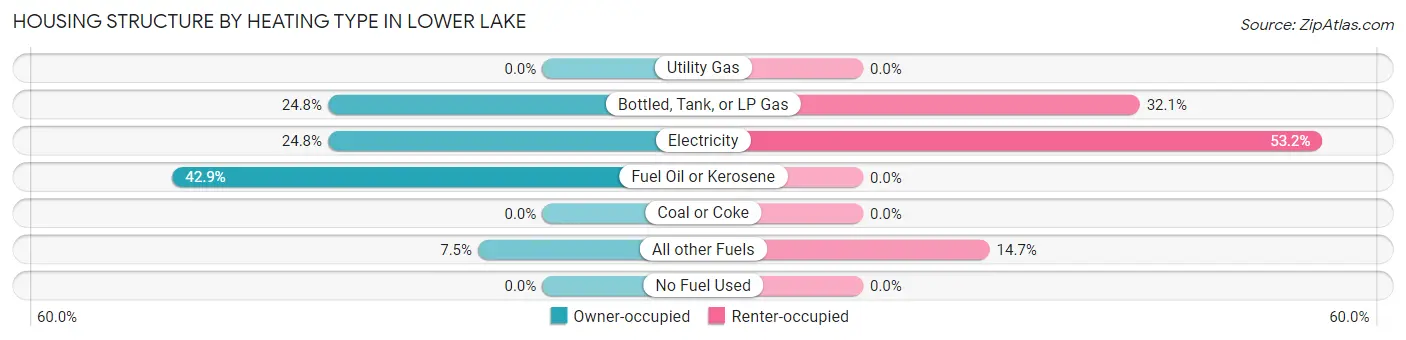
| Heating Type | Owner-occupied | Renter-occupied |
| Utility Gas | 0 (0.0%) | 0 (0.0%) |
| Bottled, Tank, or LP Gas | 40 (24.8%) | 94 (32.1%) |
| Electricity | 40 (24.8%) | 156 (53.2%) |
| Fuel Oil or Kerosene | 69 (42.9%) | 0 (0.0%) |
| Coal or Coke | 0 (0.0%) | 0 (0.0%) |
| All other Fuels | 12 (7.4%) | 43 (14.7%) |
| No Fuel Used | 0 (0.0%) | 0 (0.0%) |
| Total | 161 (100.0%) | 293 (100.0%) |
Household Vehicle Usage in Lower Lake
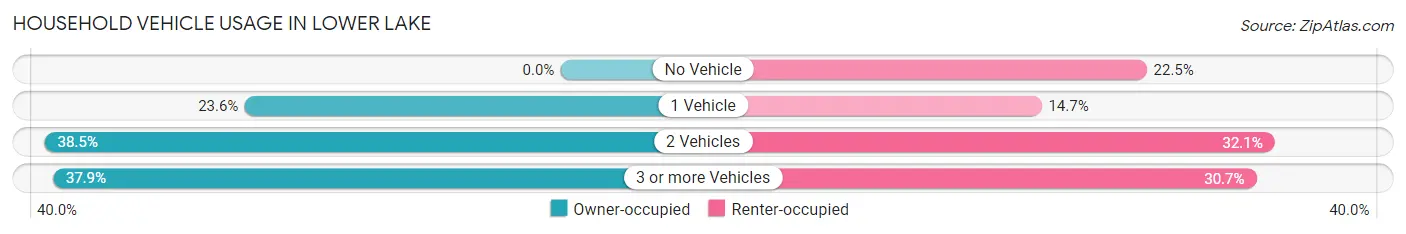
| Vehicles per Household | Owner-occupied | Renter-occupied |
| No Vehicle | 0 (0.0%) | 66 (22.5%) |
| 1 Vehicle | 38 (23.6%) | 43 (14.7%) |
| 2 Vehicles | 62 (38.5%) | 94 (32.1%) |
| 3 or more Vehicles | 61 (37.9%) | 90 (30.7%) |
| Total | 161 (100.0%) | 293 (100.0%) |
Real Estate & Mortgages in Lower Lake
Real Estate and Mortgage Overview in Lower Lake
| Characteristic | Without Mortgage | With Mortgage |
| Housing Units | 104 | 57 |
| Median Property Value | - | - |
| Median Household Income | - | - |
| Monthly Housing Costs | $350 | $0 |
| Real Estate Taxes | $1,433 | $0 |
Property Value by Mortgage Status in Lower Lake
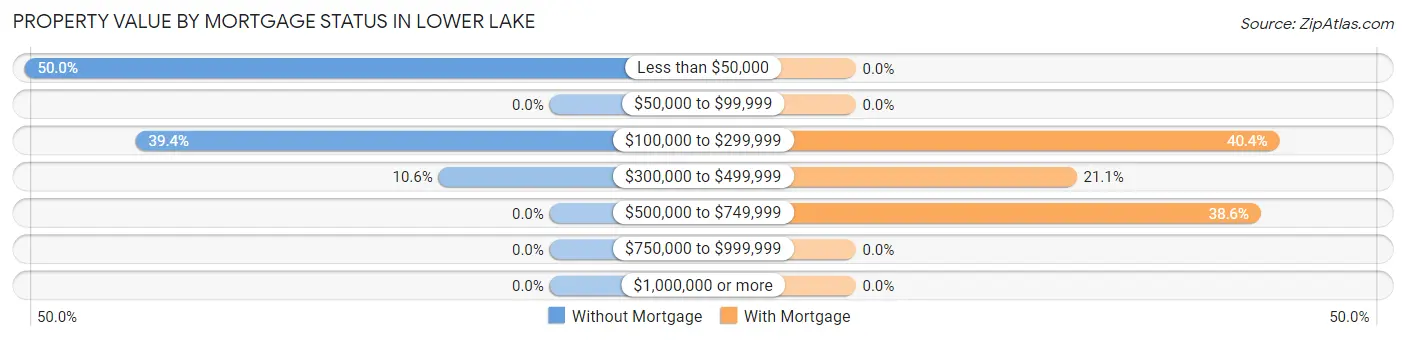
| Property Value | Without Mortgage | With Mortgage |
| Less than $50,000 | 52 (50.0%) | 0 (0.0%) |
| $50,000 to $99,999 | 0 (0.0%) | 0 (0.0%) |
| $100,000 to $299,999 | 41 (39.4%) | 23 (40.4%) |
| $300,000 to $499,999 | 11 (10.6%) | 12 (21.0%) |
| $500,000 to $749,999 | 0 (0.0%) | 22 (38.6%) |
| $750,000 to $999,999 | 0 (0.0%) | 0 (0.0%) |
| $1,000,000 or more | 0 (0.0%) | 0 (0.0%) |
| Total | 104 (100.0%) | 57 (100.0%) |
Household Income by Mortgage Status in Lower Lake
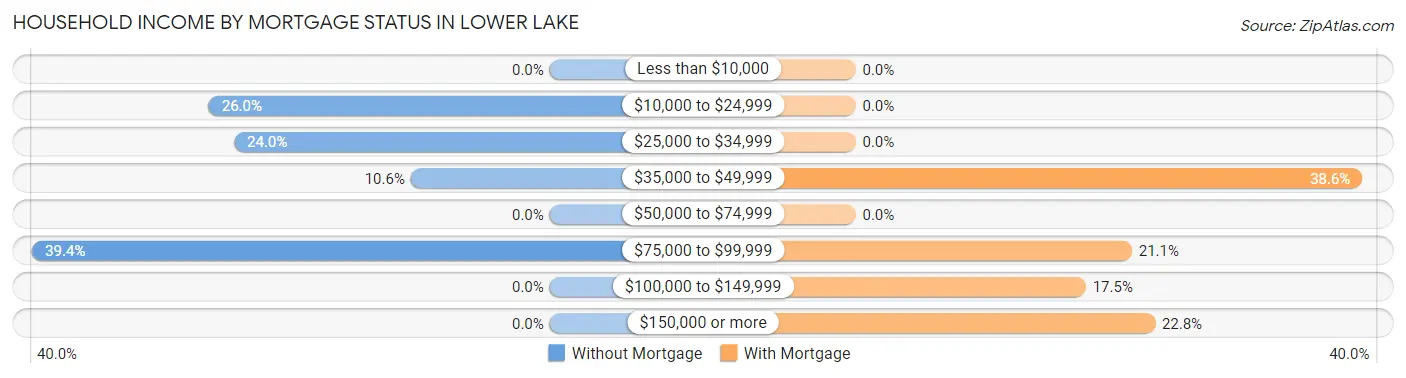
| Household Income | Without Mortgage | With Mortgage |
| Less than $10,000 | 0 (0.0%) | 0 (0.0%) |
| $10,000 to $24,999 | 27 (26.0%) | 0 (0.0%) |
| $25,000 to $34,999 | 25 (24.0%) | 0 (0.0%) |
| $35,000 to $49,999 | 11 (10.6%) | 22 (38.6%) |
| $50,000 to $74,999 | 0 (0.0%) | 0 (0.0%) |
| $75,000 to $99,999 | 41 (39.4%) | 12 (21.0%) |
| $100,000 to $149,999 | 0 (0.0%) | 10 (17.5%) |
| $150,000 or more | 0 (0.0%) | 13 (22.8%) |
| Total | 104 (100.0%) | 57 (100.0%) |
Property Value to Household Income Ratio in Lower Lake
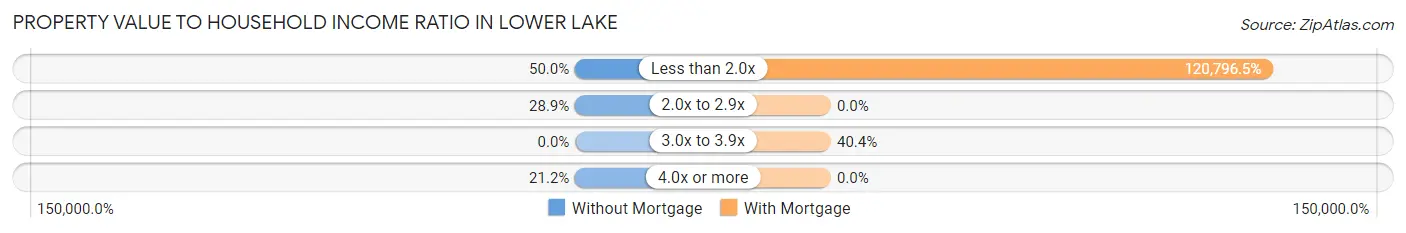
| Value-to-Income Ratio | Without Mortgage | With Mortgage |
| Less than 2.0x | 52 (50.0%) | 68,854 (120,796.5%) |
| 2.0x to 2.9x | 30 (28.8%) | 0 (0.0%) |
| 3.0x to 3.9x | 0 (0.0%) | 23 (40.4%) |
| 4.0x or more | 22 (21.1%) | 0 (0.0%) |
| Total | 104 (100.0%) | 57 (100.0%) |
Real Estate Taxes by Mortgage Status in Lower Lake
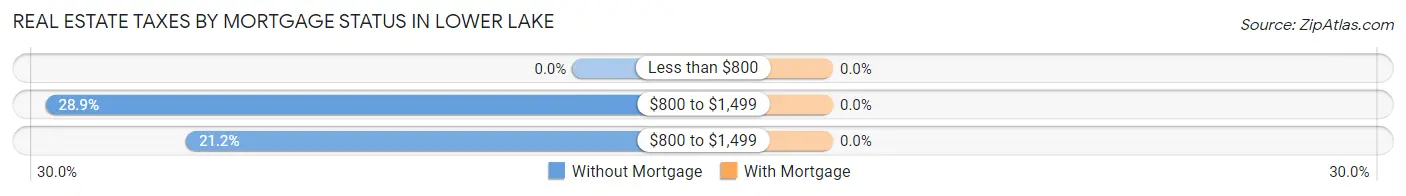
| Property Taxes | Without Mortgage | With Mortgage |
| Less than $800 | 0 (0.0%) | 0 (0.0%) |
| $800 to $1,499 | 30 (28.8%) | 0 (0.0%) |
| $800 to $1,499 | 22 (21.1%) | 0 (0.0%) |
| Total | 104 (100.0%) | 57 (100.0%) |
Health & Disability in Lower Lake
Health Insurance Coverage by Age in Lower Lake
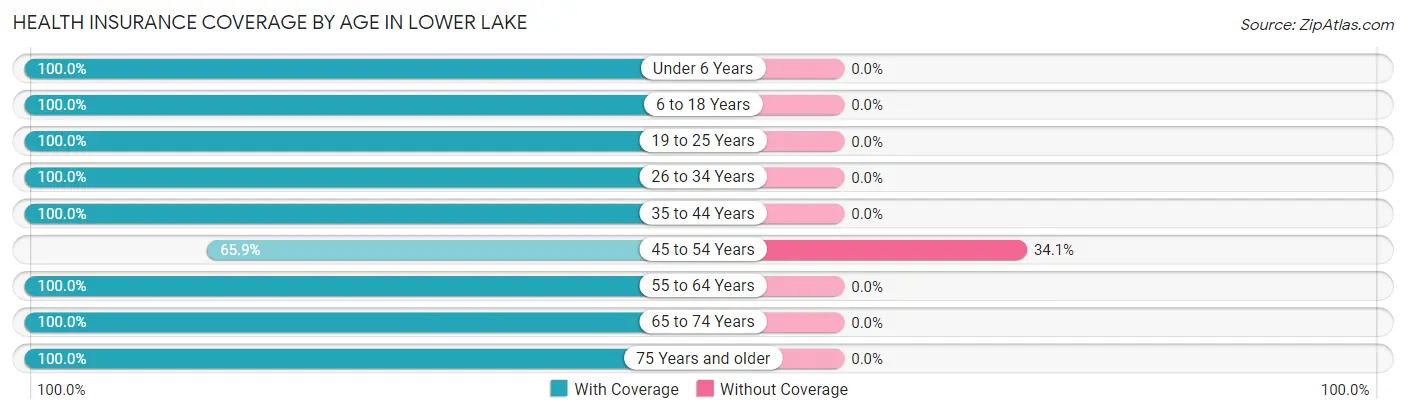
| Age Bracket | With Coverage | Without Coverage |
| Under 6 Years | 105 (100.0%) | 0 (0.0%) |
| 6 to 18 Years | 430 (100.0%) | 0 (0.0%) |
| 19 to 25 Years | 1 (100.0%) | 0 (0.0%) |
| 26 to 34 Years | 147 (100.0%) | 0 (0.0%) |
| 35 to 44 Years | 101 (100.0%) | 0 (0.0%) |
| 45 to 54 Years | 91 (65.9%) | 47 (34.1%) |
| 55 to 64 Years | 188 (100.0%) | 0 (0.0%) |
| 65 to 74 Years | 75 (100.0%) | 0 (0.0%) |
| 75 Years and older | 140 (100.0%) | 0 (0.0%) |
| Total | 1,278 (96.5%) | 47 (3.5%) |
Health Insurance Coverage by Citizenship Status in Lower Lake
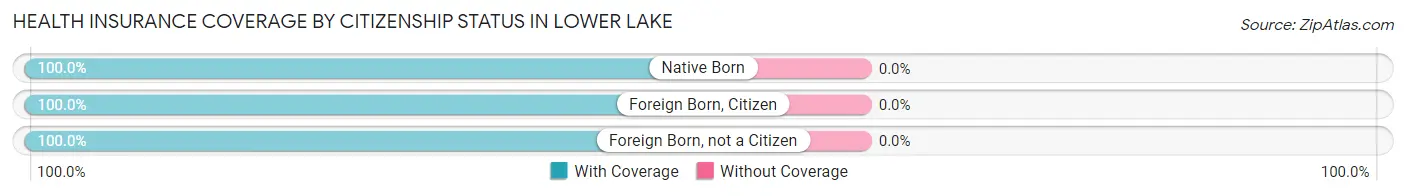
| Citizenship Status | With Coverage | Without Coverage |
| Native Born | 105 (100.0%) | 0 (0.0%) |
| Foreign Born, Citizen | 430 (100.0%) | 0 (0.0%) |
| Foreign Born, not a Citizen | 1 (100.0%) | 0 (0.0%) |
Health Insurance Coverage by Household Income in Lower Lake
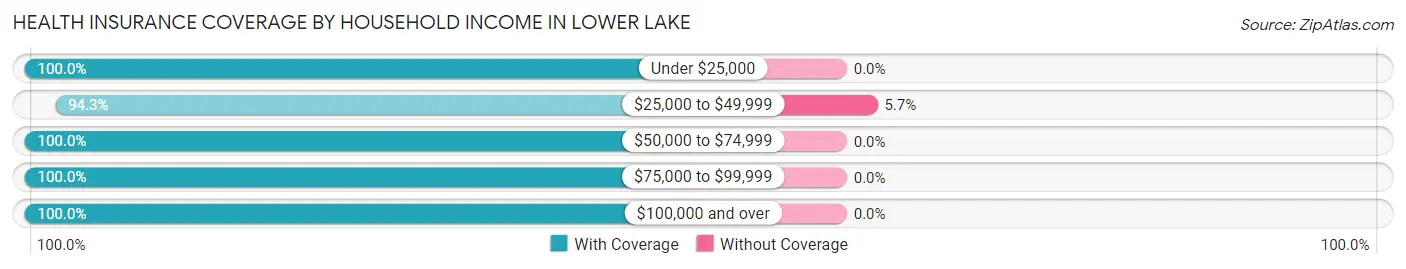
| Household Income | With Coverage | Without Coverage |
| Under $25,000 | 147 (100.0%) | 0 (0.0%) |
| $25,000 to $49,999 | 772 (94.3%) | 47 (5.7%) |
| $50,000 to $74,999 | 104 (100.0%) | 0 (0.0%) |
| $75,000 to $99,999 | 106 (100.0%) | 0 (0.0%) |
| $100,000 and over | 146 (100.0%) | 0 (0.0%) |
Public vs Private Health Insurance Coverage by Age in Lower Lake
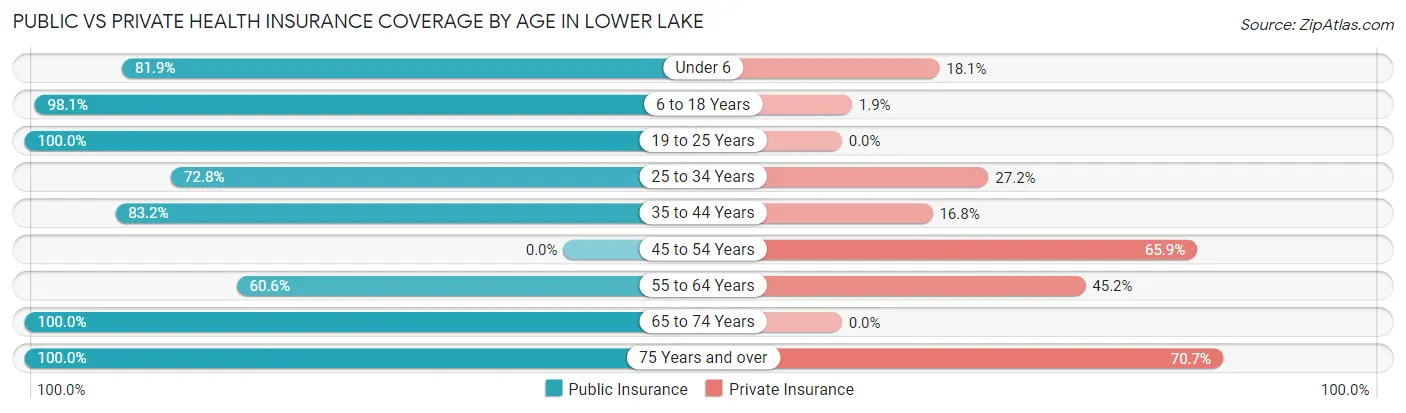
| Age Bracket | Public Insurance | Private Insurance |
| Under 6 | 86 (81.9%) | 19 (18.1%) |
| 6 to 18 Years | 422 (98.1%) | 8 (1.9%) |
| 19 to 25 Years | 1 (100.0%) | 0 (0.0%) |
| 25 to 34 Years | 107 (72.8%) | 40 (27.2%) |
| 35 to 44 Years | 84 (83.2%) | 17 (16.8%) |
| 45 to 54 Years | 0 (0.0%) | 91 (65.9%) |
| 55 to 64 Years | 114 (60.6%) | 85 (45.2%) |
| 65 to 74 Years | 75 (100.0%) | 0 (0.0%) |
| 75 Years and over | 140 (100.0%) | 99 (70.7%) |
| Total | 1,029 (77.7%) | 359 (27.1%) |
Disability Status by Sex by Age in Lower Lake
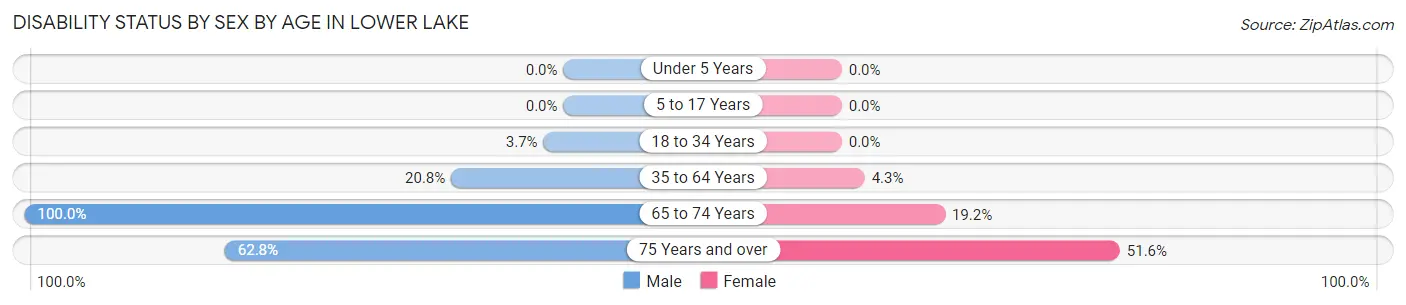
| Age Bracket | Male | Female |
| Under 5 Years | 0 (0.0%) | 0 (0.0%) |
| 5 to 17 Years | 0 (0.0%) | 0 (0.0%) |
| 18 to 34 Years | 1 (3.7%) | 0 (0.0%) |
| 35 to 64 Years | 35 (20.8%) | 11 (4.3%) |
| 65 to 74 Years | 28 (100.0%) | 9 (19.2%) |
| 75 Years and over | 49 (62.8%) | 32 (51.6%) |
Disability Class by Sex by Age in Lower Lake
Disability Class: Hearing Difficulty
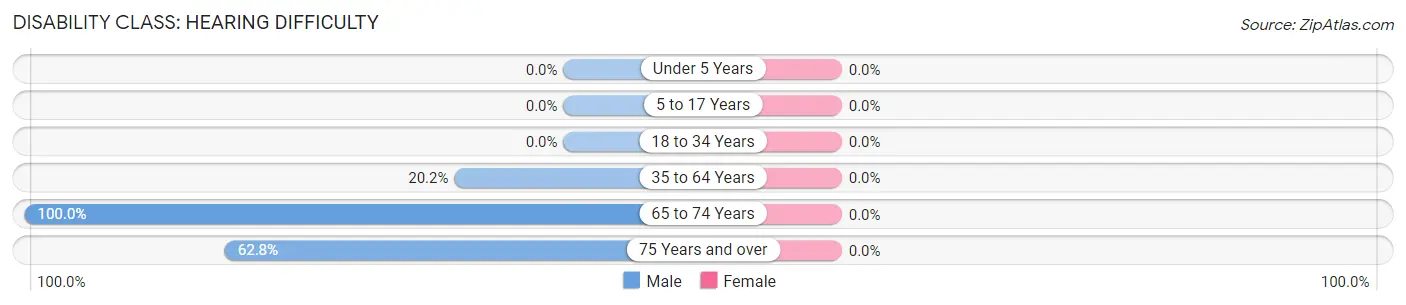
| Age Bracket | Male | Female |
| Under 5 Years | 0 (0.0%) | 0 (0.0%) |
| 5 to 17 Years | 0 (0.0%) | 0 (0.0%) |
| 18 to 34 Years | 0 (0.0%) | 0 (0.0%) |
| 35 to 64 Years | 34 (20.2%) | 0 (0.0%) |
| 65 to 74 Years | 28 (100.0%) | 0 (0.0%) |
| 75 Years and over | 49 (62.8%) | 0 (0.0%) |
Disability Class: Vision Difficulty
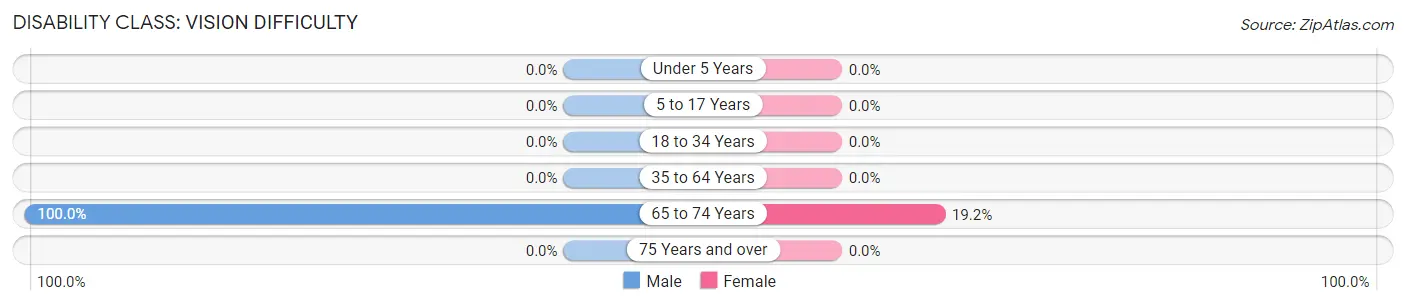
| Age Bracket | Male | Female |
| Under 5 Years | 0 (0.0%) | 0 (0.0%) |
| 5 to 17 Years | 0 (0.0%) | 0 (0.0%) |
| 18 to 34 Years | 0 (0.0%) | 0 (0.0%) |
| 35 to 64 Years | 0 (0.0%) | 0 (0.0%) |
| 65 to 74 Years | 28 (100.0%) | 9 (19.2%) |
| 75 Years and over | 0 (0.0%) | 0 (0.0%) |
Disability Class: Cognitive Difficulty
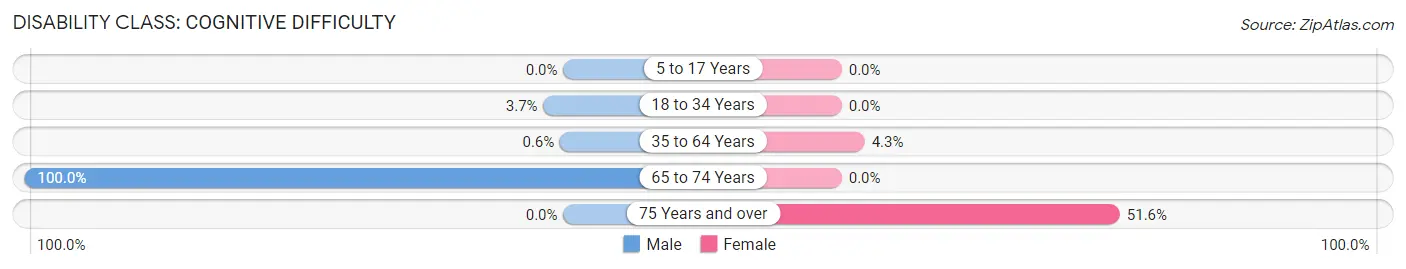
| Age Bracket | Male | Female |
| 5 to 17 Years | 0 (0.0%) | 0 (0.0%) |
| 18 to 34 Years | 1 (3.7%) | 0 (0.0%) |
| 35 to 64 Years | 1 (0.6%) | 11 (4.3%) |
| 65 to 74 Years | 28 (100.0%) | 0 (0.0%) |
| 75 Years and over | 0 (0.0%) | 32 (51.6%) |
Disability Class: Ambulatory Difficulty
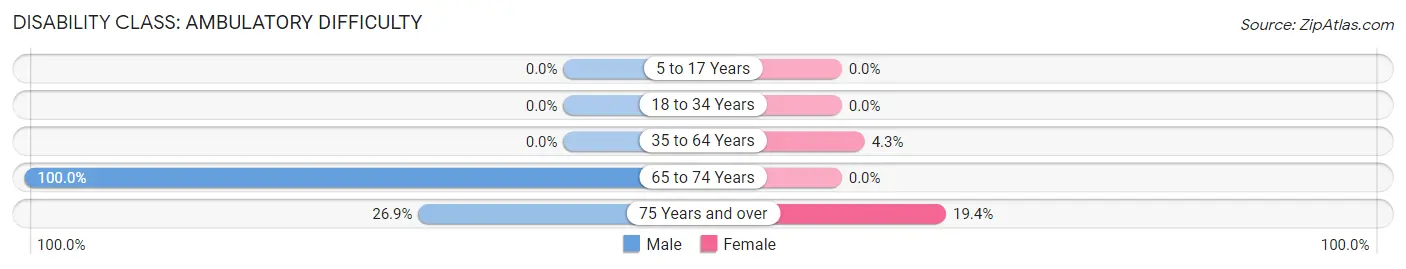
| Age Bracket | Male | Female |
| 5 to 17 Years | 0 (0.0%) | 0 (0.0%) |
| 18 to 34 Years | 0 (0.0%) | 0 (0.0%) |
| 35 to 64 Years | 0 (0.0%) | 11 (4.3%) |
| 65 to 74 Years | 28 (100.0%) | 0 (0.0%) |
| 75 Years and over | 21 (26.9%) | 12 (19.4%) |
Disability Class: Self-Care Difficulty
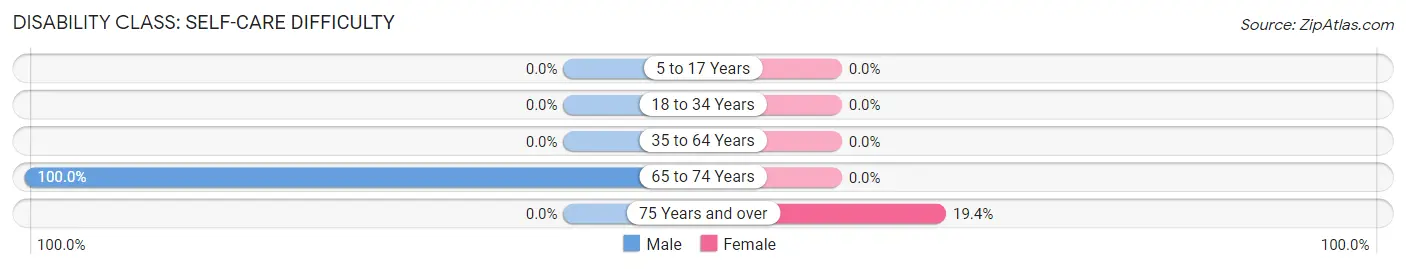
| Age Bracket | Male | Female |
| 5 to 17 Years | 0 (0.0%) | 0 (0.0%) |
| 18 to 34 Years | 0 (0.0%) | 0 (0.0%) |
| 35 to 64 Years | 0 (0.0%) | 0 (0.0%) |
| 65 to 74 Years | 28 (100.0%) | 0 (0.0%) |
| 75 Years and over | 0 (0.0%) | 12 (19.4%) |
Technology Access in Lower Lake
Computing Device Access in Lower Lake
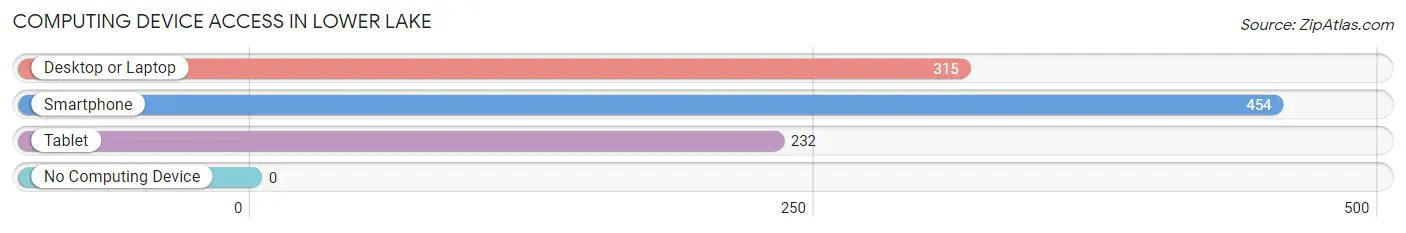
| Device Type | # Households | % Households |
| Desktop or Laptop | 315 | 69.4% |
| Smartphone | 454 | 100.0% |
| Tablet | 232 | 51.1% |
| No Computing Device | 0 | 0.0% |
| Total | 454 | 100.0% |
Internet Access in Lower Lake
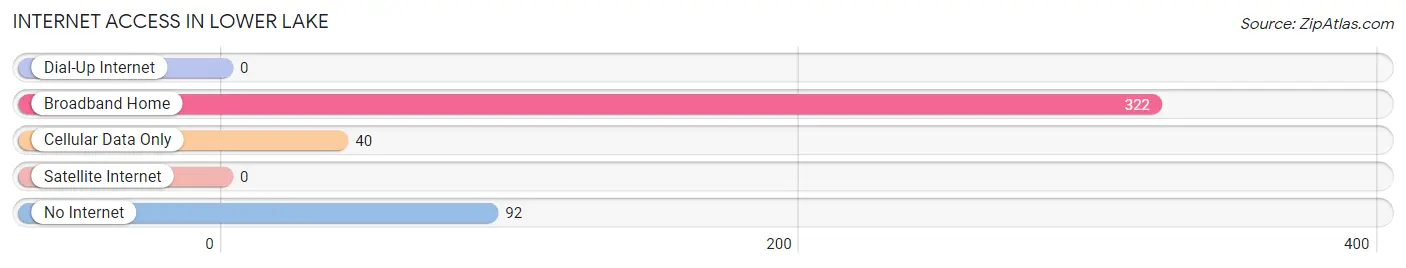
| Internet Type | # Households | % Households |
| Dial-Up Internet | 0 | 0.0% |
| Broadband Home | 322 | 70.9% |
| Cellular Data Only | 40 | 8.8% |
| Satellite Internet | 0 | 0.0% |
| No Internet | 92 | 20.3% |
| Total | 454 | 100.0% |
Lower Lake Summary
Lake County is located in the northern part of California, and is bordered by Napa, Sonoma, Mendocino, and Colusa counties. The county seat is Lakeport, and the largest city is Clearlake. The county is home to two incorporated cities, Clearlake and Lakeport, as well as numerous unincorporated communities.
History
The area that is now Lake County was originally inhabited by the Pomo people, who lived in the area for thousands of years. The first Europeans to explore the area were Spanish explorers in the late 1700s. In 1836, the Mexican government granted Rancho Soscol to William A. Richardson, who established a trading post in the area.
In 1850, the area became part of the newly formed California state. The county was officially established in 1861, and was named after Clear Lake, the largest natural lake in California.
Geography
Lake County covers an area of 1,329 square miles, making it the fourth-largest county in California. The county is located in the northern part of the state, and is bordered by Napa, Sonoma, Mendocino, and Colusa counties. The county is home to two incorporated cities, Clearlake and Lakeport, as well as numerous unincorporated communities.
The terrain of the county is mostly mountainous, with the highest point being Mount Konocti at 4,299 feet. The county is home to Clear Lake, the largest natural lake in California, as well as numerous other lakes and reservoirs.
Economy
The economy of Lake County is largely based on agriculture, with the main crops being grapes, walnuts, and pears. The county is also home to numerous wineries and vineyards, as well as a thriving tourism industry.
Demographics
As of the 2010 census, the population of Lake County was 64,665. The racial makeup of the county was 68.3% White, 0.7% African American, 3.2% Native American, 0.7% Asian, 0.1% Pacific Islander, 22.2% from other races, and 4.9% from two or more races. Hispanic or Latino of any race were 33.2% of the population.
The median household income in the county was $41,845, and the median family income was $48,945. The per capita income was $20,945. About 17.2% of the population was below the poverty line.
Common Questions
What is Per Capita Income in Lower Lake?
Per Capita income in Lower Lake is $15,644.
What is the Median Family Income in Lower Lake?
Median Family Income in Lower Lake is $38,836.
What is the Median Household income in Lower Lake?
Median Household Income in Lower Lake is $35,930.
What is Inequality or Gini Index in Lower Lake?
Inequality or Gini Index in Lower Lake is 0.50.
What is the Total Population of Lower Lake?
Total Population of Lower Lake is 1,326.
What is the Total Male Population of Lower Lake?
Total Male Population of Lower Lake is 458.
What is the Total Female Population of Lower Lake?
Total Female Population of Lower Lake is 868.
What is the Ratio of Males per 100 Females in Lower Lake?
There are 52.76 Males per 100 Females in Lower Lake.
What is the Ratio of Females per 100 Males in Lower Lake?
There are 189.52 Females per 100 Males in Lower Lake.
What is the Median Population Age in Lower Lake?
Median Population Age in Lower Lake is 34.7 Years.
What is the Average Family Size in Lower Lake
Average Family Size in Lower Lake is 4.0 People.
What is the Average Household Size in Lower Lake
Average Household Size in Lower Lake is 2.9 People.
How Large is the Labor Force in Lower Lake?
There are 499 People in the Labor Forcein in Lower Lake.
What is the Percentage of People in the Labor Force in Lower Lake?
55.6% of People are in the Labor Force in Lower Lake.
What is the Unemployment Rate in Lower Lake?
Unemployment Rate in Lower Lake is 2.4%.