Cities with the Highest Poverty Level Among Seniors Over the Age of 75 in California
RELATED REPORTS & OPTIONS
Highest Poverty | Seniors 75+
California
Compare Cities
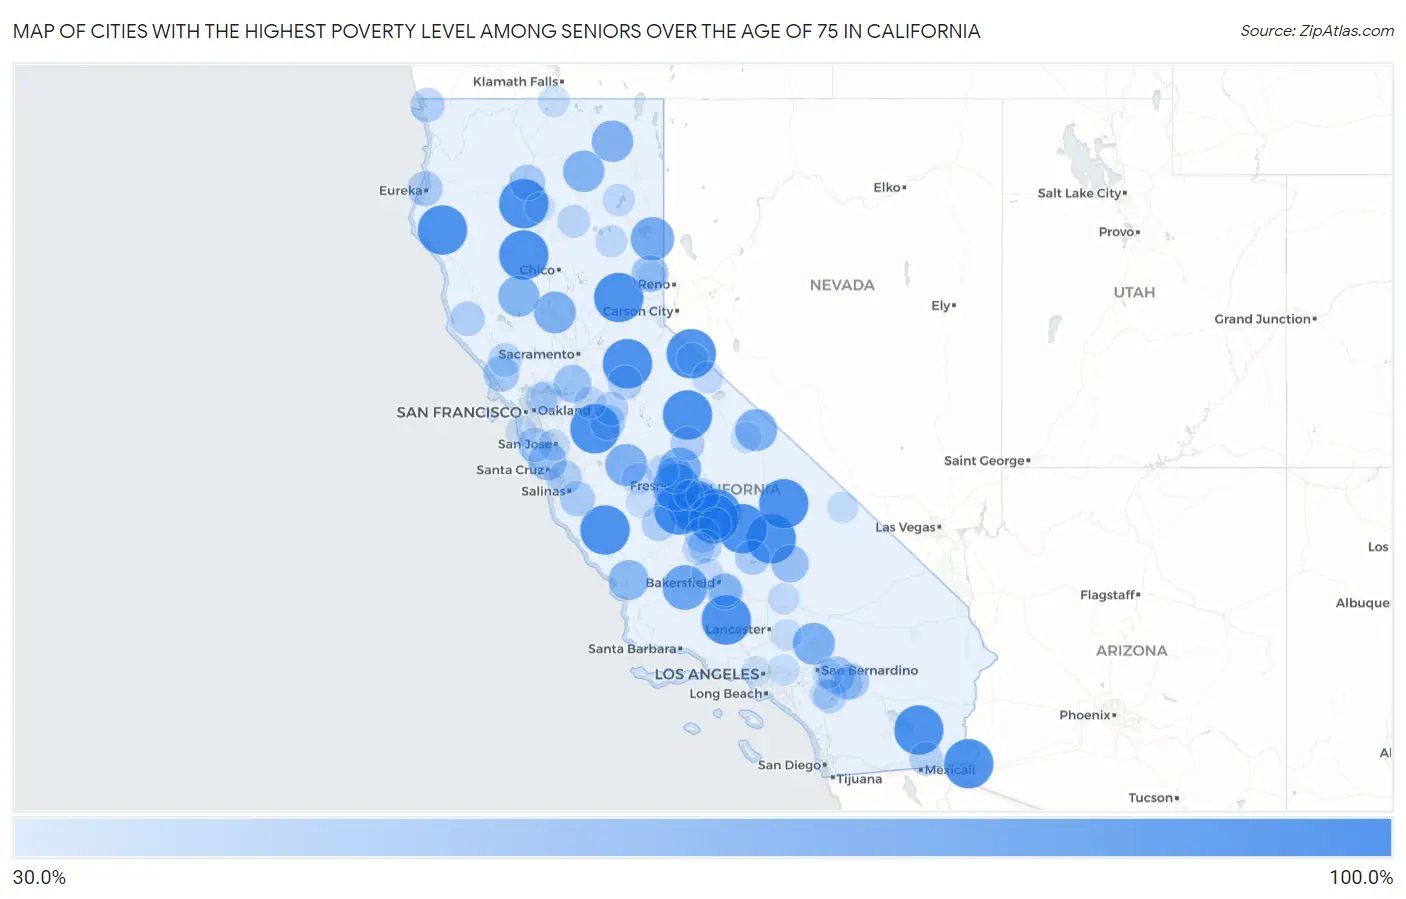
Map of Cities with the Highest Poverty Level Among Seniors Over the Age of 75 in California
0.0%
100.0%
Cities with the Highest Poverty Level Among Seniors Over the Age of 75 in California
| City | Senior Poverty | vs State | vs National | |
| 1. | London | 100.0% | 12.3%(+87.7)#1 | 11.1%(+88.9)#10 |
| 2. | Yosemite Valley | 100.0% | 12.3%(+87.7)#2 | 11.1%(+88.9)#12 |
| 3. | Stebbins | 100.0% | 12.3%(+87.7)#3 | 11.1%(+88.9)#34 |
| 4. | Lebec | 100.0% | 12.3%(+87.7)#4 | 11.1%(+88.9)#38 |
| 5. | Niland | 100.0% | 12.3%(+87.7)#5 | 11.1%(+88.9)#63 |
| 6. | Westley | 100.0% | 12.3%(+87.7)#6 | 11.1%(+88.9)#64 |
| 7. | Traver | 100.0% | 12.3%(+87.7)#7 | 11.1%(+88.9)#89 |
| 8. | Coleville | 100.0% | 12.3%(+87.7)#8 | 11.1%(+88.9)#96 |
| 9. | San Lucas | 100.0% | 12.3%(+87.7)#9 | 11.1%(+88.9)#103 |
| 10. | Lindcove | 100.0% | 12.3%(+87.7)#10 | 11.1%(+88.9)#156 |
| 11. | Myers Flat | 100.0% | 12.3%(+87.7)#11 | 11.1%(+88.9)#172 |
| 12. | Hardwick | 100.0% | 12.3%(+87.7)#12 | 11.1%(+88.9)#204 |
| 13. | La Grange | 100.0% | 12.3%(+87.7)#13 | 11.1%(+88.9)#215 |
| 14. | Keswick | 100.0% | 12.3%(+87.7)#14 | 11.1%(+88.9)#218 |
| 15. | Washington | 100.0% | 12.3%(+87.7)#15 | 11.1%(+88.9)#233 |
| 16. | Flournoy | 100.0% | 12.3%(+87.7)#16 | 11.1%(+88.9)#255 |
| 17. | Kennedy Meadows | 100.0% | 12.3%(+87.7)#17 | 11.1%(+88.9)#257 |
| 18. | Camp Nelson | 100.0% | 12.3%(+87.7)#18 | 11.1%(+88.9)#285 |
| 19. | Knights Ferry | 100.0% | 12.3%(+87.7)#19 | 11.1%(+88.9)#288 |
| 20. | Strawberry Cdp Tuolumne County | 100.0% | 12.3%(+87.7)#20 | 11.1%(+88.9)#296 |
| 21. | Volcano | 100.0% | 12.3%(+87.7)#21 | 11.1%(+88.9)#303 |
| 22. | Winterhaven | 100.0% | 12.3%(+87.7)#22 | 11.1%(+88.9)#318 |
| 23. | Tooleville | 100.0% | 12.3%(+87.7)#23 | 11.1%(+88.9)#319 |
| 24. | Glennville | 100.0% | 12.3%(+87.7)#24 | 11.1%(+88.9)#361 |
| 25. | Keeler | 100.0% | 12.3%(+87.7)#25 | 11.1%(+88.9)#368 |
| 26. | Calwa | 91.5% | 12.3%(+79.2)#26 | 11.1%(+80.5)#415 |
| 27. | Mckittrick | 83.3% | 12.3%(+71.0)#27 | 11.1%(+72.3)#464 |
| 28. | Patton Village | 78.9% | 12.3%(+66.6)#28 | 11.1%(+67.8)#506 |
| 29. | Jones Valley | 78.6% | 12.3%(+66.3)#29 | 11.1%(+67.5)#508 |
| 30. | Friant | 75.0% | 12.3%(+62.7)#30 | 11.1%(+63.9)#556 |
| 31. | Mountain View Acres | 74.0% | 12.3%(+61.7)#31 | 11.1%(+62.9)#579 |
| 32. | Chalfant | 73.3% | 12.3%(+61.0)#32 | 11.1%(+62.3)#584 |
| 33. | Dos Palos Y | 73.3% | 12.3%(+61.0)#33 | 11.1%(+62.3)#586 |
| 34. | Meridian | 72.7% | 12.3%(+60.4)#34 | 11.1%(+61.7)#592 |
| 35. | Canby | 72.0% | 12.3%(+59.7)#35 | 11.1%(+61.0)#599 |
| 36. | Mcarthur | 71.4% | 12.3%(+59.1)#36 | 11.1%(+60.4)#606 |
| 37. | Stonyford | 70.0% | 12.3%(+57.7)#37 | 11.1%(+58.9)#624 |
| 38. | Garden Farms | 66.7% | 12.3%(+54.4)#38 | 11.1%(+55.6)#675 |
| 39. | Zayante | 61.0% | 12.3%(+48.7)#39 | 11.1%(+49.9)#821 |
| 40. | Castella | 59.0% | 12.3%(+46.7)#40 | 11.1%(+47.9)#887 |
| 41. | China Lake Acres | 58.6% | 12.3%(+46.3)#41 | 11.1%(+47.5)#893 |
| 42. | Isleton | 57.9% | 12.3%(+45.6)#42 | 11.1%(+46.8)#922 |
| 43. | Oak Glen | 56.8% | 12.3%(+44.5)#43 | 11.1%(+45.7)#960 |
| 44. | Loyalton | 56.4% | 12.3%(+44.1)#44 | 11.1%(+45.3)#972 |
| 45. | Rolling Hills | 54.8% | 12.3%(+42.4)#45 | 11.1%(+43.7)#1,034 |
| 46. | Weedpatch | 54.4% | 12.3%(+42.1)#46 | 11.1%(+43.4)#1,049 |
| 47. | Bloomfield | 52.9% | 12.3%(+40.6)#47 | 11.1%(+41.9)#1,100 |
| 48. | Whitewater | 52.4% | 12.3%(+40.1)#48 | 11.1%(+41.3)#1,110 |
| 49. | Lakehead | 51.6% | 12.3%(+39.3)#49 | 11.1%(+40.6)#1,131 |
| 50. | Tipton | 50.0% | 12.3%(+37.7)#50 | 11.1%(+38.9)#1,182 |
| 51. | Airport | 50.0% | 12.3%(+37.7)#51 | 11.1%(+38.9)#1,186 |
| 52. | Chualar | 50.0% | 12.3%(+37.7)#52 | 11.1%(+38.9)#1,189 |
| 53. | Samoa | 50.0% | 12.3%(+37.7)#53 | 11.1%(+38.9)#1,237 |
| 54. | Kernville | 49.2% | 12.3%(+36.9)#54 | 11.1%(+38.1)#1,326 |
| 55. | Huron | 48.0% | 12.3%(+35.7)#55 | 11.1%(+36.9)#1,373 |
| 56. | La Honda | 47.8% | 12.3%(+35.4)#56 | 11.1%(+36.7)#1,392 |
| 57. | Philo | 47.6% | 12.3%(+35.3)#57 | 11.1%(+36.6)#1,399 |
| 58. | San Andreas | 46.8% | 12.3%(+34.5)#58 | 11.1%(+35.7)#1,446 |
| 59. | Smith River | 46.8% | 12.3%(+34.5)#59 | 11.1%(+35.7)#1,447 |
| 60. | Las Lomas | 46.4% | 12.3%(+34.1)#60 | 11.1%(+35.3)#1,476 |
| 61. | Bass Lake | 46.3% | 12.3%(+34.0)#61 | 11.1%(+35.2)#1,480 |
| 62. | Valley Home | 45.8% | 12.3%(+33.5)#62 | 11.1%(+34.8)#1,507 |
| 63. | Fulton | 45.5% | 12.3%(+33.2)#63 | 11.1%(+34.5)#1,519 |
| 64. | Green Acres | 45.4% | 12.3%(+33.1)#64 | 11.1%(+34.3)#1,539 |
| 65. | Holtville | 44.8% | 12.3%(+32.4)#65 | 11.1%(+33.7)#1,567 |
| 66. | Earlimart | 43.8% | 12.3%(+31.5)#66 | 11.1%(+32.8)#1,614 |
| 67. | Orange Cove | 43.4% | 12.3%(+31.1)#67 | 11.1%(+32.4)#1,652 |
| 68. | Wautec | 42.9% | 12.3%(+30.5)#68 | 11.1%(+31.8)#1,717 |
| 69. | Cabazon | 42.4% | 12.3%(+30.1)#69 | 11.1%(+31.3)#1,734 |
| 70. | Mineral | 42.1% | 12.3%(+29.8)#70 | 11.1%(+31.0)#1,757 |
| 71. | Lindsay | 42.1% | 12.3%(+29.8)#71 | 11.1%(+31.0)#1,758 |
| 72. | Alhambra Valley | 40.8% | 12.3%(+28.5)#72 | 11.1%(+29.7)#1,849 |
| 73. | Taft Mosswood | 40.7% | 12.3%(+28.4)#73 | 11.1%(+29.6)#1,857 |
| 74. | Parksdale | 40.4% | 12.3%(+28.1)#74 | 11.1%(+29.3)#1,875 |
| 75. | Spaulding | 40.3% | 12.3%(+28.0)#75 | 11.1%(+29.2)#1,882 |
| 76. | Lamont | 40.3% | 12.3%(+28.0)#76 | 11.1%(+29.2)#1,884 |
| 77. | Allensworth | 40.0% | 12.3%(+27.7)#77 | 11.1%(+28.9)#1,910 |
| 78. | Crescent Mills | 39.4% | 12.3%(+27.1)#78 | 11.1%(+28.3)#1,997 |
| 79. | University Of California-Santa Barbara | 39.1% | 12.3%(+26.8)#79 | 11.1%(+28.1)#2,009 |
| 80. | Walker | 38.9% | 12.3%(+26.6)#80 | 11.1%(+27.8)#2,035 |
| 81. | Fruitdale | 38.8% | 12.3%(+26.5)#81 | 11.1%(+27.7)#2,044 |
| 82. | Shafter | 38.8% | 12.3%(+26.5)#82 | 11.1%(+27.7)#2,045 |
| 83. | Firebaugh | 38.6% | 12.3%(+26.3)#83 | 11.1%(+27.5)#2,062 |
| 84. | Bridgeport | 38.5% | 12.3%(+26.1)#84 | 11.1%(+27.4)#2,075 |
| 85. | California City | 38.3% | 12.3%(+26.0)#85 | 11.1%(+27.3)#2,094 |
| 86. | Lake Los Angeles | 38.0% | 12.3%(+25.6)#86 | 11.1%(+26.9)#2,127 |
| 87. | Dorris | 37.8% | 12.3%(+25.5)#87 | 11.1%(+26.8)#2,138 |
| 88. | Moss Beach | 37.8% | 12.3%(+25.5)#88 | 11.1%(+26.8)#2,141 |
| 89. | Furnace Creek | 37.5% | 12.3%(+25.2)#89 | 11.1%(+26.4)#2,182 |
| 90. | Pacheco | 37.5% | 12.3%(+25.2)#90 | 11.1%(+26.4)#2,195 |
| 91. | Citrus | 36.8% | 12.3%(+24.5)#91 | 11.1%(+25.7)#2,240 |
| 92. | Mesa | 36.4% | 12.3%(+24.1)#92 | 11.1%(+25.3)#2,279 |
| 93. | Romoland | 36.2% | 12.3%(+23.9)#93 | 11.1%(+25.2)#2,298 |
| 94. | Three Rocks | 35.7% | 12.3%(+23.4)#94 | 11.1%(+24.6)#2,342 |
| 95. | Mentone | 34.8% | 12.3%(+22.5)#95 | 11.1%(+23.7)#2,435 |
| 96. | Millville | 34.1% | 12.3%(+21.8)#96 | 11.1%(+23.0)#2,502 |
| 97. | Sierra Brooks | 33.7% | 12.3%(+21.3)#97 | 11.1%(+22.6)#2,539 |
| 98. | West Hollywood | 33.3% | 12.3%(+21.0)#98 | 11.1%(+22.3)#2,558 |
| 99. | Woody | 33.3% | 12.3%(+21.0)#99 | 11.1%(+22.3)#2,704 |
| 100. | Parlier | 32.9% | 12.3%(+20.6)#100 | 11.1%(+21.9)#2,753 |
Common Questions
What are the Top 10 Cities with the Highest Poverty Level Among Seniors Over the Age of 75 in California?
Top 10 Cities with the Highest Poverty Level Among Seniors Over the Age of 75 in California are:
#1
100.0%
#2
100.0%
#3
100.0%
#4
100.0%
#5
100.0%
#6
100.0%
#7
100.0%
#8
100.0%
#9
100.0%
#10
100.0%
What city has the Highest Poverty Level Among Seniors Over the Age of 75 in California?
London has the Highest Poverty Level Among Seniors Over the Age of 75 in California with 100.0%.
What is the Poverty Level Among Seniors Over the Age of 75 in the State of California?
Poverty Level Among Seniors Over the Age of 75 in California is 12.3%.
What is the Poverty Level Among Seniors Over the Age of 75 in the United States?
Poverty Level Among Seniors Over the Age of 75 in the United States is 11.1%.