Cities with the Highest Percentage of Population Employed in Installation, Maintenance & Repair in Delaware
RELATED REPORTS & OPTIONS
Installation, Maintenance & Repair
Delaware
Compare Cities
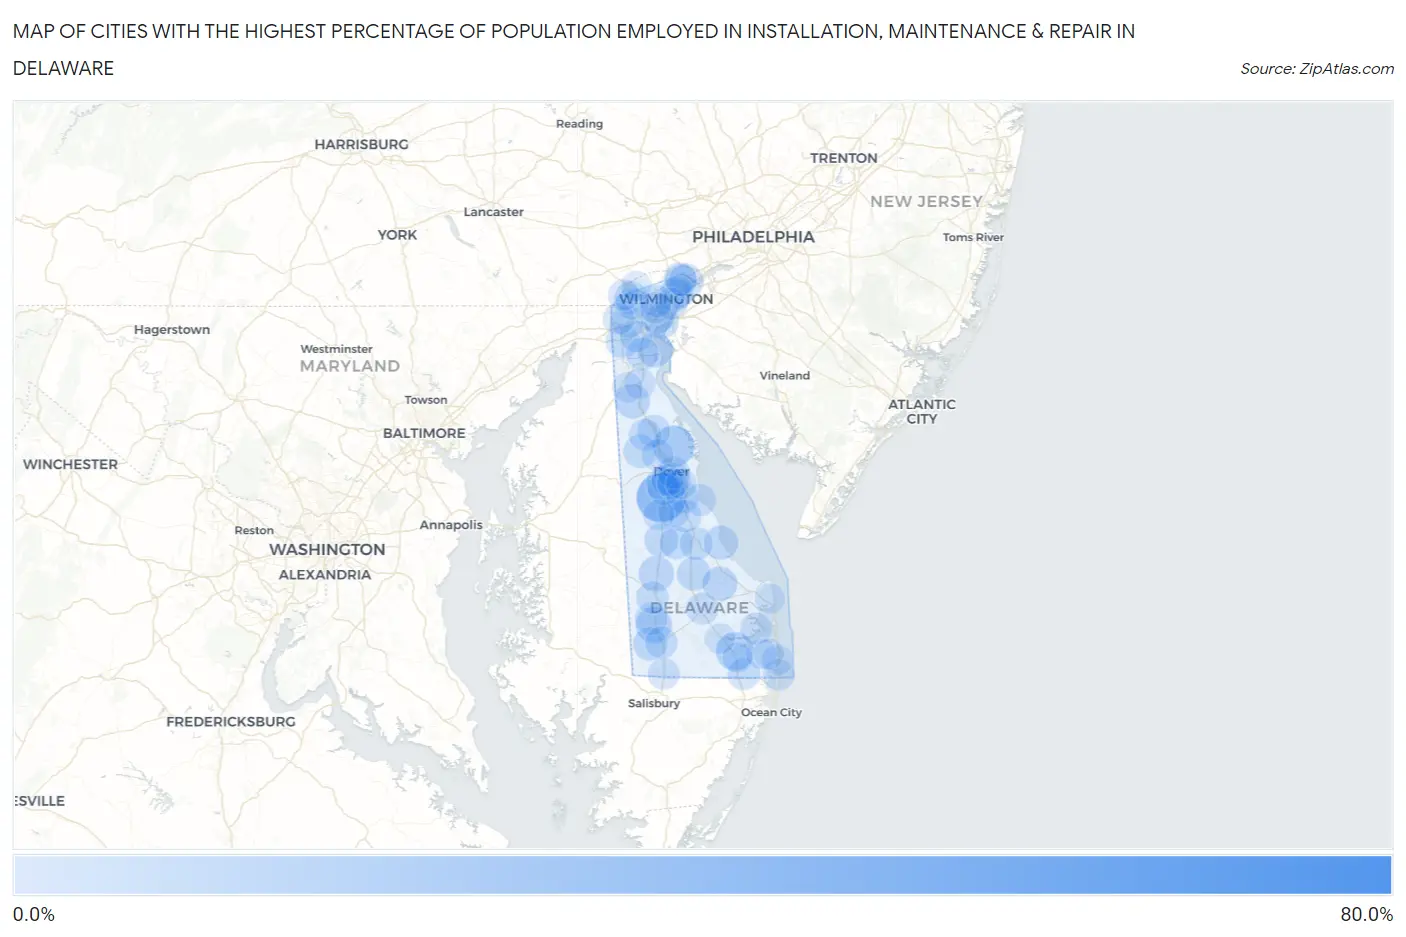
Map of Cities with the Highest Percentage of Population Employed in Installation, Maintenance & Repair in Delaware
0.0%
80.0%
Cities with the Highest Percentage of Population Employed in Installation, Maintenance & Repair in Delaware
| City | % Employed | vs State | vs National | |
| 1. | Port Penn | 60.9% | 3.4%(+57.4)#1 | 3.1%(+57.8)#41 |
| 2. | Woodside | 27.7% | 3.4%(+24.2)#2 | 3.1%(+24.6)#342 |
| 3. | Leipsic | 15.7% | 3.4%(+12.3)#3 | 3.1%(+12.7)#1,050 |
| 4. | Dagsboro | 11.7% | 3.4%(+8.30)#4 | 3.1%(+8.68)#1,909 |
| 5. | Blades | 9.0% | 3.4%(+5.54)#5 | 3.1%(+5.92)#3,126 |
| 6. | Greenwood | 7.5% | 3.4%(+4.08)#6 | 3.1%(+4.46)#4,398 |
| 7. | New Castle | 6.8% | 3.4%(+3.33)#7 | 3.1%(+3.71)#5,298 |
| 8. | Townsend | 6.7% | 3.4%(+3.26)#8 | 3.1%(+3.64)#5,378 |
| 9. | Milton | 6.6% | 3.4%(+3.12)#9 | 3.1%(+3.50)#5,592 |
| 10. | Delaware City | 6.6% | 3.4%(+3.11)#10 | 3.1%(+3.50)#5,602 |
| 11. | Claymont | 5.9% | 3.4%(+2.48)#11 | 3.1%(+2.86)#6,572 |
| 12. | Slaughter Beach | 5.7% | 3.4%(+2.30)#12 | 3.1%(+2.68)#6,920 |
| 13. | Kent Acres | 5.7% | 3.4%(+2.24)#13 | 3.1%(+2.62)#7,013 |
| 14. | Ellendale | 5.3% | 3.4%(+1.87)#14 | 3.1%(+2.25)#7,770 |
| 15. | Harrington | 5.2% | 3.4%(+1.79)#15 | 3.1%(+2.17)#7,942 |
| 16. | Bethel | 5.0% | 3.4%(+1.59)#16 | 3.1%(+1.97)#8,362 |
| 17. | Glasgow | 5.0% | 3.4%(+1.51)#17 | 3.1%(+1.89)#8,564 |
| 18. | Kenton | 4.8% | 3.4%(+1.37)#18 | 3.1%(+1.75)#8,901 |
| 19. | Houston | 4.8% | 3.4%(+1.31)#19 | 3.1%(+1.69)#9,036 |
| 20. | Wyoming | 4.6% | 3.4%(+1.12)#20 | 3.1%(+1.50)#9,557 |
| 21. | Milford | 4.4% | 3.4%(+0.993)#21 | 3.1%(+1.37)#9,916 |
| 22. | Edgemoor | 4.1% | 3.4%(+0.624)#22 | 3.1%(+1.00)#10,983 |
| 23. | Pike Creek | 3.9% | 3.4%(+0.461)#23 | 3.1%(+0.842)#11,470 |
| 24. | Wilmington Manor | 3.8% | 3.4%(+0.363)#24 | 3.1%(+0.743)#11,800 |
| 25. | Smyrna | 3.8% | 3.4%(+0.343)#25 | 3.1%(+0.724)#11,862 |
| 26. | Seaford | 3.7% | 3.4%(+0.297)#26 | 3.1%(+0.678)#12,023 |
| 27. | Brookside | 3.7% | 3.4%(+0.248)#27 | 3.1%(+0.629)#12,210 |
| 28. | Arden | 3.7% | 3.4%(+0.231)#28 | 3.1%(+0.611)#12,265 |
| 29. | St Georges | 3.5% | 3.4%(+0.091)#29 | 3.1%(+0.472)#12,726 |
| 30. | Frederica | 3.5% | 3.4%(+0.064)#30 | 3.1%(+0.445)#12,822 |
| 31. | Clayton | 3.5% | 3.4%(+0.015)#31 | 3.1%(+0.396)#12,987 |
| 32. | Camden | 3.5% | 3.4%(+0.012)#32 | 3.1%(+0.393)#12,994 |
| 33. | Magnolia | 3.4% | 3.4%(-0.000)#33 | 3.1%(+0.381)#13,048 |
| 34. | Dover | 3.4% | 3.4%(-0.036)#34 | 3.1%(+0.345)#13,179 |
| 35. | Bridgeville | 3.3% | 3.4%(-0.099)#35 | 3.1%(+0.282)#13,423 |
| 36. | Bellefonte | 3.3% | 3.4%(-0.176)#36 | 3.1%(+0.205)#13,712 |
| 37. | Laurel | 3.2% | 3.4%(-0.264)#37 | 3.1%(+0.117)#14,016 |
| 38. | Bear | 3.0% | 3.4%(-0.402)#38 | 3.1%(-0.021)#14,557 |
| 39. | Pike Creek Valley | 3.0% | 3.4%(-0.403)#39 | 3.1%(-0.022)#14,565 |
| 40. | Selbyville | 3.0% | 3.4%(-0.418)#40 | 3.1%(-0.037)#14,607 |
| 41. | Elsmere | 3.0% | 3.4%(-0.457)#41 | 3.1%(-0.076)#14,764 |
| 42. | Bowers | 2.9% | 3.4%(-0.507)#42 | 3.1%(-0.126)#14,990 |
| 43. | Wilmington | 2.9% | 3.4%(-0.522)#43 | 3.1%(-0.141)#15,046 |
| 44. | Long Neck | 2.9% | 3.4%(-0.578)#44 | 3.1%(-0.197)#15,243 |
| 45. | Georgetown | 2.8% | 3.4%(-0.613)#45 | 3.1%(-0.233)#15,388 |
| 46. | Riverview | 2.8% | 3.4%(-0.662)#46 | 3.1%(-0.281)#15,576 |
| 47. | Cheswold | 2.8% | 3.4%(-0.682)#47 | 3.1%(-0.301)#15,660 |
| 48. | Rodney Village | 2.7% | 3.4%(-0.706)#48 | 3.1%(-0.325)#15,745 |
| 49. | Delmar | 2.2% | 3.4%(-1.23)#49 | 3.1%(-0.845)#17,931 |
| 50. | Newark | 2.2% | 3.4%(-1.23)#50 | 3.1%(-0.848)#17,960 |
| 51. | Newport | 2.2% | 3.4%(-1.23)#51 | 3.1%(-0.849)#17,965 |
| 52. | Ardentown | 2.0% | 3.4%(-1.45)#52 | 3.1%(-1.07)#18,789 |
| 53. | Fenwick Island | 1.9% | 3.4%(-1.58)#53 | 3.1%(-1.20)#19,284 |
| 54. | Felton | 1.5% | 3.4%(-1.99)#54 | 3.1%(-1.61)#20,788 |
| 55. | South Bethany | 1.4% | 3.4%(-2.06)#55 | 3.1%(-1.68)#21,040 |
| 56. | Odessa | 1.2% | 3.4%(-2.24)#56 | 3.1%(-1.86)#21,603 |
| 57. | North Star | 1.2% | 3.4%(-2.28)#57 | 3.1%(-1.89)#21,719 |
| 58. | Highland Acres | 1.2% | 3.4%(-2.28)#58 | 3.1%(-1.90)#21,730 |
| 59. | Millville | 0.90% | 3.4%(-2.55)#59 | 3.1%(-2.17)#22,516 |
| 60. | Middletown | 0.89% | 3.4%(-2.56)#60 | 3.1%(-2.18)#22,556 |
| 61. | Ocean View | 0.88% | 3.4%(-2.57)#61 | 3.1%(-2.19)#22,576 |
| 62. | Frankford | 0.85% | 3.4%(-2.60)#62 | 3.1%(-2.22)#22,681 |
| 63. | Millsboro | 0.79% | 3.4%(-2.66)#63 | 3.1%(-2.28)#22,852 |
| 64. | Dover Base Housing | 0.75% | 3.4%(-2.70)#64 | 3.1%(-2.32)#22,954 |
| 65. | Hockessin | 0.50% | 3.4%(-2.95)#65 | 3.1%(-2.57)#23,470 |
| 66. | Rehoboth Beach | 0.49% | 3.4%(-2.96)#66 | 3.1%(-2.57)#23,480 |
1
Common Questions
What are the Top 10 Cities with the Highest Percentage of Population Employed in Installation, Maintenance & Repair in Delaware?
Top 10 Cities with the Highest Percentage of Population Employed in Installation, Maintenance & Repair in Delaware are:
#1
27.7%
#2
15.7%
#3
11.7%
#4
9.0%
#5
7.5%
#6
6.8%
#7
6.7%
#8
6.6%
#9
6.6%
#10
5.9%
What city has the Highest Percentage of Population Employed in Installation, Maintenance & Repair in Delaware?
Woodside has the Highest Percentage of Population Employed in Installation, Maintenance & Repair in Delaware with 27.7%.
What is the Percentage of Population Employed in Installation, Maintenance & Repair in the State of Delaware?
Percentage of Population Employed in Installation, Maintenance & Repair in Delaware is 3.4%.
What is the Percentage of Population Employed in Installation, Maintenance & Repair in the United States?
Percentage of Population Employed in Installation, Maintenance & Repair in the United States is 3.1%.