Cities with the Highest Percentage of Pakistani Population in California
RELATED REPORTS & OPTIONS
Pakistani
California
Compare Cities
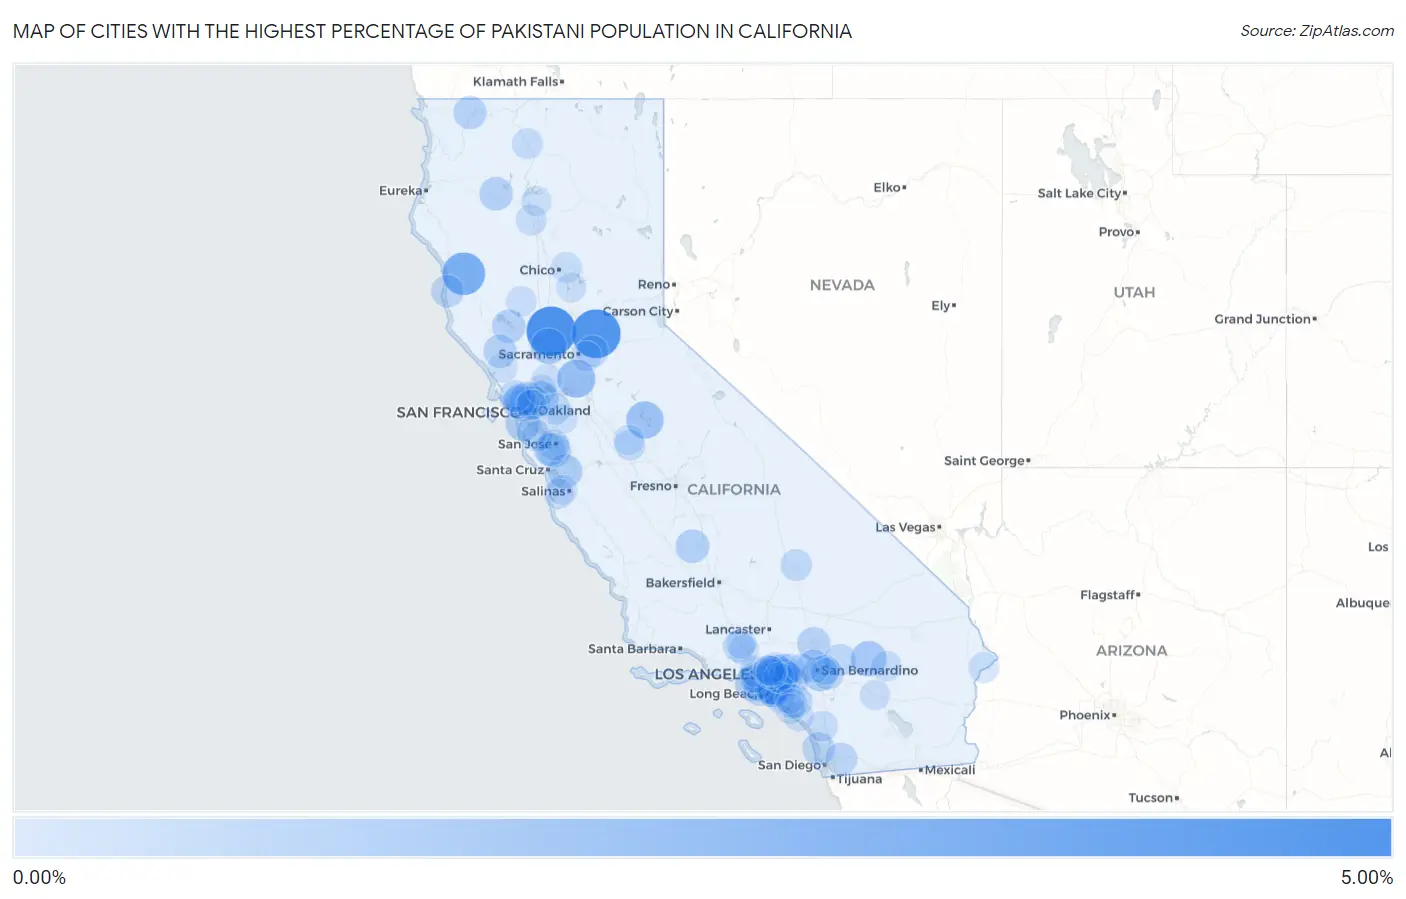
Map of Cities with the Highest Percentage of Pakistani Population in California
0.00%
5.00%
Cities with the Highest Percentage of Pakistani Population in California
| City | Pakistani | vs State | vs National | |
| 1. | Dunnigan | 4.31% | 0.19%(+4.11)#1 | 0.097%(+4.21)#29 |
| 2. | Franklin Cdp Merced County | 4.26% | 0.19%(+4.07)#2 | 0.097%(+4.16)#30 |
| 3. | Penryn | 4.14% | 0.19%(+3.94)#3 | 0.097%(+4.04)#32 |
| 4. | Laytonville | 2.90% | 0.19%(+2.71)#4 | 0.097%(+2.80)#54 |
| 5. | Walnut Grove | 1.97% | 0.19%(+1.77)#5 | 0.097%(+1.87)#107 |
| 6. | Lake Don Pedro | 1.81% | 0.19%(+1.62)#6 | 0.097%(+1.71)#117 |
| 7. | Industry | 1.71% | 0.19%(+1.52)#7 | 0.097%(+1.61)#132 |
| 8. | Esparto | 1.53% | 0.19%(+1.34)#8 | 0.097%(+1.43)#163 |
| 9. | Sage | 1.49% | 0.19%(+1.30)#9 | 0.097%(+1.39)#169 |
| 10. | Homestead Valley | 1.45% | 0.19%(+1.26)#10 | 0.097%(+1.36)#170 |
| 11. | La Palma | 1.42% | 0.19%(+1.23)#11 | 0.097%(+1.33)#179 |
| 12. | Cerritos | 1.41% | 0.19%(+1.22)#12 | 0.097%(+1.31)#183 |
| 13. | Loma Linda | 1.37% | 0.19%(+1.17)#13 | 0.097%(+1.27)#190 |
| 14. | El Segundo | 1.32% | 0.19%(+1.13)#14 | 0.097%(+1.23)#201 |
| 15. | Alhambra Valley | 1.31% | 0.19%(+1.12)#15 | 0.097%(+1.21)#204 |
| 16. | Cambrian Park | 1.30% | 0.19%(+1.10)#16 | 0.097%(+1.20)#206 |
| 17. | Interlaken | 1.26% | 0.19%(+1.06)#17 | 0.097%(+1.16)#219 |
| 18. | Pacifica | 1.22% | 0.19%(+1.03)#18 | 0.097%(+1.12)#226 |
| 19. | Baywood Park | 1.19% | 0.19%(+0.994)#19 | 0.097%(+1.09)#239 |
| 20. | Alpaugh | 1.14% | 0.19%(+0.945)#20 | 0.097%(+1.04)#255 |
| 21. | North Richmond | 1.12% | 0.19%(+0.933)#21 | 0.097%(+1.03)#259 |
| 22. | Weaverville | 1.09% | 0.19%(+0.897)#22 | 0.097%(+0.992)#270 |
| 23. | Clearlake Riviera | 1.08% | 0.19%(+0.884)#23 | 0.097%(+0.979)#273 |
| 24. | Mountain View Acres | 1.04% | 0.19%(+0.850)#24 | 0.097%(+0.944)#282 |
| 25. | Happy Camp | 1.03% | 0.19%(+0.839)#25 | 0.097%(+0.934)#289 |
| 26. | Muscoy | 1.03% | 0.19%(+0.833)#26 | 0.097%(+0.928)#291 |
| 27. | Healdsburg | 1.02% | 0.19%(+0.827)#27 | 0.097%(+0.922)#296 |
| 28. | Lakewood | 0.96% | 0.19%(+0.767)#28 | 0.097%(+0.861)#321 |
| 29. | Belvedere | 0.95% | 0.19%(+0.754)#29 | 0.097%(+0.848)#326 |
| 30. | Mill Valley | 0.94% | 0.19%(+0.745)#30 | 0.097%(+0.840)#327 |
| 31. | Del Mar | 0.94% | 0.19%(+0.744)#31 | 0.097%(+0.838)#328 |
| 32. | Arcadia | 0.93% | 0.19%(+0.739)#32 | 0.097%(+0.834)#330 |
| 33. | Monte Sereno | 0.90% | 0.19%(+0.708)#33 | 0.097%(+0.803)#341 |
| 34. | Fort Bragg | 0.90% | 0.19%(+0.707)#34 | 0.097%(+0.802)#342 |
| 35. | Kensington | 0.89% | 0.19%(+0.694)#35 | 0.097%(+0.788)#351 |
| 36. | Lake Forest | 0.83% | 0.19%(+0.637)#36 | 0.097%(+0.731)#384 |
| 37. | Crest | 0.82% | 0.19%(+0.626)#37 | 0.097%(+0.721)#391 |
| 38. | West Carson | 0.81% | 0.19%(+0.622)#38 | 0.097%(+0.717)#395 |
| 39. | Big Bear Lake | 0.81% | 0.19%(+0.619)#39 | 0.097%(+0.713)#397 |
| 40. | Los Alamitos | 0.81% | 0.19%(+0.618)#40 | 0.097%(+0.713)#398 |
| 41. | Citrus | 0.79% | 0.19%(+0.601)#41 | 0.097%(+0.695)#407 |
| 42. | Hawaiian Gardens | 0.79% | 0.19%(+0.600)#42 | 0.097%(+0.695)#408 |
| 43. | Larkspur | 0.79% | 0.19%(+0.595)#43 | 0.097%(+0.689)#413 |
| 44. | Mentone | 0.77% | 0.19%(+0.581)#44 | 0.097%(+0.676)#422 |
| 45. | View Park Windsor Hills | 0.77% | 0.19%(+0.575)#45 | 0.097%(+0.670)#424 |
| 46. | Ridgecrest | 0.75% | 0.19%(+0.562)#46 | 0.097%(+0.657)#433 |
| 47. | Rossmoor | 0.75% | 0.19%(+0.558)#47 | 0.097%(+0.652)#437 |
| 48. | Gold River | 0.75% | 0.19%(+0.554)#48 | 0.097%(+0.649)#441 |
| 49. | Fairfax | 0.74% | 0.19%(+0.548)#49 | 0.097%(+0.643)#444 |
| 50. | Chino Hills | 0.74% | 0.19%(+0.545)#50 | 0.097%(+0.639)#446 |
| 51. | West Covina | 0.73% | 0.19%(+0.539)#51 | 0.097%(+0.633)#450 |
| 52. | Val Verde | 0.73% | 0.19%(+0.537)#52 | 0.097%(+0.632)#452 |
| 53. | North Fork | 0.70% | 0.19%(+0.510)#53 | 0.097%(+0.604)#471 |
| 54. | Blackhawk | 0.67% | 0.19%(+0.477)#54 | 0.097%(+0.571)#495 |
| 55. | Burbank | 0.63% | 0.19%(+0.439)#55 | 0.097%(+0.534)#520 |
| 56. | Beverly Hills | 0.62% | 0.19%(+0.432)#56 | 0.097%(+0.526)#526 |
| 57. | Mcswain | 0.61% | 0.19%(+0.423)#57 | 0.097%(+0.518)#540 |
| 58. | Weed | 0.60% | 0.19%(+0.406)#58 | 0.097%(+0.501)#561 |
| 59. | Cottonwood | 0.59% | 0.19%(+0.402)#59 | 0.097%(+0.497)#566 |
| 60. | East San Gabriel | 0.59% | 0.19%(+0.395)#60 | 0.097%(+0.490)#575 |
| 61. | Walnut | 0.58% | 0.19%(+0.393)#61 | 0.097%(+0.488)#577 |
| 62. | Big River | 0.58% | 0.19%(+0.392)#62 | 0.097%(+0.487)#579 |
| 63. | Butte Creek Canyon | 0.58% | 0.19%(+0.388)#63 | 0.097%(+0.483)#582 |
| 64. | North El Monte | 0.58% | 0.19%(+0.386)#64 | 0.097%(+0.480)#584 |
| 65. | Alondra Park | 0.58% | 0.19%(+0.386)#65 | 0.097%(+0.480)#585 |
| 66. | Alhambra | 0.58% | 0.19%(+0.385)#66 | 0.097%(+0.480)#586 |
| 67. | West Menlo Park | 0.56% | 0.19%(+0.367)#67 | 0.097%(+0.462)#608 |
| 68. | Bonsall | 0.56% | 0.19%(+0.365)#68 | 0.097%(+0.460)#613 |
| 69. | Benicia | 0.55% | 0.19%(+0.359)#69 | 0.097%(+0.454)#619 |
| 70. | Rowland Heights | 0.55% | 0.19%(+0.355)#70 | 0.097%(+0.450)#629 |
| 71. | Twentynine Palms | 0.54% | 0.19%(+0.351)#71 | 0.097%(+0.446)#635 |
| 72. | Belmont | 0.53% | 0.19%(+0.340)#72 | 0.097%(+0.435)#651 |
| 73. | Fountain Valley | 0.52% | 0.19%(+0.330)#73 | 0.097%(+0.425)#670 |
| 74. | Rosemont | 0.52% | 0.19%(+0.324)#74 | 0.097%(+0.419)#678 |
| 75. | Diamond Bar | 0.51% | 0.19%(+0.320)#75 | 0.097%(+0.415)#682 |
| 76. | Albany | 0.51% | 0.19%(+0.318)#76 | 0.097%(+0.412)#686 |
| 77. | Culver City | 0.51% | 0.19%(+0.316)#77 | 0.097%(+0.411)#690 |
| 78. | Stevenson Ranch | 0.50% | 0.19%(+0.311)#78 | 0.097%(+0.406)#697 |
| 79. | La Verne | 0.50% | 0.19%(+0.311)#79 | 0.097%(+0.406)#698 |
| 80. | South San Gabriel | 0.50% | 0.19%(+0.309)#80 | 0.097%(+0.404)#701 |
| 81. | Winton | 0.50% | 0.19%(+0.309)#81 | 0.097%(+0.404)#705 |
| 82. | Lodoga | 0.50% | 0.19%(+0.306)#82 | 0.097%(+0.401)#711 |
| 83. | South Pasadena | 0.49% | 0.19%(+0.301)#83 | 0.097%(+0.396)#716 |
| 84. | Bermuda Dunes | 0.49% | 0.19%(+0.301)#84 | 0.097%(+0.396)#717 |
| 85. | Seaside | 0.49% | 0.19%(+0.294)#85 | 0.097%(+0.389)#730 |
| 86. | San Clemente | 0.47% | 0.19%(+0.283)#86 | 0.097%(+0.378)#746 |
| 87. | Laguna Beach | 0.47% | 0.19%(+0.279)#87 | 0.097%(+0.374)#754 |
| 88. | Irvine | 0.46% | 0.19%(+0.269)#88 | 0.097%(+0.363)#771 |
| 89. | Bella Vista | 0.46% | 0.19%(+0.263)#89 | 0.097%(+0.358)#781 |
| 90. | Hacienda Heights | 0.45% | 0.19%(+0.261)#90 | 0.097%(+0.356)#783 |
| 91. | Marina | 0.45% | 0.19%(+0.258)#91 | 0.097%(+0.352)#788 |
| 92. | Laguna Woods | 0.45% | 0.19%(+0.255)#92 | 0.097%(+0.350)#790 |
| 93. | Rancho Cucamonga | 0.44% | 0.19%(+0.252)#93 | 0.097%(+0.347)#794 |
| 94. | Fairfield | 0.44% | 0.19%(+0.252)#94 | 0.097%(+0.347)#796 |
| 95. | Thermalito | 0.44% | 0.19%(+0.250)#95 | 0.097%(+0.345)#800 |
| 96. | Castaic | 0.44% | 0.19%(+0.248)#96 | 0.097%(+0.343)#805 |
| 97. | Sebastopol | 0.44% | 0.19%(+0.248)#97 | 0.097%(+0.343)#806 |
| 98. | San Gabriel | 0.44% | 0.19%(+0.247)#98 | 0.097%(+0.342)#807 |
| 99. | Highland | 0.44% | 0.19%(+0.245)#99 | 0.097%(+0.340)#811 |
| 100. | Livermore | 0.43% | 0.19%(+0.242)#100 | 0.097%(+0.337)#819 |
Common Questions
What are the Top 10 Cities with the Highest Percentage of Pakistani Population in California?
Top 10 Cities with the Highest Percentage of Pakistani Population in California are:
#1
4.31%
#2
4.14%
#3
2.90%
#4
1.97%
#5
1.81%
#6
1.71%
#7
1.53%
#8
1.45%
#9
1.42%
#10
1.41%
What city has the Highest Percentage of Pakistani Population in California?
Dunnigan has the Highest Percentage of Pakistani Population in California with 4.31%.
What is the Percentage of Pakistani Population in the State of California?
Percentage of Pakistani Population in California is 0.19%.
What is the Percentage of Pakistani Population in the United States?
Percentage of Pakistani Population in the United States is 0.097%.