Bystrom, CA Map & Demographics
Bystrom Map
Bystrom Overview
$15,568
PER CAPITA INCOME
$45,781
AVG FAMILY INCOME
$34,569
AVG HOUSEHOLD INCOME
27.9%
WAGE / INCOME GAP [ % ]
72.1¢/ $1
WAGE / INCOME GAP [ $ ]
0.44
INEQUALITY / GINI INDEX
3,941
TOTAL POPULATION
1,842
MALE POPULATION
2,099
FEMALE POPULATION
87.76
MALES / 100 FEMALES
113.95
FEMALES / 100 MALES
27.3
MEDIAN AGE
4.0
AVG FAMILY SIZE
3.3
AVG HOUSEHOLD SIZE
1,333
LABOR FORCE [ PEOPLE ]
49.0%
PERCENT IN LABOR FORCE
20.6%
UNEMPLOYMENT RATE
Income in Bystrom
Income Overview in Bystrom
Per Capita Income in Bystrom is $15,568, while median incomes of families and households are $45,781 and $34,569 respectively.
| Characteristic | Number | Measure |
| Per Capita Income | 3,941 | $15,568 |
| Median Family Income | 822 | $45,781 |
| Mean Family Income | 822 | $54,904 |
| Median Household Income | 1,174 | $34,569 |
| Mean Household Income | 1,174 | $48,198 |
| Income Deficit | 822 | $0 |
| Wage / Income Gap (%) | 3,941 | 27.92% |
| Wage / Income Gap ($) | 3,941 | 72.08¢ per $1 |
| Gini / Inequality Index | 3,941 | 0.44 |
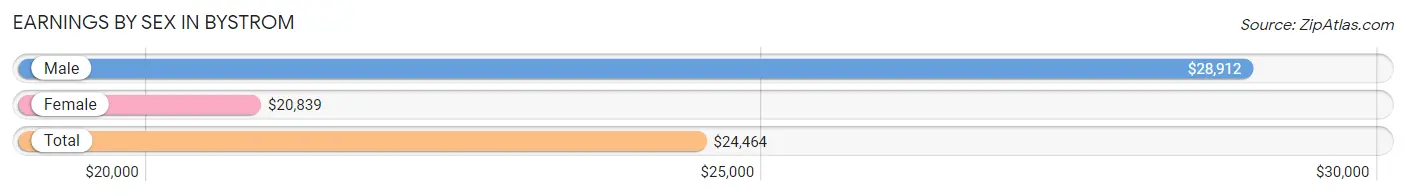
Earnings by Sex in Bystrom
Average Earnings in Bystrom are $24,464, $28,912 for men and $20,839 for women, a difference of 27.9%.
| Sex | Number | Average Earnings |
| Male | 908 (58.6%) | $28,912 |
| Female | 641 (41.4%) | $20,839 |
| Total | 1,549 (100.0%) | $24,464 |
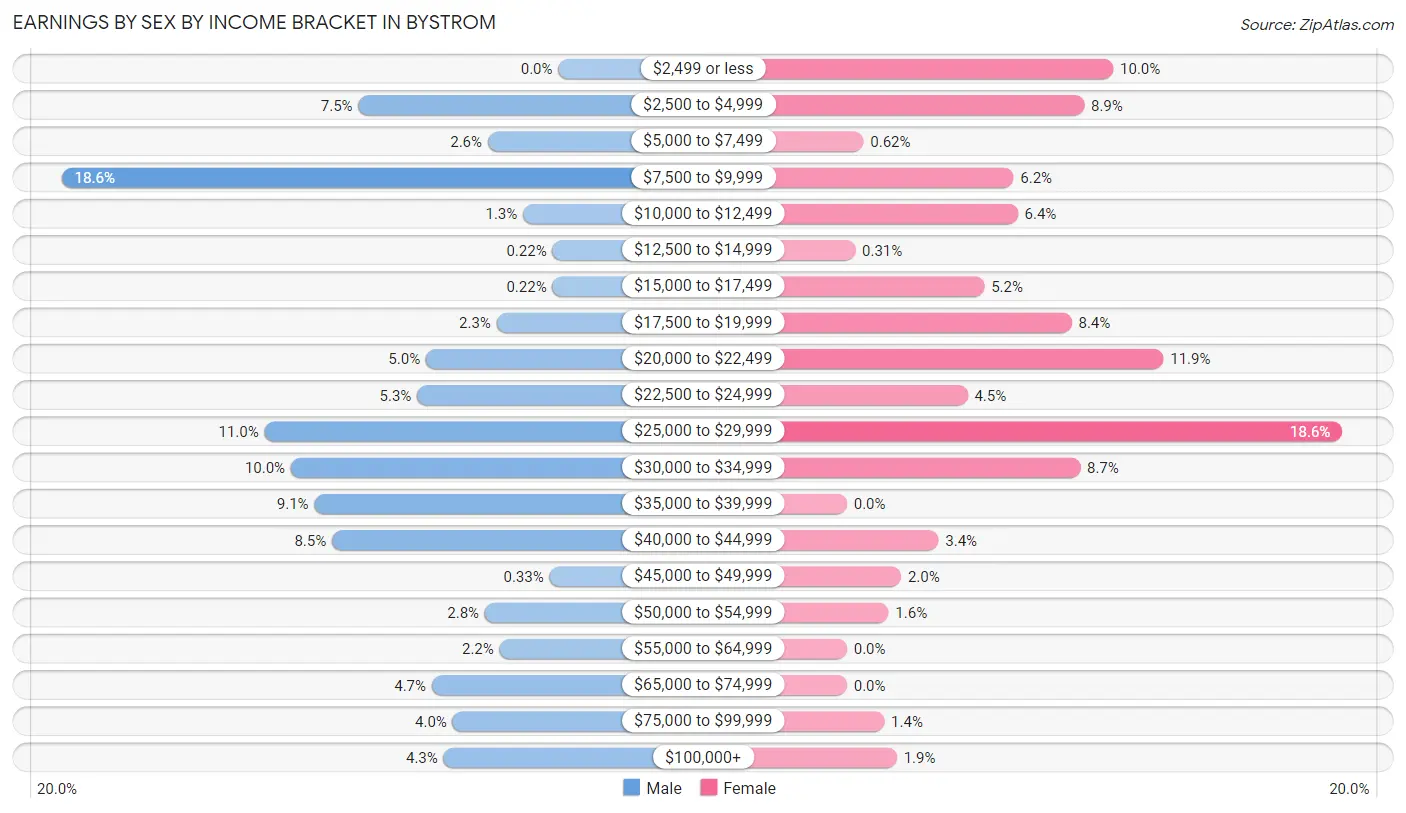
Earnings by Sex by Income Bracket in Bystrom
The most common earnings brackets in Bystrom are $7,500 to $9,999 for men (169 | 18.6%) and $25,000 to $29,999 for women (119 | 18.6%).
| Income | Male | Female |
| $2,499 or less | 0 (0.0%) | 64 (10.0%) |
| $2,500 to $4,999 | 68 (7.5%) | 57 (8.9%) |
| $5,000 to $7,499 | 24 (2.6%) | 4 (0.6%) |
| $7,500 to $9,999 | 169 (18.6%) | 40 (6.2%) |
| $10,000 to $12,499 | 12 (1.3%) | 41 (6.4%) |
| $12,500 to $14,999 | 2 (0.2%) | 2 (0.3%) |
| $15,000 to $17,499 | 2 (0.2%) | 33 (5.1%) |
| $17,500 to $19,999 | 21 (2.3%) | 54 (8.4%) |
| $20,000 to $22,499 | 45 (5.0%) | 76 (11.9%) |
| $22,500 to $24,999 | 48 (5.3%) | 29 (4.5%) |
| $25,000 to $29,999 | 100 (11.0%) | 119 (18.6%) |
| $30,000 to $34,999 | 91 (10.0%) | 56 (8.7%) |
| $35,000 to $39,999 | 83 (9.1%) | 0 (0.0%) |
| $40,000 to $44,999 | 77 (8.5%) | 22 (3.4%) |
| $45,000 to $49,999 | 3 (0.3%) | 13 (2.0%) |
| $50,000 to $54,999 | 25 (2.8%) | 10 (1.6%) |
| $55,000 to $64,999 | 20 (2.2%) | 0 (0.0%) |
| $65,000 to $74,999 | 43 (4.7%) | 0 (0.0%) |
| $75,000 to $99,999 | 36 (4.0%) | 9 (1.4%) |
| $100,000+ | 39 (4.3%) | 12 (1.9%) |
| Total | 908 (100.0%) | 641 (100.0%) |
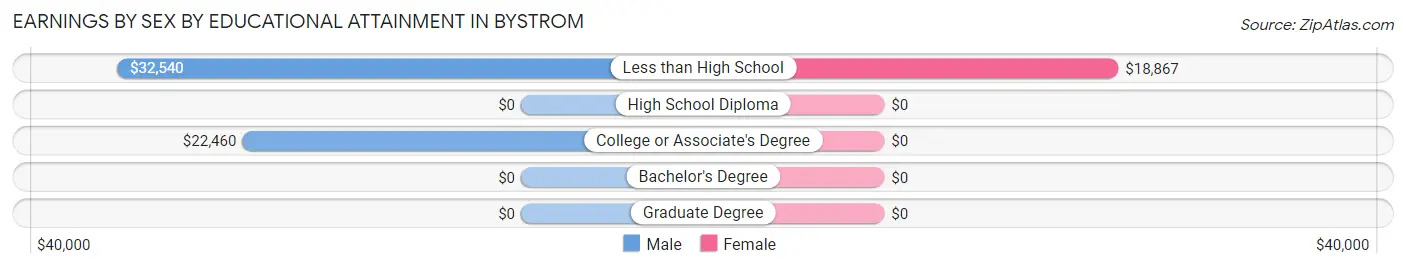
Earnings by Sex by Educational Attainment in Bystrom
Average earnings in Bystrom are $34,539 for men and $18,780 for women, a difference of 45.6%. Men with an educational attainment of less than high school enjoy the highest average annual earnings of $32,540, while those with college or associate's degree education earn the least with $22,460. Women with an educational attainment of less than high school earn the most with the average annual earnings of $18,867, while those with less than high school education have the smallest earnings of $18,867.
| Educational Attainment | Male Income | Female Income |
| Less than High School | $32,540 | $18,867 |
| High School Diploma | - | - |
| College or Associate's Degree | $22,460 | $0 |
| Bachelor's Degree | - | - |
| Graduate Degree | - | - |
| Total | $34,539 | $18,780 |
Family Income in Bystrom
Family Income Brackets in Bystrom
According to the Bystrom family income data, there are 192 families falling into the $50,000 to $74,999 income range, which is the most common income bracket and makes up 23.4% of all families. Conversely, the $200,000+ income bracket is the least frequent group with only 9 families (1.1%) belonging to this category.
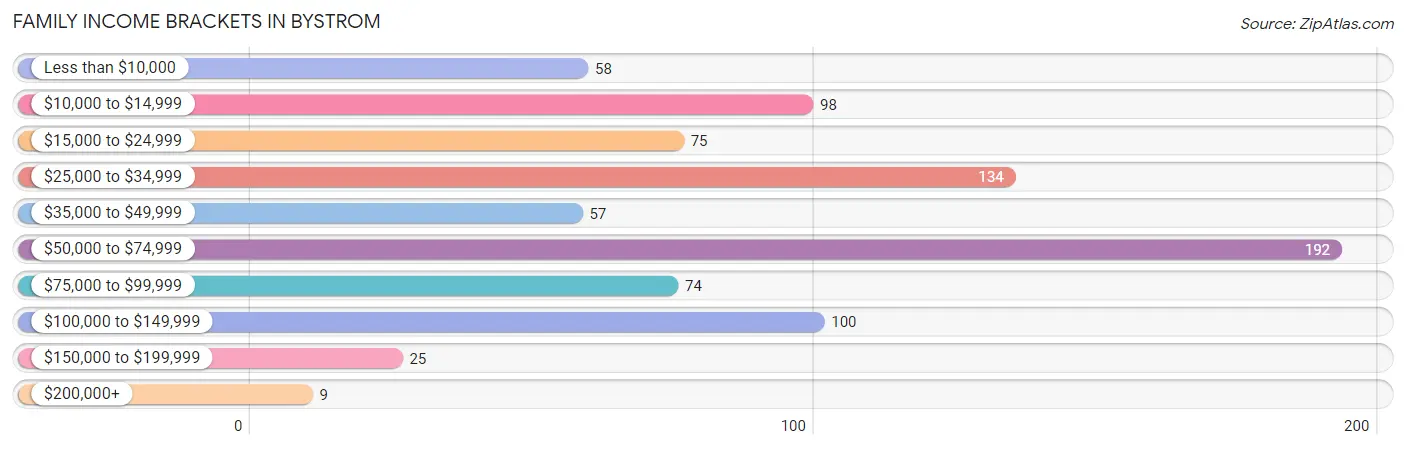
| Income Bracket | # Families | % Families |
| Less than $10,000 | 58 | 7.1% |
| $10,000 to $14,999 | 98 | 11.9% |
| $15,000 to $24,999 | 75 | 9.1% |
| $25,000 to $34,999 | 134 | 16.3% |
| $35,000 to $49,999 | 57 | 6.9% |
| $50,000 to $74,999 | 192 | 23.4% |
| $75,000 to $99,999 | 74 | 9.0% |
| $100,000 to $149,999 | 100 | 12.2% |
| $150,000 to $199,999 | 25 | 3.0% |
| $200,000+ | 9 | 1.1% |
Family Income by Famaliy Size in Bystrom
6-person families (96 | 11.7%) account for the highest median family income in Bystrom with $54,190 per family, while 4-person families (179 | 21.8%) have the highest median income of $9,531 per family member.
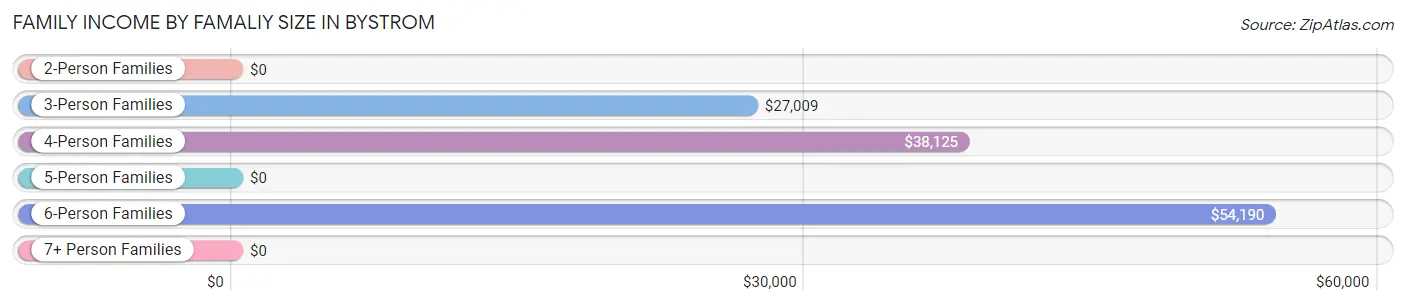
| Income Bracket | # Families | Median Income |
| 2-Person Families | 197 (24.0%) | $0 |
| 3-Person Families | 153 (18.6%) | $27,009 |
| 4-Person Families | 179 (21.8%) | $38,125 |
| 5-Person Families | 161 (19.6%) | $0 |
| 6-Person Families | 96 (11.7%) | $54,190 |
| 7+ Person Families | 36 (4.4%) | $0 |
| Total | 822 (100.0%) | $45,781 |
Family Income by Number of Earners in Bystrom
The median family income in Bystrom is $45,781, with families comprising 3+ earners (121) having the highest median family income of $96,375, while families with no earners (180) have the lowest median family income of $13,669, accounting for 14.7% and 21.9% of families, respectively.
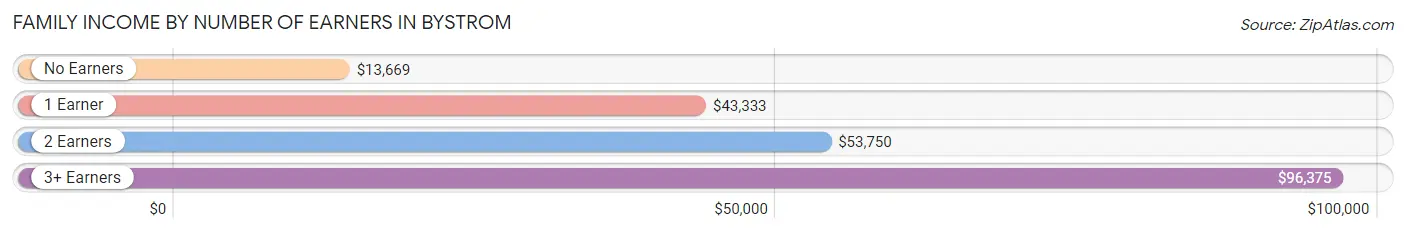
| Number of Earners | # Families | Median Income |
| No Earners | 180 (21.9%) | $13,669 |
| 1 Earner | 296 (36.0%) | $43,333 |
| 2 Earners | 225 (27.4%) | $53,750 |
| 3+ Earners | 121 (14.7%) | $96,375 |
| Total | 822 (100.0%) | $45,781 |
Household Income in Bystrom
Household Income Brackets in Bystrom
With 269 households falling in the category, the $50,000 to $74,999 income range is the most frequent in Bystrom, accounting for 22.9% of all households. In contrast, only 9 households (0.8%) fall into the $200,000+ income bracket, making it the least populous group.
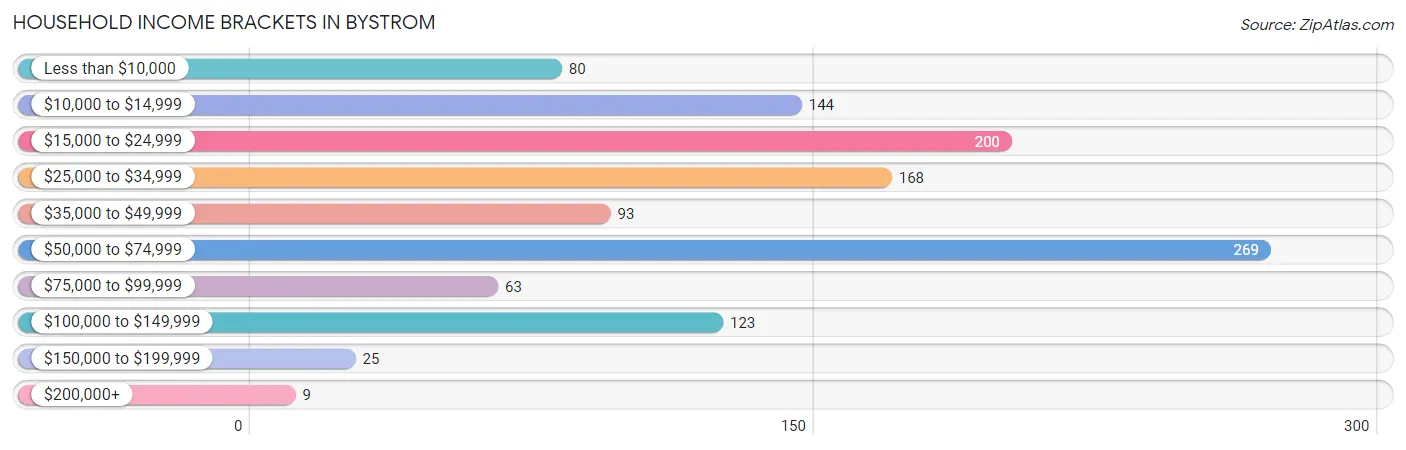
| Income Bracket | # Households | % Households |
| Less than $10,000 | 80 | 6.8% |
| $10,000 to $14,999 | 144 | 12.3% |
| $15,000 to $24,999 | 200 | 17.0% |
| $25,000 to $34,999 | 168 | 14.3% |
| $35,000 to $49,999 | 93 | 7.9% |
| $50,000 to $74,999 | 269 | 22.9% |
| $75,000 to $99,999 | 63 | 5.4% |
| $100,000 to $149,999 | 123 | 10.5% |
| $150,000 to $199,999 | 25 | 2.1% |
| $200,000+ | 9 | 0.8% |
Household Income by Householder Age in Bystrom
The median household income in Bystrom is $34,569, with the highest median household income of $52,649 found in the 45 to 64 years age bracket for the primary householder. A total of 433 households (36.9%) fall into this category. Meanwhile, the 15 to 24 years age bracket for the primary householder has the lowest median household income of $0, with 36 households (3.1%) in this group.
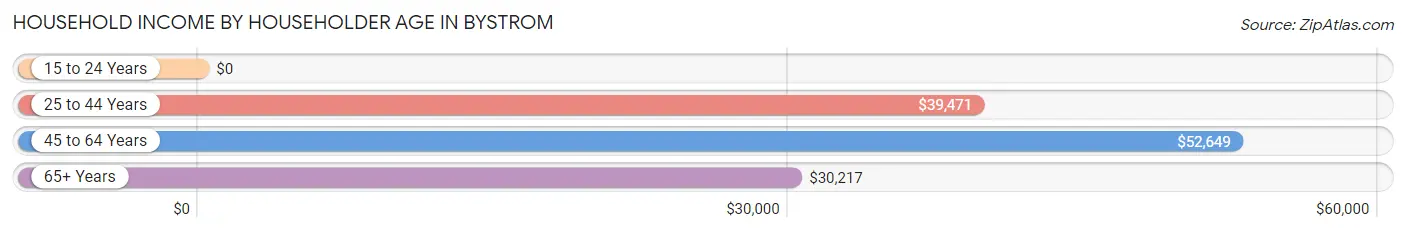
| Income Bracket | # Households | Median Income |
| 15 to 24 Years | 36 (3.1%) | $0 |
| 25 to 44 Years | 499 (42.5%) | $39,471 |
| 45 to 64 Years | 433 (36.9%) | $52,649 |
| 65+ Years | 206 (17.5%) | $30,217 |
| Total | 1,174 (100.0%) | $34,569 |
Poverty in Bystrom
Income Below Poverty by Sex and Age in Bystrom
With 20.3% poverty level for males and 30.4% for females among the residents of Bystrom, 16 and 17 year old males and 6 to 11 year old females are the most vulnerable to poverty, with 2 males (100.0%) and 126 females (50.8%) in their respective age groups living below the poverty level.
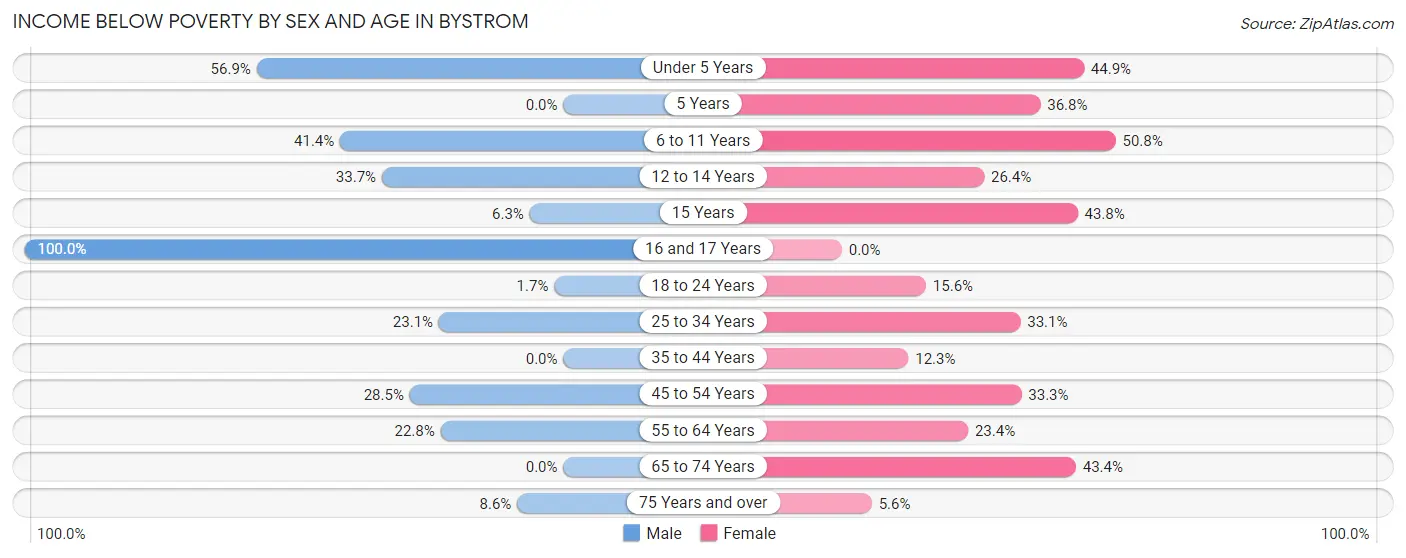
| Age Bracket | Male | Female |
| Under 5 Years | 78 (56.9%) | 120 (44.9%) |
| 5 Years | 0 (0.0%) | 7 (36.8%) |
| 6 to 11 Years | 75 (41.4%) | 126 (50.8%) |
| 12 to 14 Years | 32 (33.7%) | 33 (26.4%) |
| 15 Years | 3 (6.2%) | 14 (43.8%) |
| 16 and 17 Years | 2 (100.0%) | 0 (0.0%) |
| 18 to 24 Years | 4 (1.7%) | 47 (15.6%) |
| 25 to 34 Years | 64 (23.1%) | 110 (33.1%) |
| 35 to 44 Years | 0 (0.0%) | 29 (12.3%) |
| 45 to 54 Years | 63 (28.5%) | 60 (33.3%) |
| 55 to 64 Years | 49 (22.8%) | 37 (23.4%) |
| 65 to 74 Years | 0 (0.0%) | 53 (43.4%) |
| 75 Years and over | 3 (8.6%) | 2 (5.6%) |
| Total | 373 (20.3%) | 638 (30.4%) |
Income Above Poverty by Sex and Age in Bystrom
According to the poverty statistics in Bystrom, males aged 5 years and females aged 16 and 17 years are the age groups that are most secure financially, with 100.0% of males and 100.0% of females in these age groups living above the poverty line.
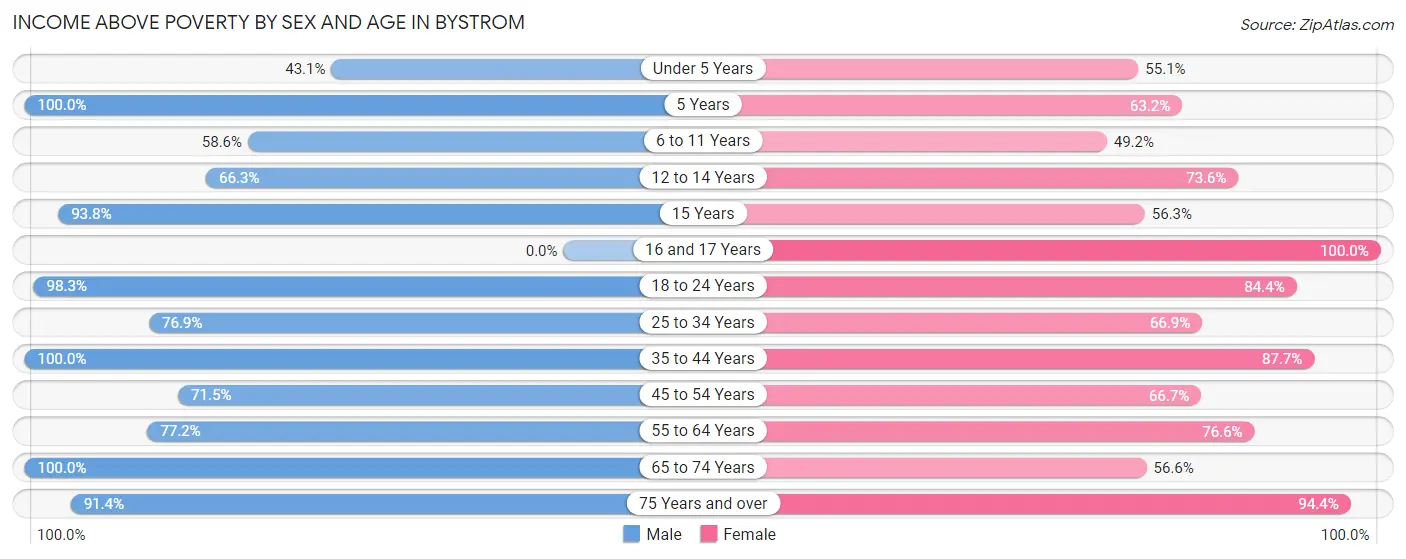
| Age Bracket | Male | Female |
| Under 5 Years | 59 (43.1%) | 147 (55.1%) |
| 5 Years | 67 (100.0%) | 12 (63.2%) |
| 6 to 11 Years | 106 (58.6%) | 122 (49.2%) |
| 12 to 14 Years | 63 (66.3%) | 92 (73.6%) |
| 15 Years | 45 (93.8%) | 18 (56.2%) |
| 16 and 17 Years | 0 (0.0%) | 44 (100.0%) |
| 18 to 24 Years | 232 (98.3%) | 254 (84.4%) |
| 25 to 34 Years | 213 (76.9%) | 222 (66.9%) |
| 35 to 44 Years | 221 (100.0%) | 206 (87.7%) |
| 45 to 54 Years | 158 (71.5%) | 120 (66.7%) |
| 55 to 64 Years | 166 (77.2%) | 121 (76.6%) |
| 65 to 74 Years | 106 (100.0%) | 69 (56.6%) |
| 75 Years and over | 32 (91.4%) | 34 (94.4%) |
| Total | 1,468 (79.7%) | 1,461 (69.6%) |
Income Below Poverty Among Married-Couple Families in Bystrom
The poverty statistics for married-couple families in Bystrom show that 4.3% or 21 of the total 494 families live below the poverty line. Families with 3 or 4 children have the highest poverty rate of 8.8%, comprising of 10 families. On the other hand, families with no children have the lowest poverty rate of 0.0%, which includes 0 families.
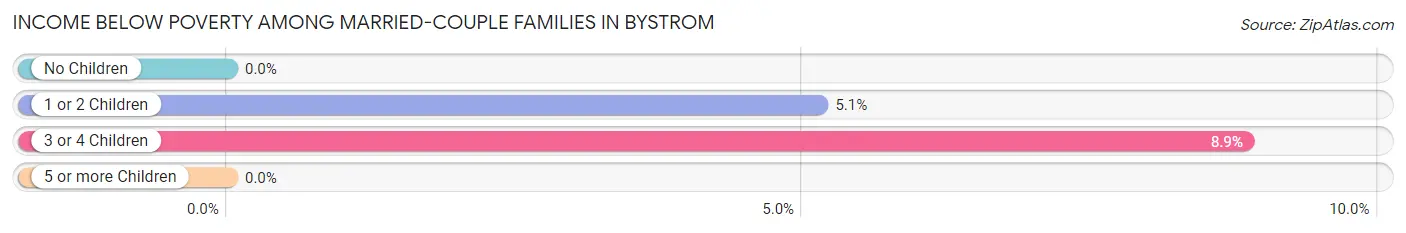
| Children | Above Poverty | Below Poverty |
| No Children | 157 (100.0%) | 0 (0.0%) |
| 1 or 2 Children | 203 (94.9%) | 11 (5.1%) |
| 3 or 4 Children | 103 (91.1%) | 10 (8.8%) |
| 5 or more Children | 10 (100.0%) | 0 (0.0%) |
| Total | 473 (95.8%) | 21 (4.3%) |
Income Below Poverty Among Single-Parent Households in Bystrom
According to the poverty data in Bystrom, 75.3% or 67 single-father households and 64.4% or 154 single-mother households are living below the poverty line. Among single-father households, those with 1 or 2 children have the highest poverty rate, with 67 households (75.3%) experiencing poverty. Likewise, among single-mother households, those with 3 or 4 children have the highest poverty rate, with 77 households (100.0%) falling below the poverty line.
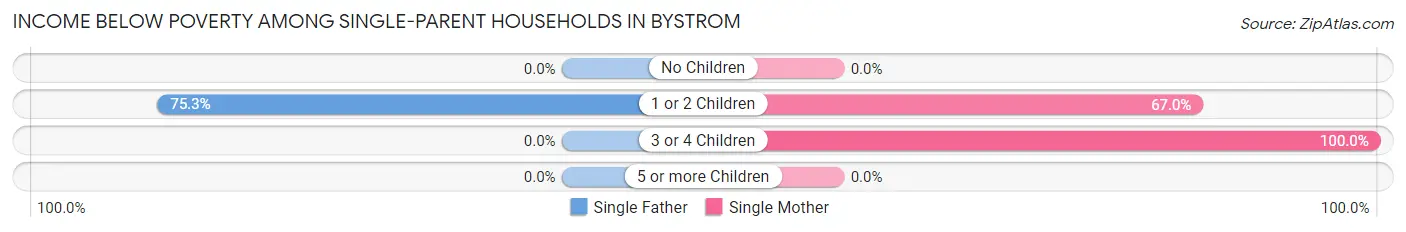
| Children | Single Father | Single Mother |
| No Children | 0 (0.0%) | 0 (0.0%) |
| 1 or 2 Children | 67 (75.3%) | 77 (67.0%) |
| 3 or 4 Children | 0 (0.0%) | 77 (100.0%) |
| 5 or more Children | 0 (0.0%) | 0 (0.0%) |
| Total | 67 (75.3%) | 154 (64.4%) |
Income Below Poverty Among Married-Couple vs Single-Parent Households in Bystrom
The poverty data for Bystrom shows that 21 of the married-couple family households (4.3%) and 221 of the single-parent households (67.4%) are living below the poverty level. Within the married-couple family households, those with 3 or 4 children have the highest poverty rate, with 10 households (8.8%) falling below the poverty line. Among the single-parent households, those with 3 or 4 children have the highest poverty rate, with 77 household (100.0%) living below poverty.
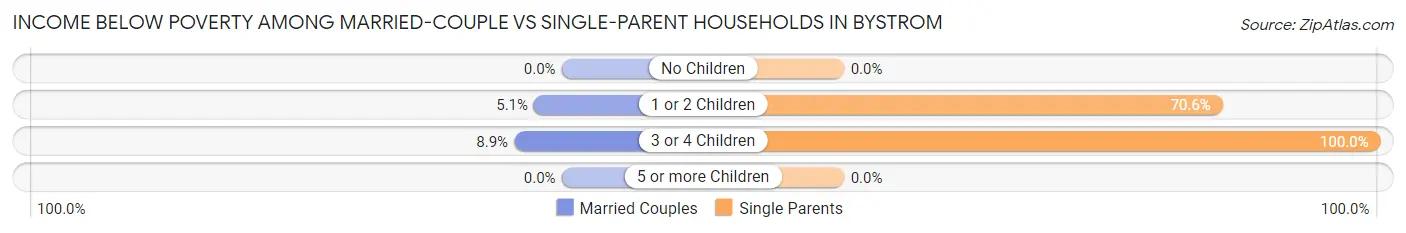
| Children | Married-Couple Families | Single-Parent Households |
| No Children | 0 (0.0%) | 0 (0.0%) |
| 1 or 2 Children | 11 (5.1%) | 144 (70.6%) |
| 3 or 4 Children | 10 (8.8%) | 77 (100.0%) |
| 5 or more Children | 0 (0.0%) | 0 (0.0%) |
| Total | 21 (4.3%) | 221 (67.4%) |
Race in Bystrom
The most populous races in Bystrom are Hispanic or Latino (2,966 | 75.3%), Two or more Races (1,440 | 36.5%), and White / Caucasian (1,316 | 33.4%).
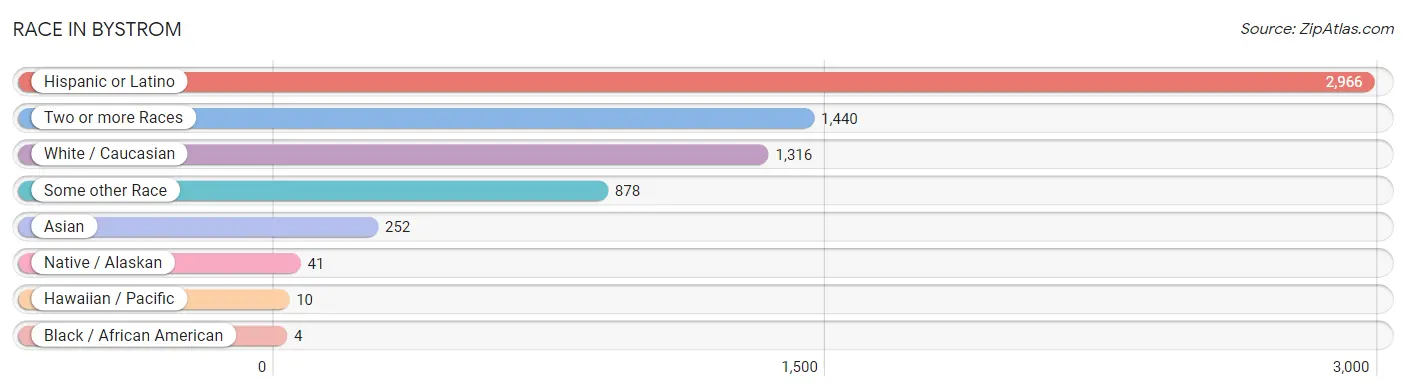
| Race | # Population | % Population |
| Asian | 252 | 6.4% |
| Black / African American | 4 | 0.1% |
| Hawaiian / Pacific | 10 | 0.3% |
| Hispanic or Latino | 2,966 | 75.3% |
| Native / Alaskan | 41 | 1.0% |
| White / Caucasian | 1,316 | 33.4% |
| Two or more Races | 1,440 | 36.5% |
| Some other Race | 878 | 22.3% |
| Total | 3,941 | 100.0% |
Ancestry in Bystrom
The most populous ancestries reported in Bystrom are Mexican (2,727 | 69.2%), Irish (254 | 6.5%), Japanese (206 | 5.2%), American (160 | 4.1%), and German (137 | 3.5%), together accounting for 88.4% of all Bystrom residents.
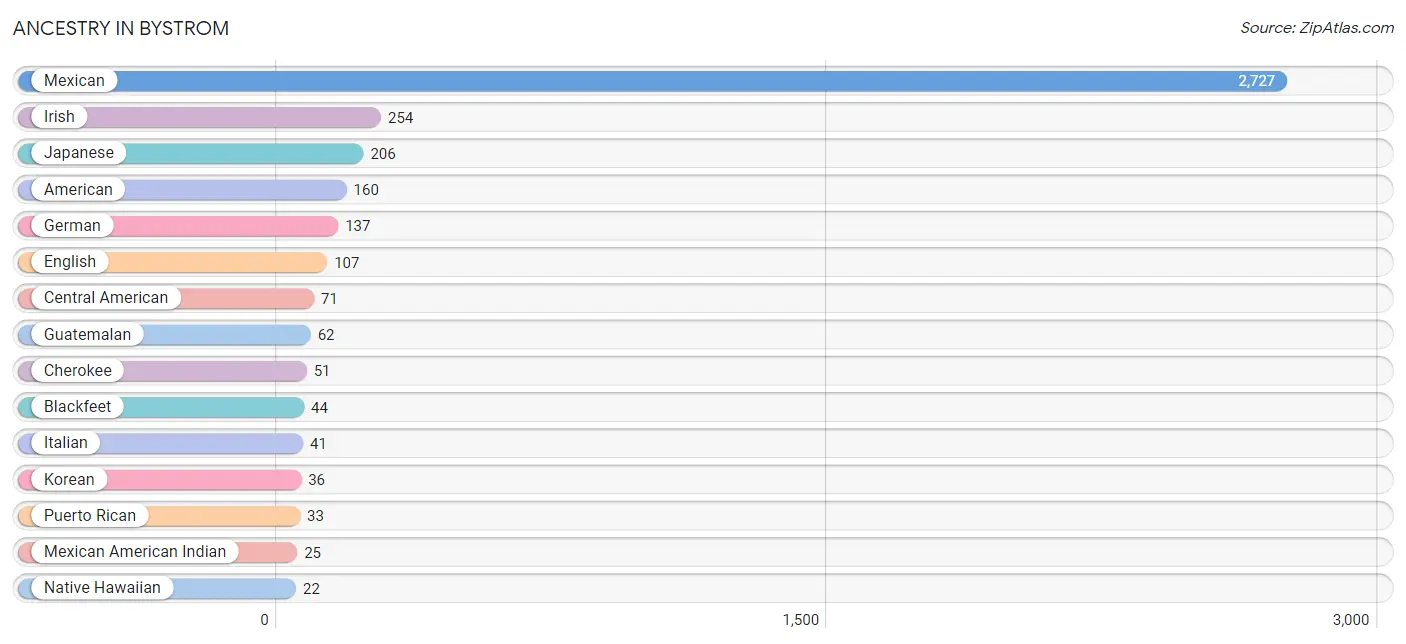
| Ancestry | # Population | % Population |
| American | 160 | 4.1% |
| Bhutanese | 5 | 0.1% |
| Blackfeet | 44 | 1.1% |
| Central American | 71 | 1.8% |
| Cherokee | 51 | 1.3% |
| English | 107 | 2.7% |
| French | 5 | 0.1% |
| German | 137 | 3.5% |
| Guatemalan | 62 | 1.6% |
| Indian (Asian) | 19 | 0.5% |
| Irish | 254 | 6.5% |
| Italian | 41 | 1.0% |
| Japanese | 206 | 5.2% |
| Korean | 36 | 0.9% |
| Mexican | 2,727 | 69.2% |
| Mexican American Indian | 25 | 0.6% |
| Native Hawaiian | 22 | 0.6% |
| Puerto Rican | 33 | 0.8% |
| Salvadoran | 9 | 0.2% |
| Scotch-Irish | 6 | 0.2% |
| Scottish | 19 | 0.5% |
| Sri Lankan | 22 | 0.6% |
| Swedish | 15 | 0.4% |
| Welsh | 19 | 0.5% | View All 24 Rows |
Immigrants in Bystrom
The most numerous immigrant groups reported in Bystrom came from Central America (948 | 24.0%), Latin America (948 | 24.0%), Mexico (886 | 22.5%), Guatemala (62 | 1.6%), and Asia (38 | 1.0%), together accounting for 73.1% of all Bystrom residents.
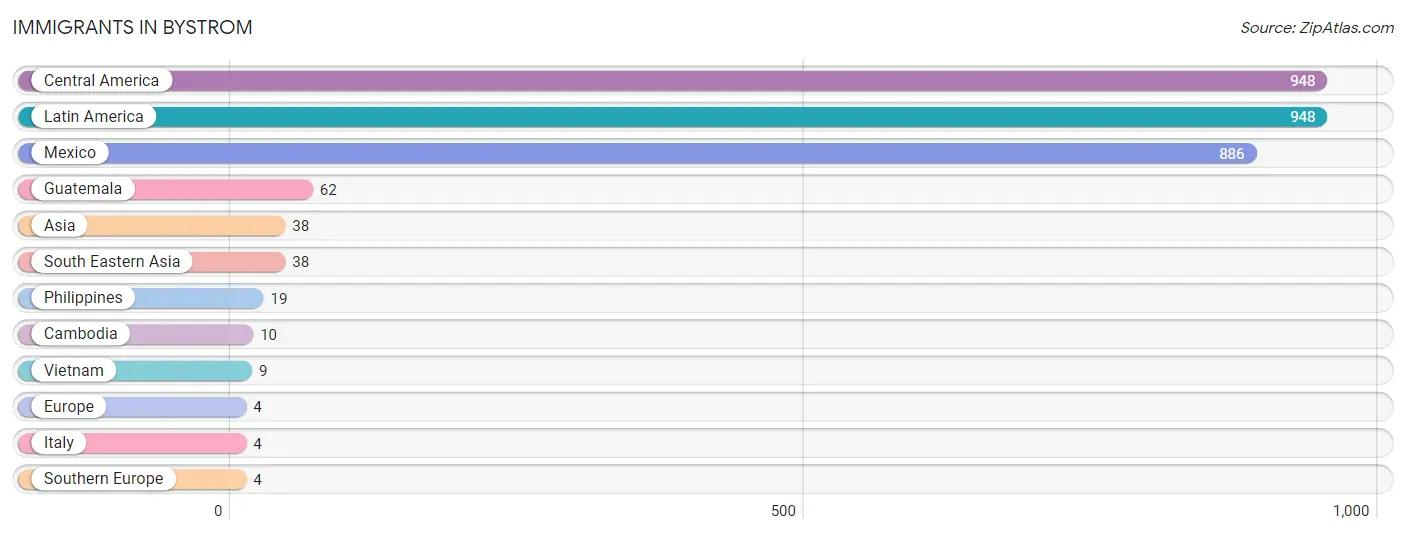
| Immigration Origin | # Population | % Population |
| Asia | 38 | 1.0% |
| Cambodia | 10 | 0.3% |
| Central America | 948 | 24.0% |
| Europe | 4 | 0.1% |
| Guatemala | 62 | 1.6% |
| Italy | 4 | 0.1% |
| Latin America | 948 | 24.0% |
| Mexico | 886 | 22.5% |
| Philippines | 19 | 0.5% |
| South Eastern Asia | 38 | 1.0% |
| Southern Europe | 4 | 0.1% |
| Vietnam | 9 | 0.2% | View All 12 Rows |
Sex and Age in Bystrom
Sex and Age in Bystrom
The most populous age groups in Bystrom are 5 to 9 Years (244 | 13.3%) for men and Under 5 Years (267 | 12.7%) for women.
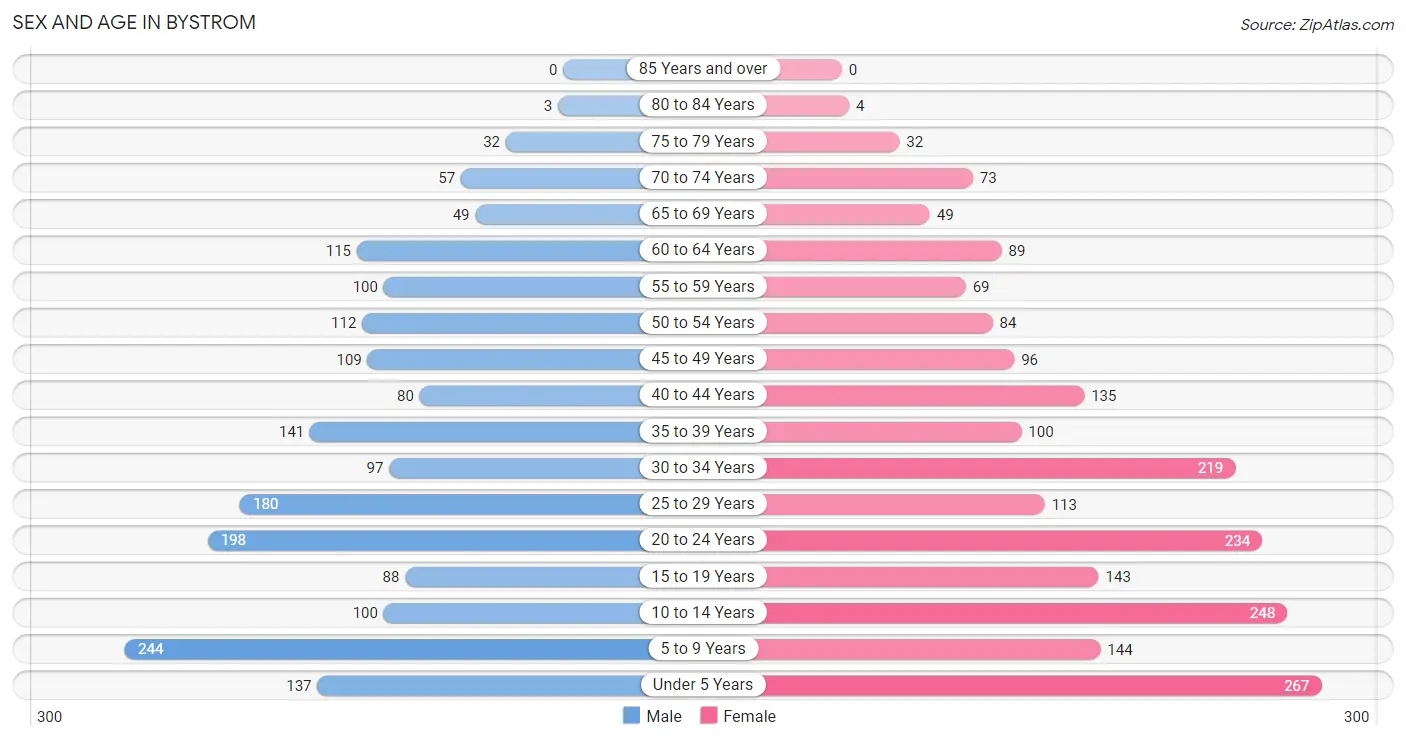
| Age Bracket | Male | Female |
| Under 5 Years | 137 (7.4%) | 267 (12.7%) |
| 5 to 9 Years | 244 (13.3%) | 144 (6.9%) |
| 10 to 14 Years | 100 (5.4%) | 248 (11.8%) |
| 15 to 19 Years | 88 (4.8%) | 143 (6.8%) |
| 20 to 24 Years | 198 (10.7%) | 234 (11.2%) |
| 25 to 29 Years | 180 (9.8%) | 113 (5.4%) |
| 30 to 34 Years | 97 (5.3%) | 219 (10.4%) |
| 35 to 39 Years | 141 (7.6%) | 100 (4.8%) |
| 40 to 44 Years | 80 (4.3%) | 135 (6.4%) |
| 45 to 49 Years | 109 (5.9%) | 96 (4.6%) |
| 50 to 54 Years | 112 (6.1%) | 84 (4.0%) |
| 55 to 59 Years | 100 (5.4%) | 69 (3.3%) |
| 60 to 64 Years | 115 (6.2%) | 89 (4.2%) |
| 65 to 69 Years | 49 (2.7%) | 49 (2.3%) |
| 70 to 74 Years | 57 (3.1%) | 73 (3.5%) |
| 75 to 79 Years | 32 (1.7%) | 32 (1.5%) |
| 80 to 84 Years | 3 (0.2%) | 4 (0.2%) |
| 85 Years and over | 0 (0.0%) | 0 (0.0%) |
| Total | 1,842 (100.0%) | 2,099 (100.0%) |
Families and Households in Bystrom
Median Family Size in Bystrom
The median family size in Bystrom is 4.03 persons per family, with married-couple families (494 | 60.1%) accounting for the largest median family size of 4.58 persons per family. On the other hand, single male/father families (89 | 10.8%) represent the smallest median family size with 1.97 persons per family.
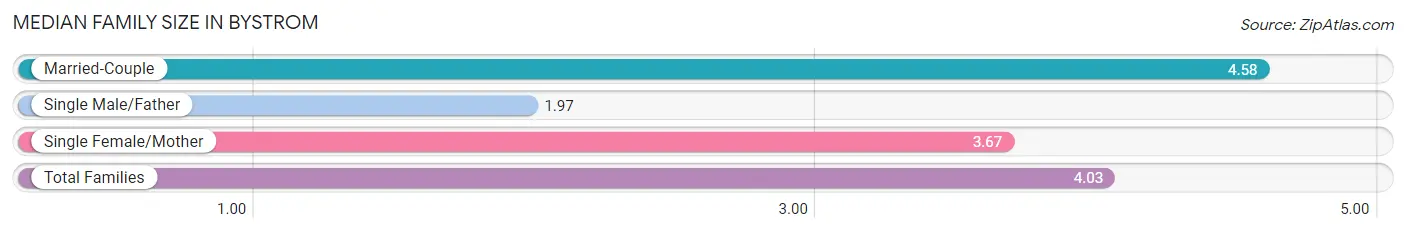
| Family Type | # Families | Family Size |
| Married-Couple | 494 (60.1%) | 4.58 |
| Single Male/Father | 89 (10.8%) | 1.97 |
| Single Female/Mother | 239 (29.1%) | 3.67 |
| Total Families | 822 (100.0%) | 4.03 |
Median Household Size in Bystrom
The median household size in Bystrom is 3.31 persons per household, with married-couple households (494 | 42.1%) accounting for the largest median household size of 4.63 persons per household. non-family households (352 | 30.0%) represent the smallest median household size with 1.21 persons per household.
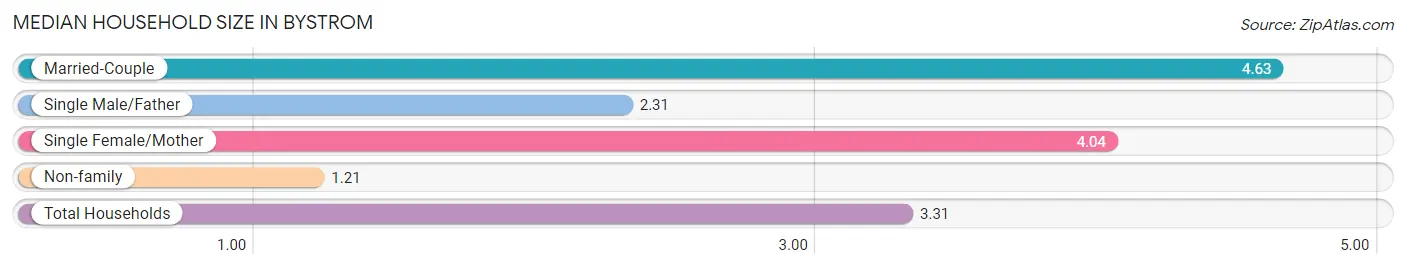
| Household Type | # Households | Household Size |
| Married-Couple | 494 (42.1%) | 4.63 |
| Single Male/Father | 89 (7.6%) | 2.31 |
| Single Female/Mother | 239 (20.4%) | 4.04 |
| Non-family | 352 (30.0%) | 1.21 |
| Total Households | 1,174 (100.0%) | 3.31 |
Household Size by Marriage Status in Bystrom
Out of a total of 1,174 households in Bystrom, 822 (70.0%) are family households, while 352 (30.0%) are nonfamily households. The most numerous type of family households are 4-person households, comprising 217, and the most common type of nonfamily households are 1-person households, comprising 277.
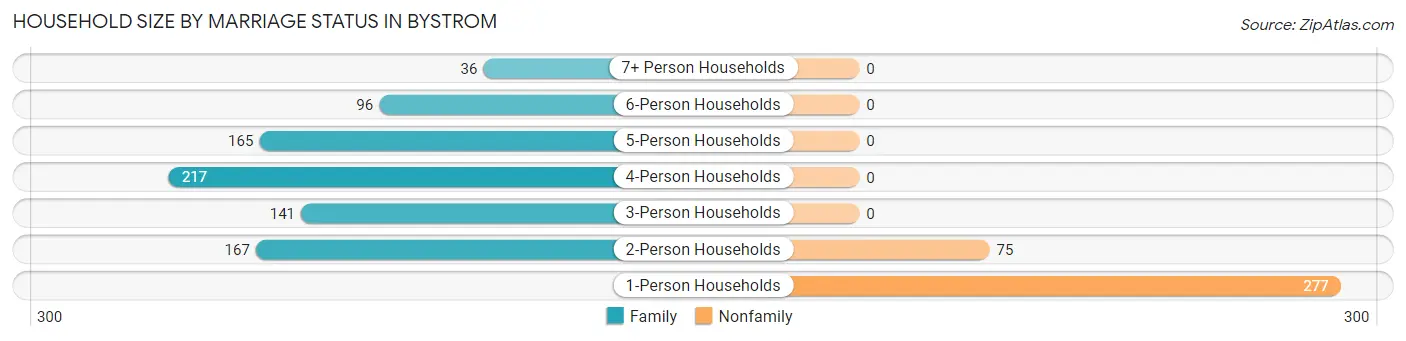
| Household Size | Family Households | Nonfamily Households |
| 1-Person Households | - | 277 (23.6%) |
| 2-Person Households | 167 (14.2%) | 75 (6.4%) |
| 3-Person Households | 141 (12.0%) | 0 (0.0%) |
| 4-Person Households | 217 (18.5%) | 0 (0.0%) |
| 5-Person Households | 165 (14.1%) | 0 (0.0%) |
| 6-Person Households | 96 (8.2%) | 0 (0.0%) |
| 7+ Person Households | 36 (3.1%) | 0 (0.0%) |
| Total | 822 (70.0%) | 352 (30.0%) |
Female Fertility in Bystrom
Fertility by Age in Bystrom
Average fertility rate in Bystrom is 156.0 births per 1,000 women. Women in the age bracket of 15 to 19 years have the highest fertility rate with 280.0 births per 1,000 women. Women in the age bracket of 20 to 34 years acount for 74.7% of all women with births.
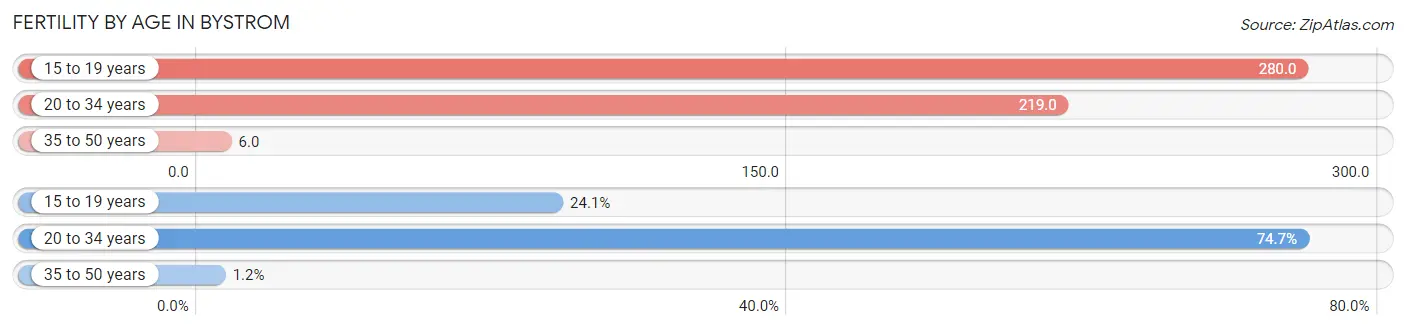
| Age Bracket | Women with Births | Births / 1,000 Women |
| 15 to 19 years | 40 (24.1%) | 280.0 |
| 20 to 34 years | 124 (74.7%) | 219.0 |
| 35 to 50 years | 2 (1.2%) | 6.0 |
| Total | 166 (100.0%) | 156.0 |
Fertility by Age by Marriage Status in Bystrom
22.9% of women with births (166) in Bystrom are married. The highest percentage of unmarried women with births falls into 15 to 19 years age bracket with 100.0% of them unmarried at the time of birth, while the lowest percentage of unmarried women with births belong to 35 to 50 years age bracket with 0.0% of them unmarried.
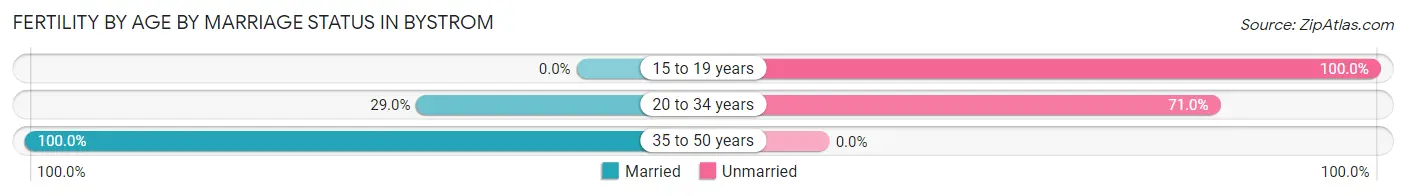
| Age Bracket | Married | Unmarried |
| 15 to 19 years | 0 (0.0%) | 40 (100.0%) |
| 20 to 34 years | 36 (29.0%) | 88 (71.0%) |
| 35 to 50 years | 2 (100.0%) | 0 (0.0%) |
| Total | 38 (22.9%) | 128 (77.1%) |
Fertility by Education in Bystrom
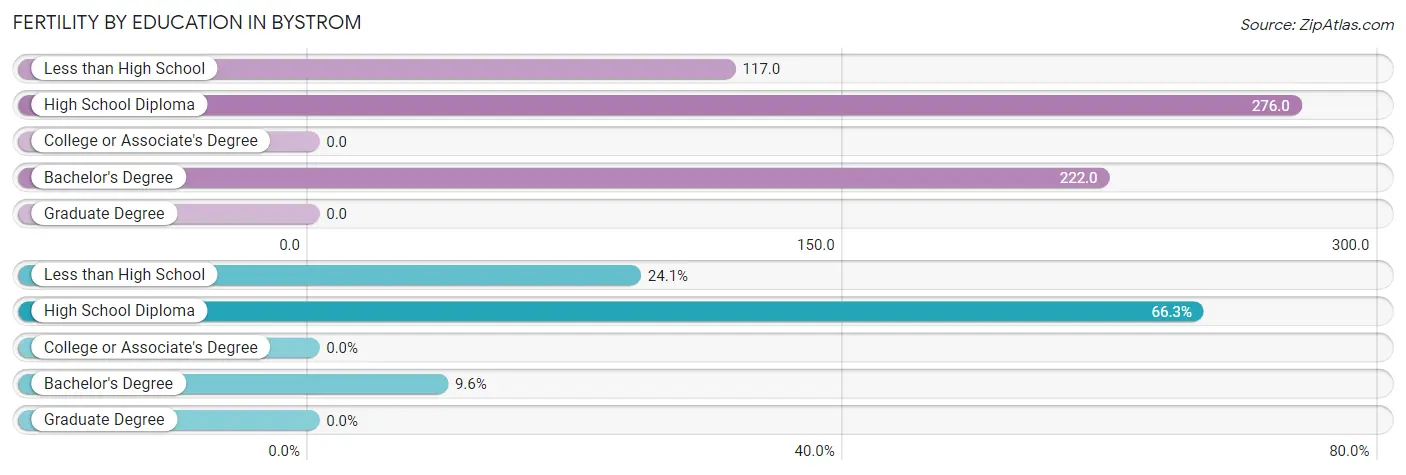
| Educational Attainment | Women with Births | Births / 1,000 Women |
| Less than High School | 40 (24.1%) | 117.0 |
| High School Diploma | 110 (66.3%) | 276.0 |
| College or Associate's Degree | 0 (0.0%) | 0.0 |
| Bachelor's Degree | 16 (9.6%) | 222.0 |
| Graduate Degree | 0 (0.0%) | 0.0 |
| Total | 166 (100.0%) | 156.0 |
Fertility by Education by Marriage Status in Bystrom
77.1% of women with births in Bystrom are unmarried. Women with the educational attainment of bachelor's degree are most likely to be married with 100.0% of them married at childbirth, while women with the educational attainment of less than high school are least likely to be married with 100.0% of them unmarried at childbirth.
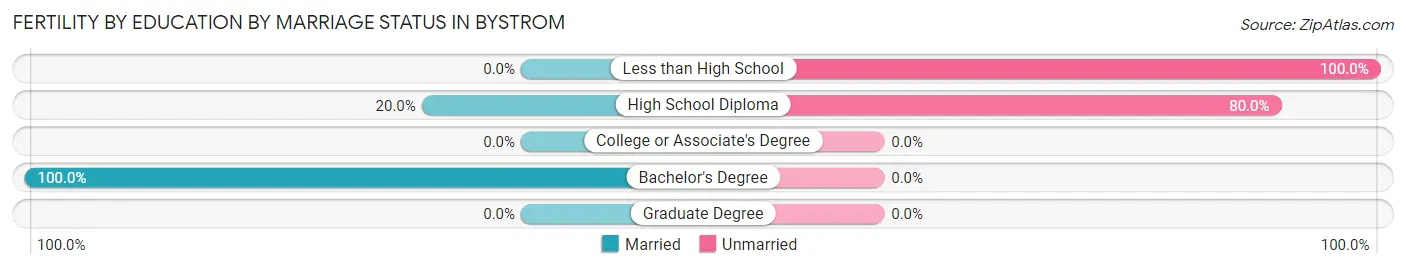
| Educational Attainment | Married | Unmarried |
| Less than High School | 0 (0.0%) | 40 (100.0%) |
| High School Diploma | 22 (20.0%) | 88 (80.0%) |
| College or Associate's Degree | 0 (0.0%) | 0 (0.0%) |
| Bachelor's Degree | 16 (100.0%) | 0 (0.0%) |
| Graduate Degree | 0 (0.0%) | 0 (0.0%) |
| Total | 38 (22.9%) | 128 (77.1%) |
Employment Characteristics in Bystrom
Employment by Class of Employer in Bystrom
Among the 935 employed individuals in Bystrom, private company employees (688 | 73.6%), local government employees (147 | 15.7%), and self-employed (not incorporated) (56 | 6.0%) make up the most common classes of employment.
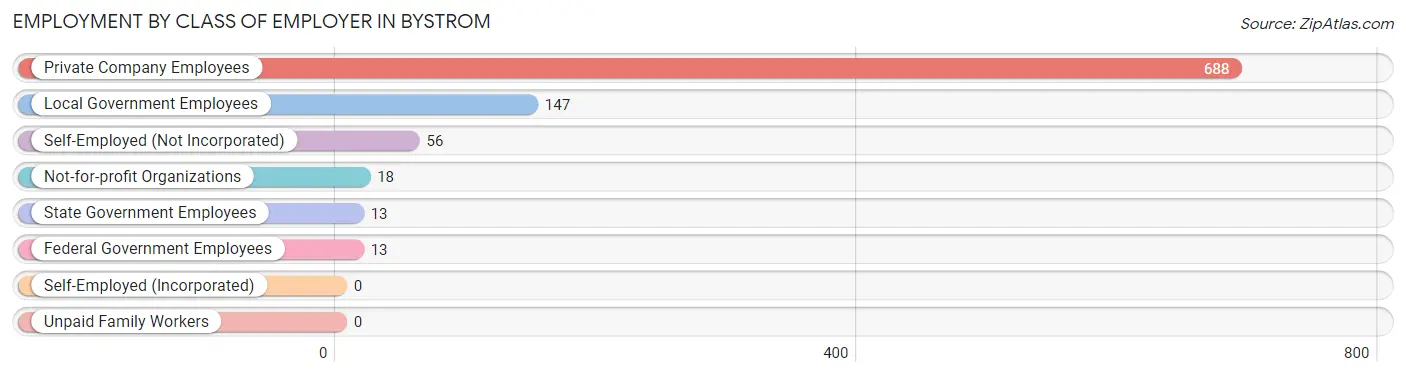
| Employer Class | # Employees | % Employees |
| Private Company Employees | 688 | 73.6% |
| Self-Employed (Incorporated) | 0 | 0.0% |
| Self-Employed (Not Incorporated) | 56 | 6.0% |
| Not-for-profit Organizations | 18 | 1.9% |
| Local Government Employees | 147 | 15.7% |
| State Government Employees | 13 | 1.4% |
| Federal Government Employees | 13 | 1.4% |
| Unpaid Family Workers | 0 | 0.0% |
| Total | 935 | 100.0% |
Employment Status by Age in Bystrom
According to the labor force statistics for Bystrom, out of the total population over 16 years of age (2,721), 49.0% or 1,333 individuals are in the labor force, with 20.6% or 275 of them unemployed. The age group with the highest labor force participation rate is 25 to 29 years, with 89.4% or 262 individuals in the labor force. Within the labor force, the 30 to 34 years age range has the highest percentage of unemployed individuals, with 60.9% or 84 of them being unemployed.
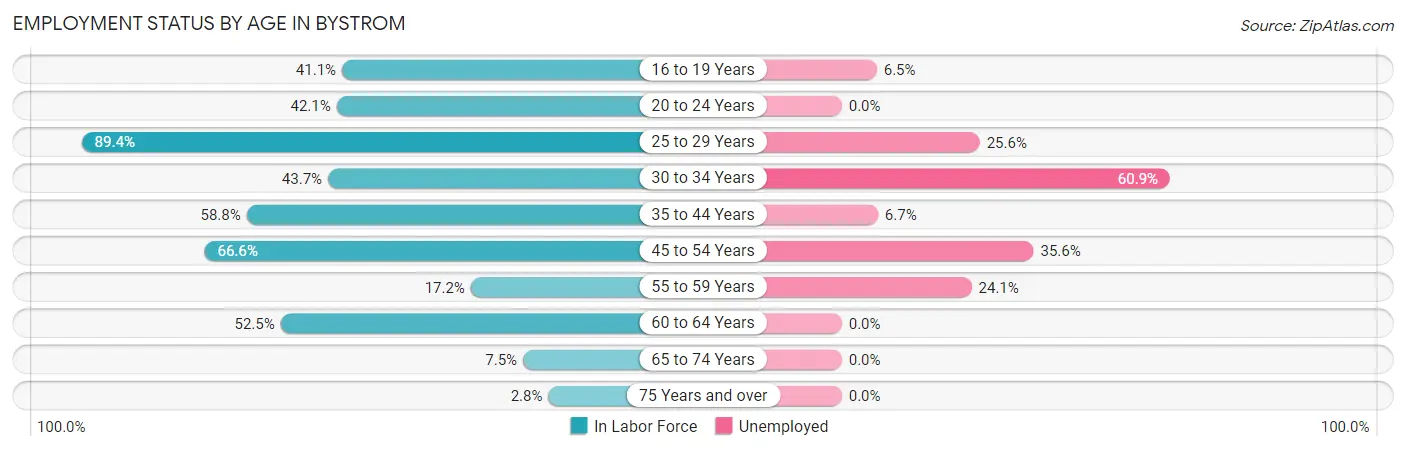
| Age Bracket | In Labor Force | Unemployed |
| 16 to 19 Years | 62 (41.1%) | 4 (6.5%) |
| 20 to 24 Years | 182 (42.1%) | 0 (0.0%) |
| 25 to 29 Years | 262 (89.4%) | 67 (25.6%) |
| 30 to 34 Years | 138 (43.7%) | 84 (60.9%) |
| 35 to 44 Years | 268 (58.8%) | 18 (6.7%) |
| 45 to 54 Years | 267 (66.6%) | 95 (35.6%) |
| 55 to 59 Years | 29 (17.2%) | 7 (24.1%) |
| 60 to 64 Years | 107 (52.5%) | 0 (0.0%) |
| 65 to 74 Years | 17 (7.5%) | 0 (0.0%) |
| 75 Years and over | 2 (2.8%) | 0 (0.0%) |
| Total | 1,333 (49.0%) | 275 (20.6%) |
Employment Status by Educational Attainment in Bystrom
According to labor force statistics for Bystrom, 58.2% of individuals (1,070) out of the total population between 25 and 64 years of age (1,839) are in the labor force, with 25.3% or 271 of them being unemployed. The group with the highest labor force participation rate are those with the educational attainment of bachelor's degree or higher, with 100.0% or 85 individuals in the labor force. Within the labor force, individuals with college / associate degree education have the highest percentage of unemployment, with 42.4% or 154 of them being unemployed.
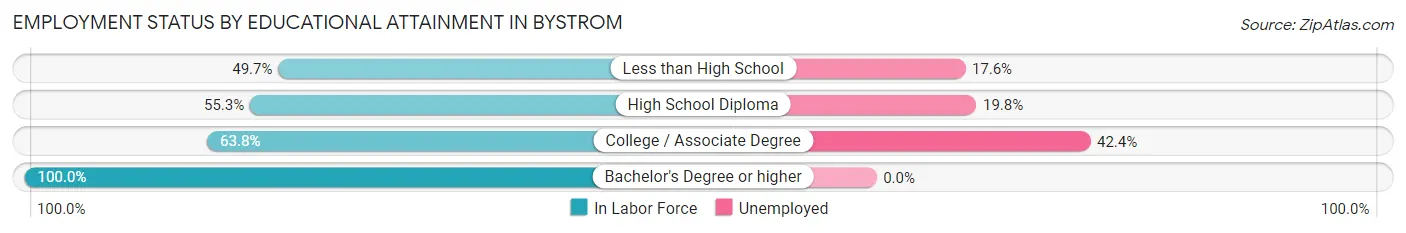
| Educational Attainment | In Labor Force | Unemployed |
| Less than High School | 284 (49.7%) | 101 (17.6%) |
| High School Diploma | 339 (55.3%) | 121 (19.8%) |
| College / Associate Degree | 363 (63.8%) | 241 (42.4%) |
| Bachelor's Degree or higher | 85 (100.0%) | 0 (0.0%) |
| Total | 1,070 (58.2%) | 465 (25.3%) |
Employment Occupations by Sex in Bystrom
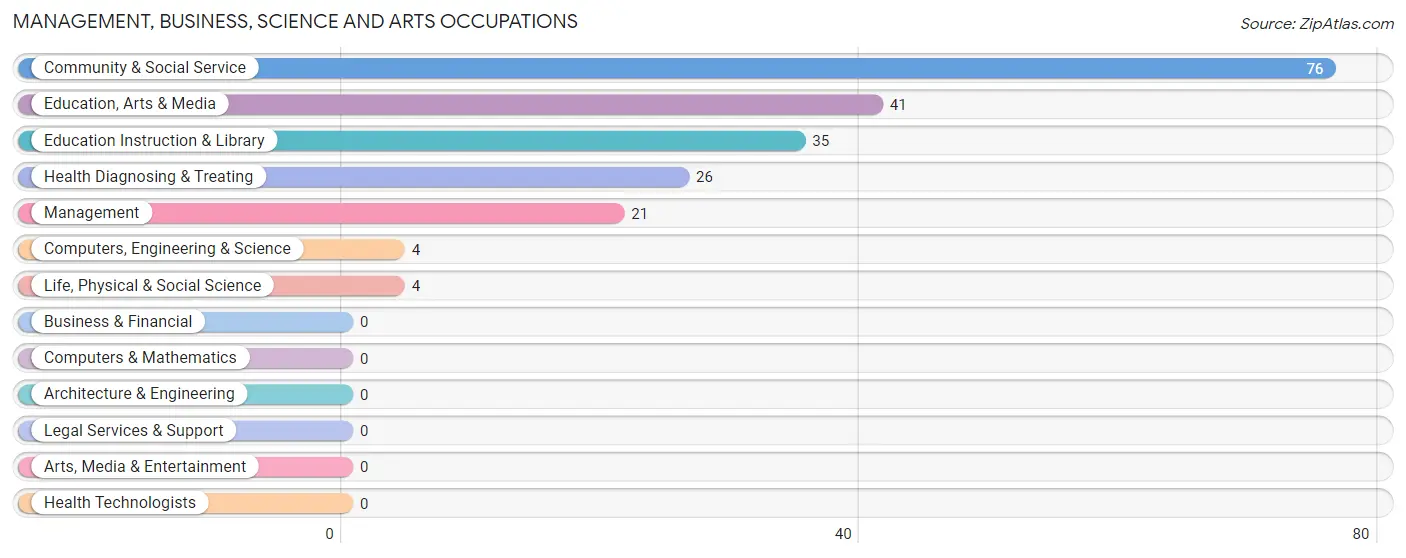
Management, Business, Science and Arts Occupations
The most common Management, Business, Science and Arts occupations in Bystrom are Community & Social Service (76 | 7.2%), Education, Arts & Media (41 | 3.9%), Education Instruction & Library (35 | 3.3%), Health Diagnosing & Treating (26 | 2.5%), and Management (21 | 2.0%).
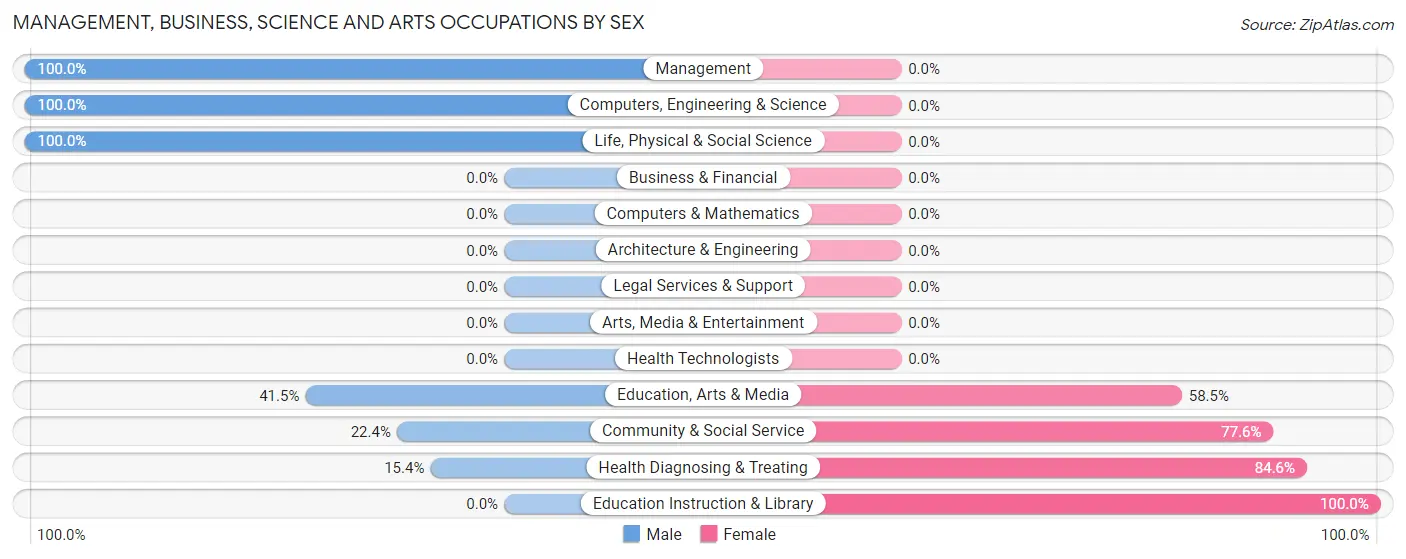
Management, Business, Science and Arts Occupations by Sex
Within the Management, Business, Science and Arts occupations in Bystrom, the most male-oriented occupations are Management (100.0%), Computers, Engineering & Science (100.0%), and Life, Physical & Social Science (100.0%), while the most female-oriented occupations are Education Instruction & Library (100.0%), Health Diagnosing & Treating (84.6%), and Community & Social Service (77.6%).
| Occupation | Male | Female |
| Management | 21 (100.0%) | 0 (0.0%) |
| Business & Financial | 0 (0.0%) | 0 (0.0%) |
| Computers, Engineering & Science | 4 (100.0%) | 0 (0.0%) |
| Computers & Mathematics | 0 (0.0%) | 0 (0.0%) |
| Architecture & Engineering | 0 (0.0%) | 0 (0.0%) |
| Life, Physical & Social Science | 4 (100.0%) | 0 (0.0%) |
| Community & Social Service | 17 (22.4%) | 59 (77.6%) |
| Education, Arts & Media | 17 (41.5%) | 24 (58.5%) |
| Legal Services & Support | 0 (0.0%) | 0 (0.0%) |
| Education Instruction & Library | 0 (0.0%) | 35 (100.0%) |
| Arts, Media & Entertainment | 0 (0.0%) | 0 (0.0%) |
| Health Diagnosing & Treating | 4 (15.4%) | 22 (84.6%) |
| Health Technologists | 0 (0.0%) | 0 (0.0%) |
| Total (Category) | 46 (36.2%) | 81 (63.8%) |
| Total (Overall) | 650 (61.4%) | 409 (38.6%) |
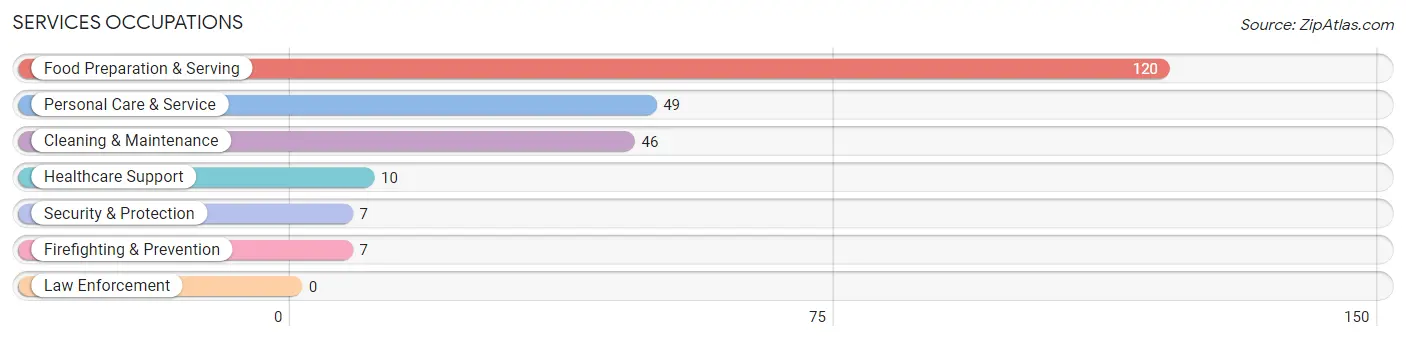
Services Occupations
The most common Services occupations in Bystrom are Food Preparation & Serving (120 | 11.3%), Personal Care & Service (49 | 4.6%), Cleaning & Maintenance (46 | 4.3%), Healthcare Support (10 | 0.9%), and Security & Protection (7 | 0.7%).
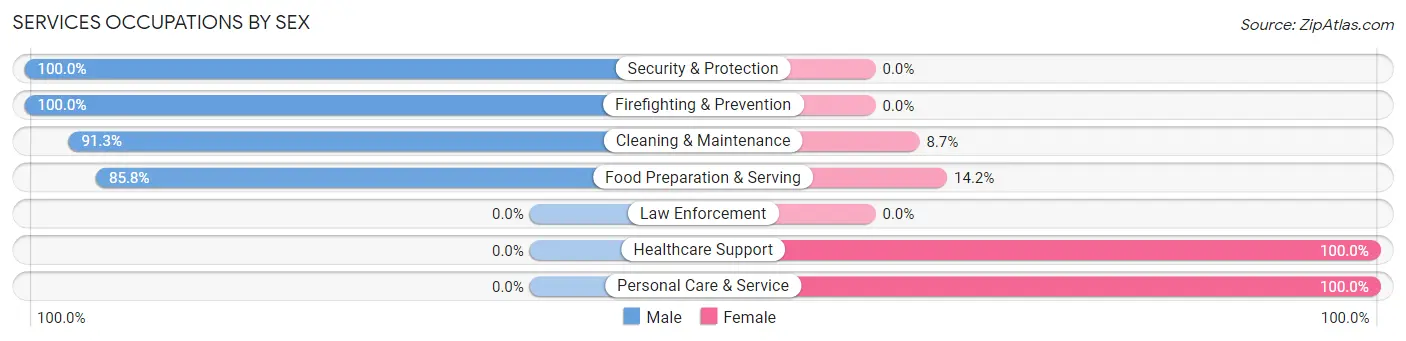
Services Occupations by Sex
Within the Services occupations in Bystrom, the most male-oriented occupations are Security & Protection (100.0%), Firefighting & Prevention (100.0%), and Cleaning & Maintenance (91.3%), while the most female-oriented occupations are Healthcare Support (100.0%), Personal Care & Service (100.0%), and Food Preparation & Serving (14.2%).
| Occupation | Male | Female |
| Healthcare Support | 0 (0.0%) | 10 (100.0%) |
| Security & Protection | 7 (100.0%) | 0 (0.0%) |
| Firefighting & Prevention | 7 (100.0%) | 0 (0.0%) |
| Law Enforcement | 0 (0.0%) | 0 (0.0%) |
| Food Preparation & Serving | 103 (85.8%) | 17 (14.2%) |
| Cleaning & Maintenance | 42 (91.3%) | 4 (8.7%) |
| Personal Care & Service | 0 (0.0%) | 49 (100.0%) |
| Total (Category) | 152 (65.5%) | 80 (34.5%) |
| Total (Overall) | 650 (61.4%) | 409 (38.6%) |
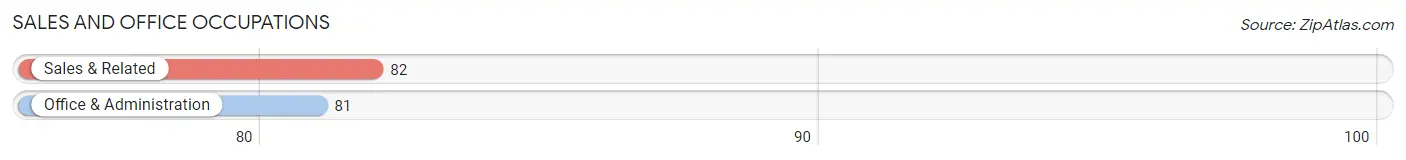
Sales and Office Occupations
The most common Sales and Office occupations in Bystrom are Sales & Related (82 | 7.7%), and Office & Administration (81 | 7.6%).
Sales and Office Occupations by Sex
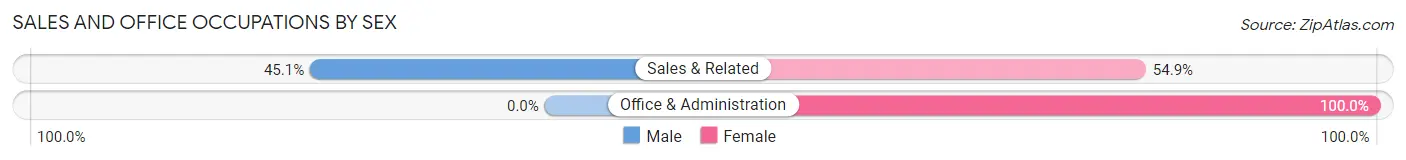
| Occupation | Male | Female |
| Sales & Related | 37 (45.1%) | 45 (54.9%) |
| Office & Administration | 0 (0.0%) | 81 (100.0%) |
| Total (Category) | 37 (22.7%) | 126 (77.3%) |
| Total (Overall) | 650 (61.4%) | 409 (38.6%) |
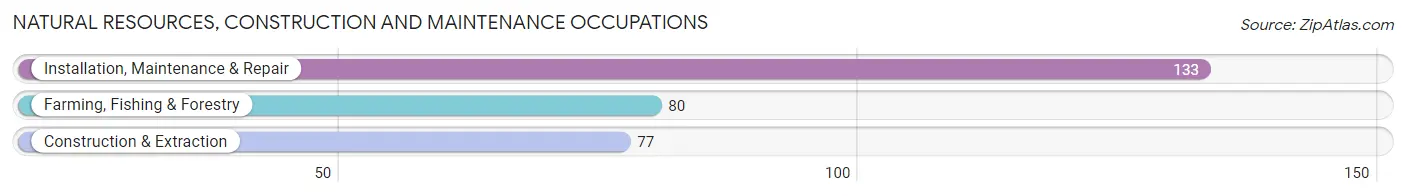
Natural Resources, Construction and Maintenance Occupations
The most common Natural Resources, Construction and Maintenance occupations in Bystrom are Installation, Maintenance & Repair (133 | 12.6%), Farming, Fishing & Forestry (80 | 7.5%), and Construction & Extraction (77 | 7.3%).
Natural Resources, Construction and Maintenance Occupations by Sex
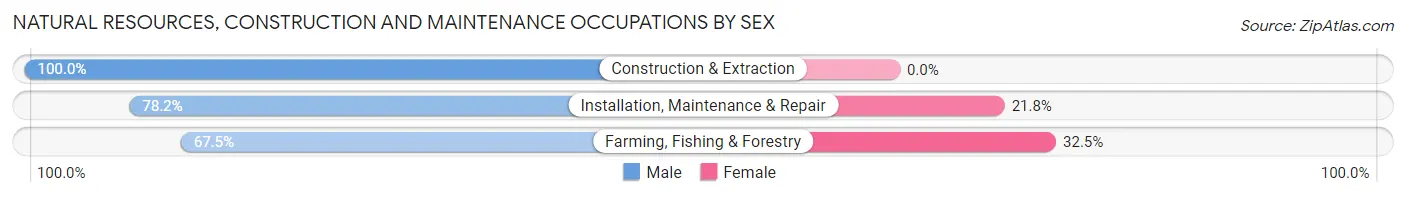
| Occupation | Male | Female |
| Farming, Fishing & Forestry | 54 (67.5%) | 26 (32.5%) |
| Construction & Extraction | 77 (100.0%) | 0 (0.0%) |
| Installation, Maintenance & Repair | 104 (78.2%) | 29 (21.8%) |
| Total (Category) | 235 (81.0%) | 55 (19.0%) |
| Total (Overall) | 650 (61.4%) | 409 (38.6%) |
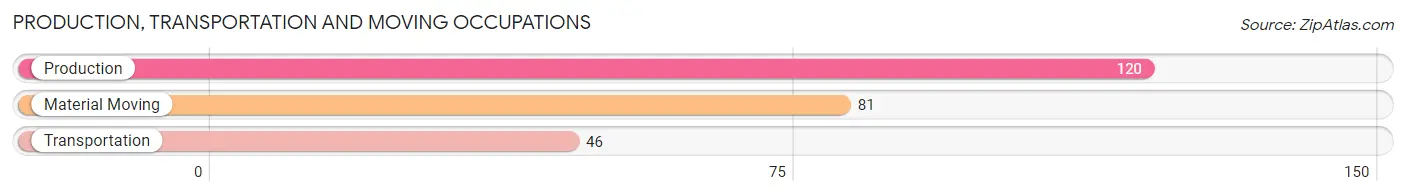
Production, Transportation and Moving Occupations
The most common Production, Transportation and Moving occupations in Bystrom are Production (120 | 11.3%), Material Moving (81 | 7.6%), and Transportation (46 | 4.3%).
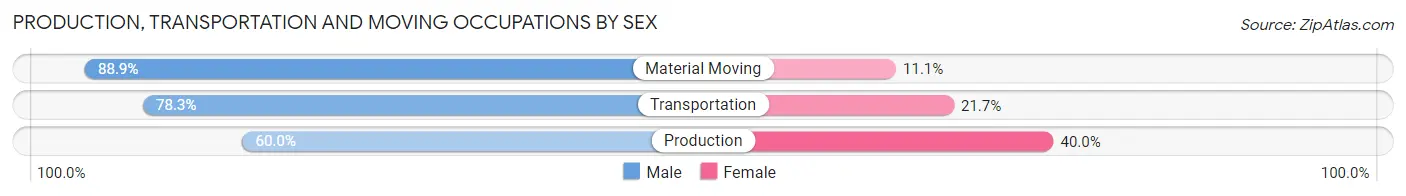
Production, Transportation and Moving Occupations by Sex
| Occupation | Male | Female |
| Production | 72 (60.0%) | 48 (40.0%) |
| Transportation | 36 (78.3%) | 10 (21.7%) |
| Material Moving | 72 (88.9%) | 9 (11.1%) |
| Total (Category) | 180 (72.9%) | 67 (27.1%) |
| Total (Overall) | 650 (61.4%) | 409 (38.6%) |
Employment Industries by Sex in Bystrom
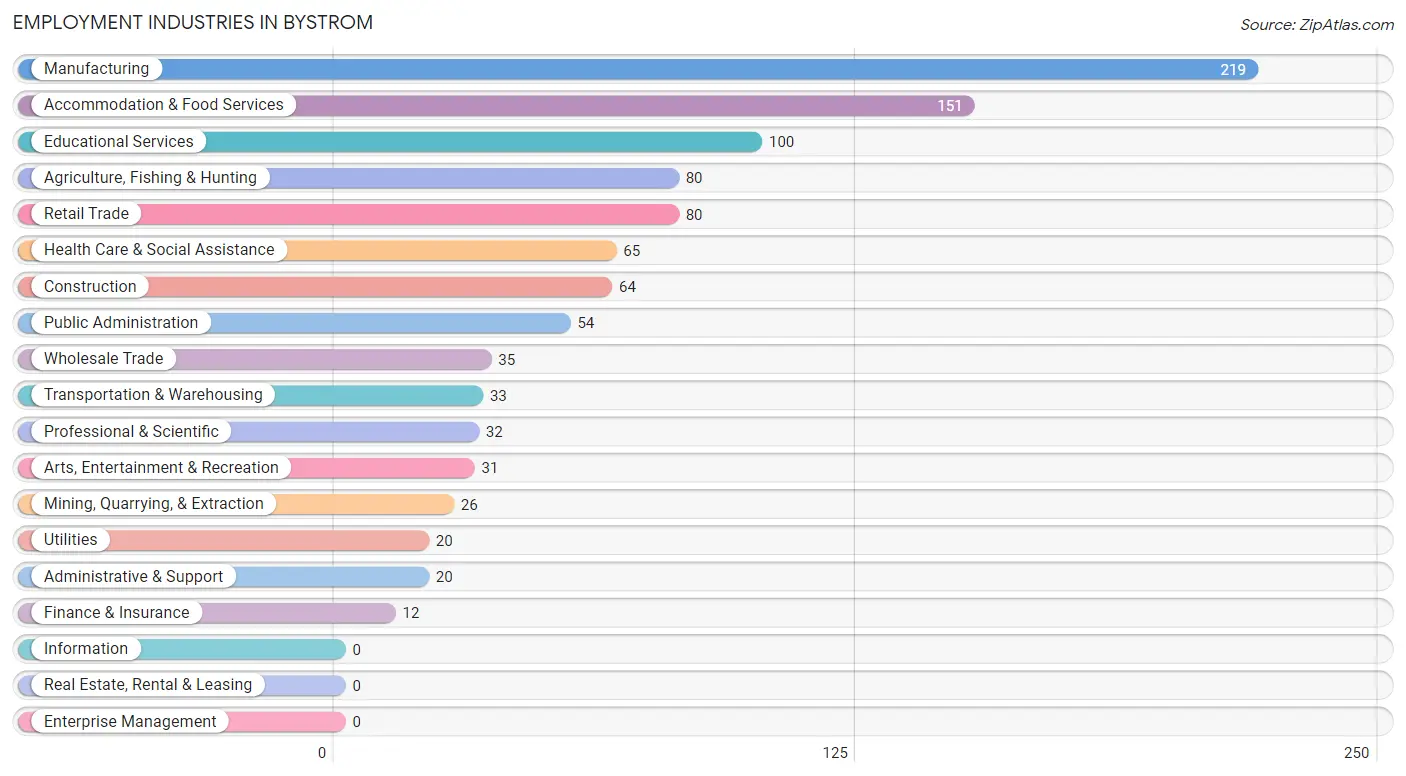
Employment Industries in Bystrom
The major employment industries in Bystrom include Manufacturing (219 | 20.7%), Accommodation & Food Services (151 | 14.3%), Educational Services (100 | 9.4%), Agriculture, Fishing & Hunting (80 | 7.5%), and Retail Trade (80 | 7.5%).
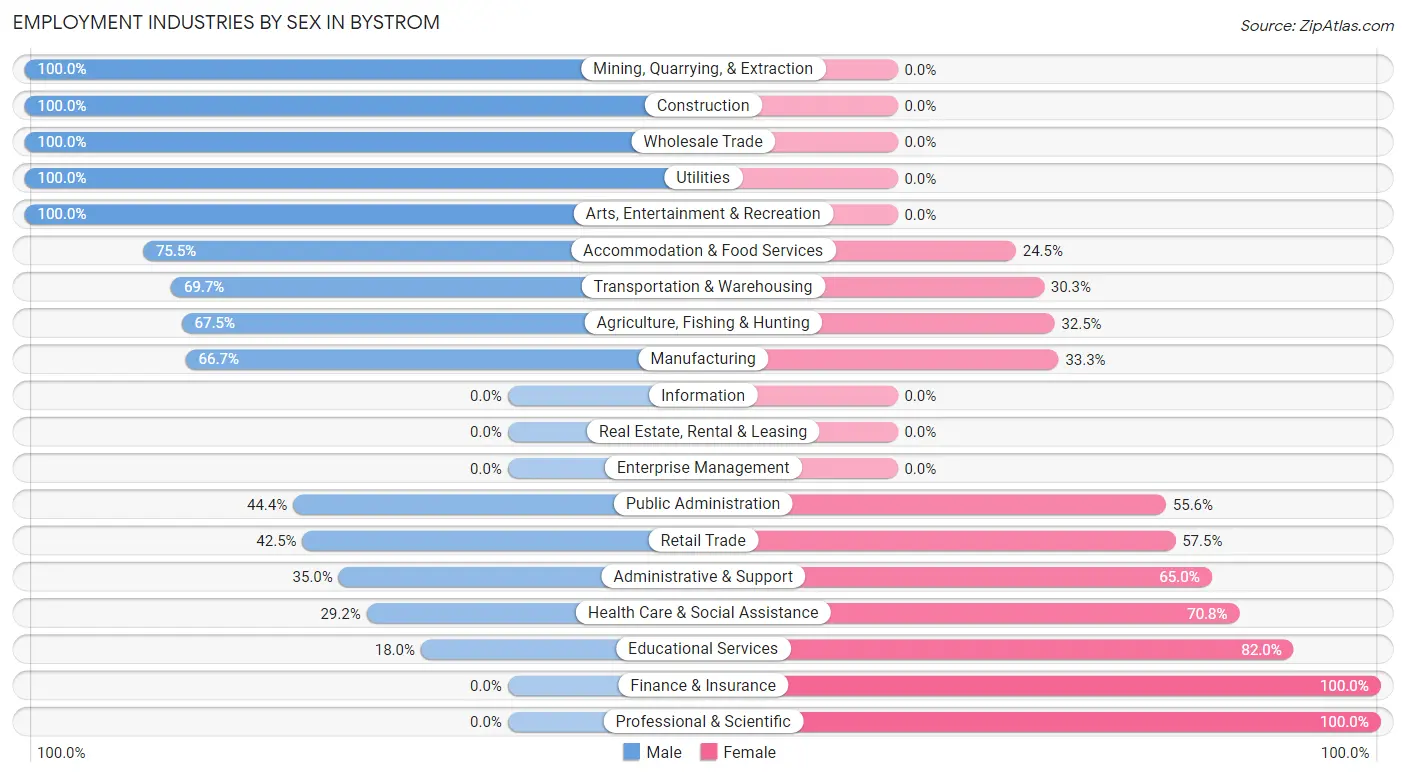
Employment Industries by Sex in Bystrom
The Bystrom industries that see more men than women are Mining, Quarrying, & Extraction (100.0%), Construction (100.0%), and Wholesale Trade (100.0%), whereas the industries that tend to have a higher number of women are Finance & Insurance (100.0%), Professional & Scientific (100.0%), and Educational Services (82.0%).
| Industry | Male | Female |
| Agriculture, Fishing & Hunting | 54 (67.5%) | 26 (32.5%) |
| Mining, Quarrying, & Extraction | 26 (100.0%) | 0 (0.0%) |
| Construction | 64 (100.0%) | 0 (0.0%) |
| Manufacturing | 146 (66.7%) | 73 (33.3%) |
| Wholesale Trade | 35 (100.0%) | 0 (0.0%) |
| Retail Trade | 34 (42.5%) | 46 (57.5%) |
| Transportation & Warehousing | 23 (69.7%) | 10 (30.3%) |
| Utilities | 20 (100.0%) | 0 (0.0%) |
| Information | 0 (0.0%) | 0 (0.0%) |
| Finance & Insurance | 0 (0.0%) | 12 (100.0%) |
| Real Estate, Rental & Leasing | 0 (0.0%) | 0 (0.0%) |
| Professional & Scientific | 0 (0.0%) | 32 (100.0%) |
| Enterprise Management | 0 (0.0%) | 0 (0.0%) |
| Administrative & Support | 7 (35.0%) | 13 (65.0%) |
| Educational Services | 18 (18.0%) | 82 (82.0%) |
| Health Care & Social Assistance | 19 (29.2%) | 46 (70.8%) |
| Arts, Entertainment & Recreation | 31 (100.0%) | 0 (0.0%) |
| Accommodation & Food Services | 114 (75.5%) | 37 (24.5%) |
| Public Administration | 24 (44.4%) | 30 (55.6%) |
| Total | 650 (61.4%) | 409 (38.6%) |
Education in Bystrom
School Enrollment in Bystrom
The most common levels of schooling among the 1,152 students in Bystrom are elementary school (338 | 29.3%), middle school (274 | 23.8%), and high school (240 | 20.8%).
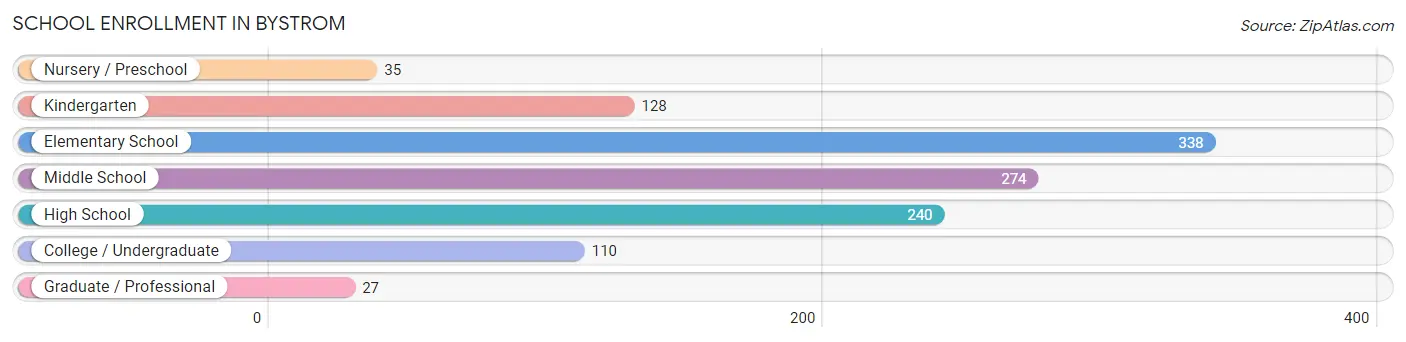
| School Level | # Students | % Students |
| Nursery / Preschool | 35 | 3.0% |
| Kindergarten | 128 | 11.1% |
| Elementary School | 338 | 29.3% |
| Middle School | 274 | 23.8% |
| High School | 240 | 20.8% |
| College / Undergraduate | 110 | 9.6% |
| Graduate / Professional | 27 | 2.3% |
| Total | 1,152 | 100.0% |
School Enrollment by Age by Funding Source in Bystrom
Out of a total of 1,152 students who are enrolled in schools in Bystrom, 30 (2.6%) attend a private institution, while the remaining 1,122 (97.4%) are enrolled in public schools. The age group of 3 to 4 year olds has the highest likelihood of being enrolled in private schools, with 7 (7.9% in the age bracket) enrolled. Conversely, the age group of 15 to 17 year olds has the lowest likelihood of being enrolled in a private school, with 126 (100.0% in the age bracket) attending a public institution.
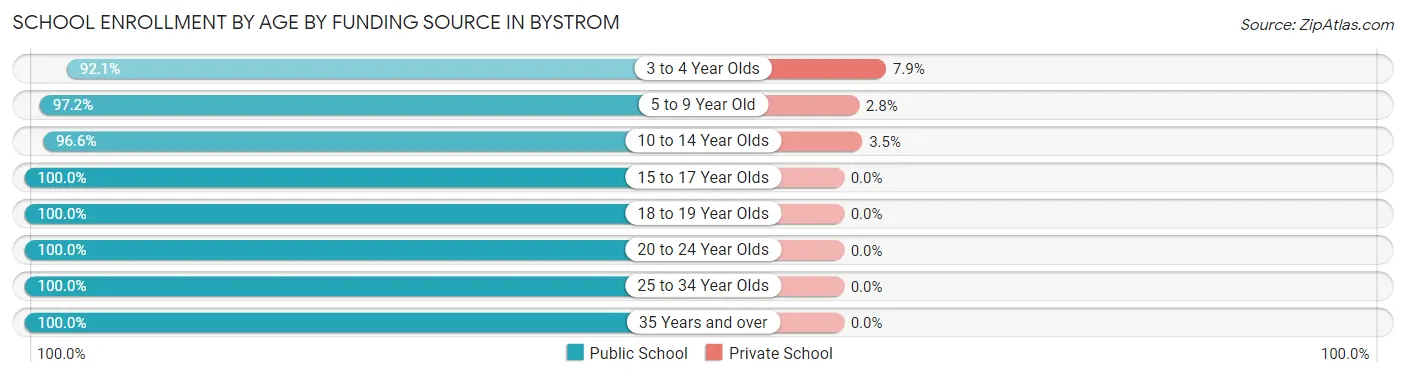
| Age Bracket | Public School | Private School |
| 3 to 4 Year Olds | 82 (92.1%) | 7 (7.9%) |
| 5 to 9 Year Old | 377 (97.2%) | 11 (2.8%) |
| 10 to 14 Year Olds | 336 (96.6%) | 12 (3.5%) |
| 15 to 17 Year Olds | 126 (100.0%) | 0 (0.0%) |
| 18 to 19 Year Olds | 67 (100.0%) | 0 (0.0%) |
| 20 to 24 Year Olds | 65 (100.0%) | 0 (0.0%) |
| 25 to 34 Year Olds | 56 (100.0%) | 0 (0.0%) |
| 35 Years and over | 13 (100.0%) | 0 (0.0%) |
| Total | 1,122 (97.4%) | 30 (2.6%) |
Educational Attainment by Field of Study in Bystrom
Liberal arts & history (58 | 35.1%), education (39 | 23.6%), social sciences (32 | 19.4%), arts & humanities (22 | 13.3%), and psychology (14 | 8.5%) are the most common fields of study among 165 individuals in Bystrom who have obtained a bachelor's degree or higher.
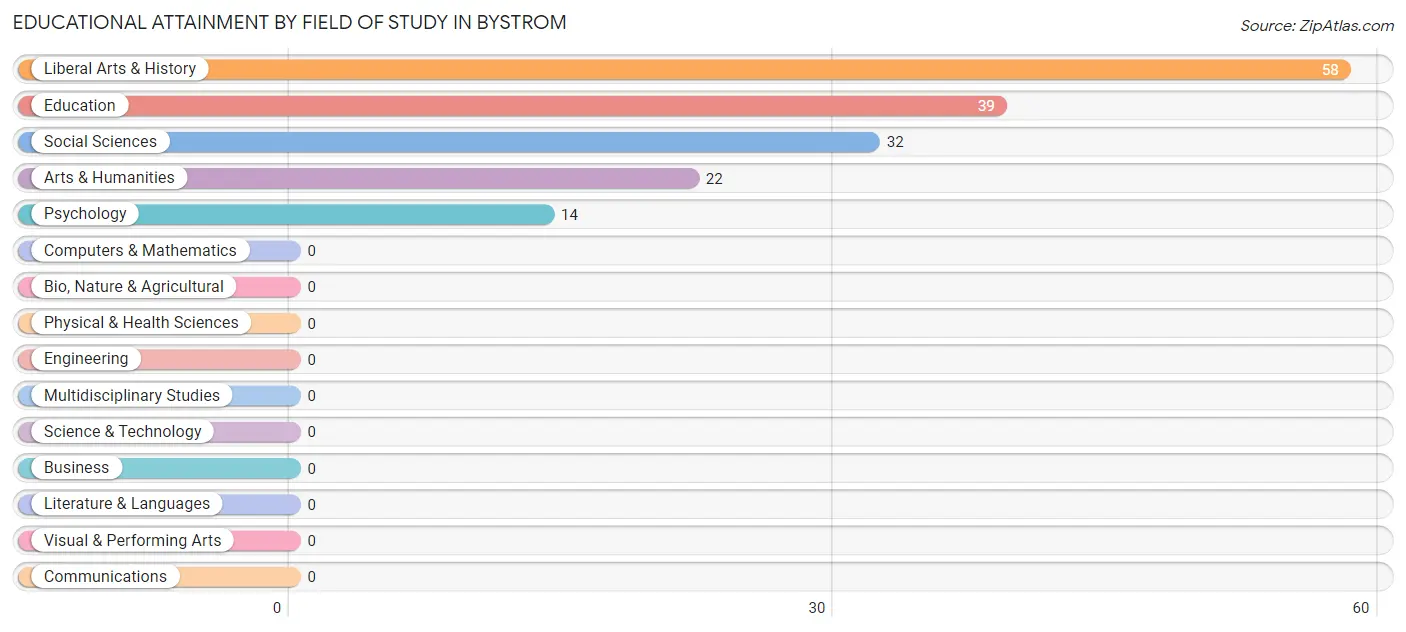
| Field of Study | # Graduates | % Graduates |
| Computers & Mathematics | 0 | 0.0% |
| Bio, Nature & Agricultural | 0 | 0.0% |
| Physical & Health Sciences | 0 | 0.0% |
| Psychology | 14 | 8.5% |
| Social Sciences | 32 | 19.4% |
| Engineering | 0 | 0.0% |
| Multidisciplinary Studies | 0 | 0.0% |
| Science & Technology | 0 | 0.0% |
| Business | 0 | 0.0% |
| Education | 39 | 23.6% |
| Literature & Languages | 0 | 0.0% |
| Liberal Arts & History | 58 | 35.1% |
| Visual & Performing Arts | 0 | 0.0% |
| Communications | 0 | 0.0% |
| Arts & Humanities | 22 | 13.3% |
| Total | 165 | 100.0% |
Transportation & Commute in Bystrom
Vehicle Availability by Sex in Bystrom
The most prevalent vehicle ownership categories in Bystrom are males with 2 vehicles (184, accounting for 31.7%) and females with 2 vehicles (157, making up 53.0%).
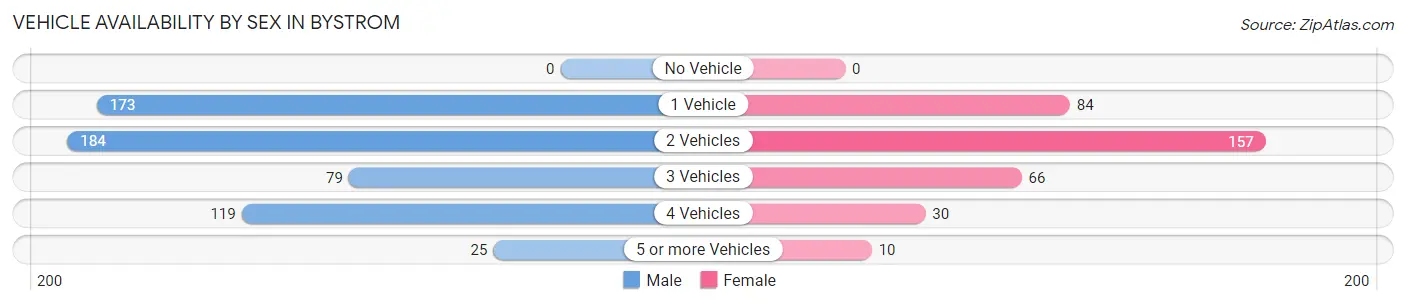
| Vehicles Available | Male | Female |
| No Vehicle | 0 (0.0%) | 0 (0.0%) |
| 1 Vehicle | 173 (29.8%) | 84 (24.2%) |
| 2 Vehicles | 184 (31.7%) | 157 (45.2%) |
| 3 Vehicles | 79 (13.6%) | 66 (19.0%) |
| 4 Vehicles | 119 (20.5%) | 30 (8.6%) |
| 5 or more Vehicles | 25 (4.3%) | 10 (2.9%) |
| Total | 580 (100.0%) | 347 (100.0%) |
Commute Time in Bystrom
The most frequently occuring commute durations in Bystrom are 30 to 34 minutes (162 commuters, 17.6%), 10 to 14 minutes (141 commuters, 15.4%), and 15 to 19 minutes (119 commuters, 13.0%).
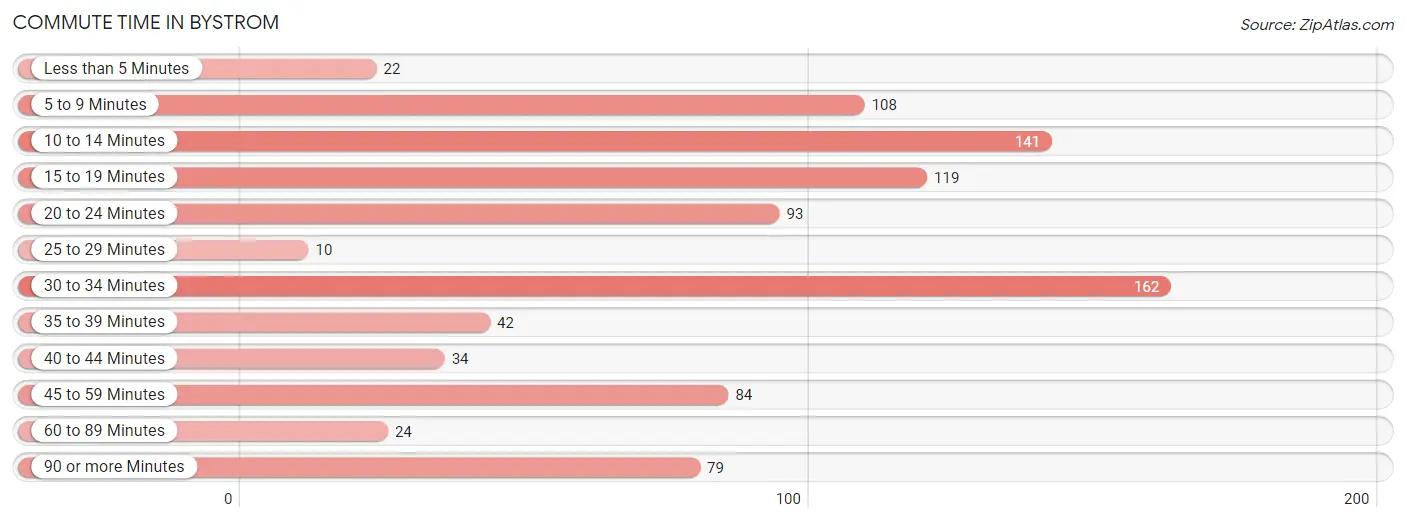
| Commute Time | # Commuters | % Commuters |
| Less than 5 Minutes | 22 | 2.4% |
| 5 to 9 Minutes | 108 | 11.8% |
| 10 to 14 Minutes | 141 | 15.4% |
| 15 to 19 Minutes | 119 | 13.0% |
| 20 to 24 Minutes | 93 | 10.1% |
| 25 to 29 Minutes | 10 | 1.1% |
| 30 to 34 Minutes | 162 | 17.6% |
| 35 to 39 Minutes | 42 | 4.6% |
| 40 to 44 Minutes | 34 | 3.7% |
| 45 to 59 Minutes | 84 | 9.1% |
| 60 to 89 Minutes | 24 | 2.6% |
| 90 or more Minutes | 79 | 8.6% |
Commute Time by Sex in Bystrom
The most common commute times in Bystrom are 30 to 34 minutes (110 commuters, 19.0%) for males and 10 to 14 minutes (84 commuters, 24.8%) for females.
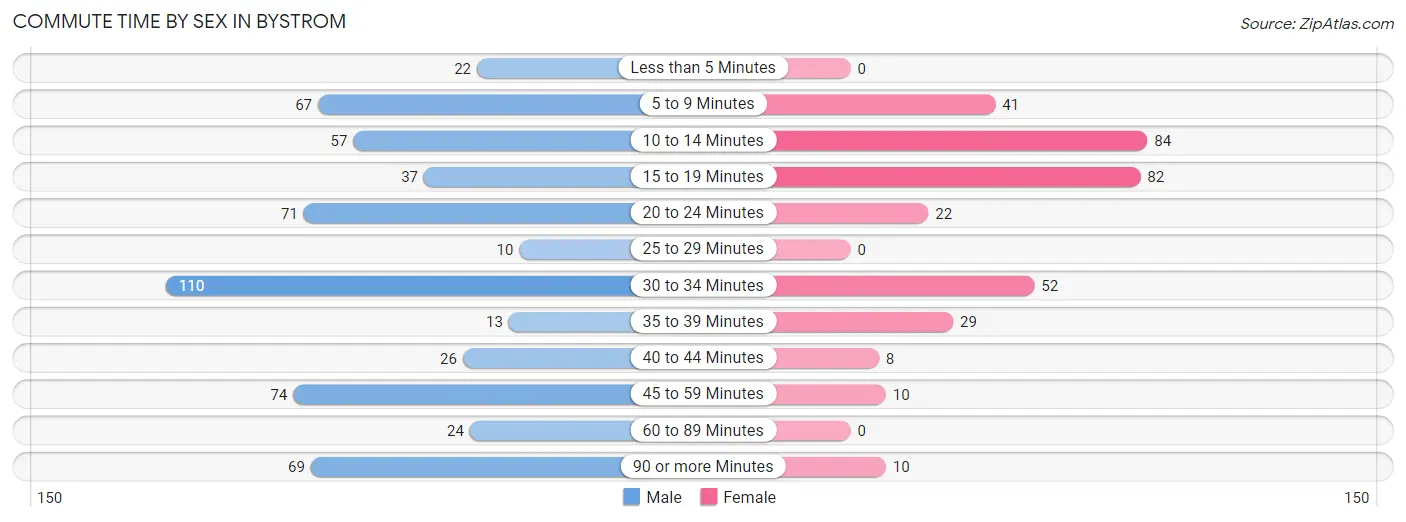
| Commute Time | Male | Female |
| Less than 5 Minutes | 22 (3.8%) | 0 (0.0%) |
| 5 to 9 Minutes | 67 (11.6%) | 41 (12.1%) |
| 10 to 14 Minutes | 57 (9.8%) | 84 (24.8%) |
| 15 to 19 Minutes | 37 (6.4%) | 82 (24.3%) |
| 20 to 24 Minutes | 71 (12.2%) | 22 (6.5%) |
| 25 to 29 Minutes | 10 (1.7%) | 0 (0.0%) |
| 30 to 34 Minutes | 110 (19.0%) | 52 (15.4%) |
| 35 to 39 Minutes | 13 (2.2%) | 29 (8.6%) |
| 40 to 44 Minutes | 26 (4.5%) | 8 (2.4%) |
| 45 to 59 Minutes | 74 (12.8%) | 10 (3.0%) |
| 60 to 89 Minutes | 24 (4.1%) | 0 (0.0%) |
| 90 or more Minutes | 69 (11.9%) | 10 (3.0%) |
Time of Departure to Work by Sex in Bystrom
The most frequent times of departure to work in Bystrom are 7:00 AM to 7:29 AM (120, 20.7%) for males and 4:00 PM to 11:59 PM (90, 26.6%) for females.
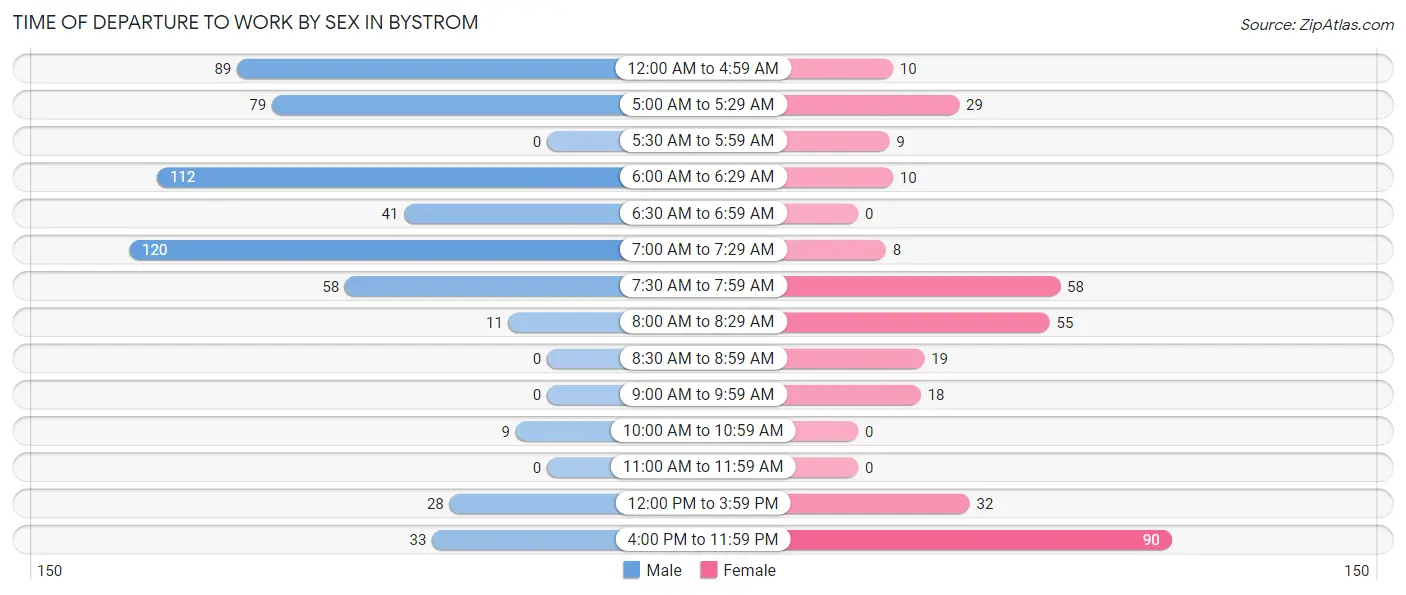
| Time of Departure | Male | Female |
| 12:00 AM to 4:59 AM | 89 (15.3%) | 10 (3.0%) |
| 5:00 AM to 5:29 AM | 79 (13.6%) | 29 (8.6%) |
| 5:30 AM to 5:59 AM | 0 (0.0%) | 9 (2.7%) |
| 6:00 AM to 6:29 AM | 112 (19.3%) | 10 (3.0%) |
| 6:30 AM to 6:59 AM | 41 (7.1%) | 0 (0.0%) |
| 7:00 AM to 7:29 AM | 120 (20.7%) | 8 (2.4%) |
| 7:30 AM to 7:59 AM | 58 (10.0%) | 58 (17.2%) |
| 8:00 AM to 8:29 AM | 11 (1.9%) | 55 (16.3%) |
| 8:30 AM to 8:59 AM | 0 (0.0%) | 19 (5.6%) |
| 9:00 AM to 9:59 AM | 0 (0.0%) | 18 (5.3%) |
| 10:00 AM to 10:59 AM | 9 (1.5%) | 0 (0.0%) |
| 11:00 AM to 11:59 AM | 0 (0.0%) | 0 (0.0%) |
| 12:00 PM to 3:59 PM | 28 (4.8%) | 32 (9.5%) |
| 4:00 PM to 11:59 PM | 33 (5.7%) | 90 (26.6%) |
| Total | 580 (100.0%) | 338 (100.0%) |
Housing Occupancy in Bystrom
Occupancy by Ownership in Bystrom
Of the total 1,174 dwellings in Bystrom, owner-occupied units account for 649 (55.3%), while renter-occupied units make up 525 (44.7%).
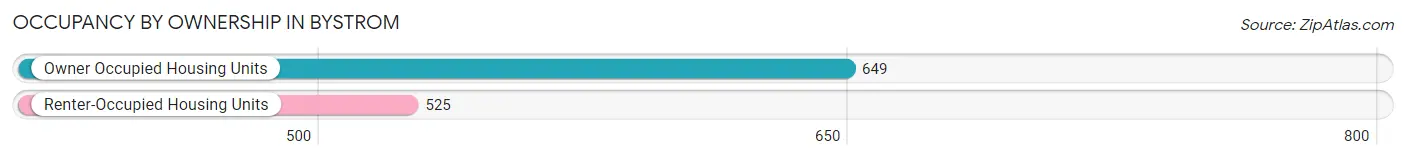
| Occupancy | # Housing Units | % Housing Units |
| Owner Occupied Housing Units | 649 | 55.3% |
| Renter-Occupied Housing Units | 525 | 44.7% |
| Total Occupied Housing Units | 1,174 | 100.0% |
Occupancy by Household Size in Bystrom
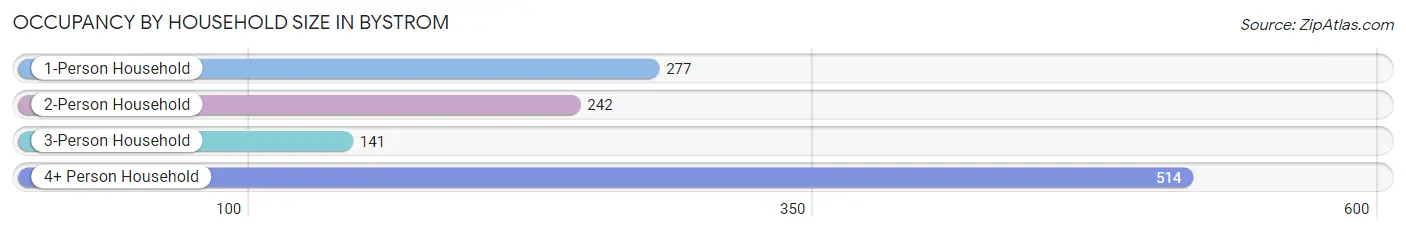
| Household Size | # Housing Units | % Housing Units |
| 1-Person Household | 277 | 23.6% |
| 2-Person Household | 242 | 20.6% |
| 3-Person Household | 141 | 12.0% |
| 4+ Person Household | 514 | 43.8% |
| Total Housing Units | 1,174 | 100.0% |
Occupancy by Ownership by Household Size in Bystrom
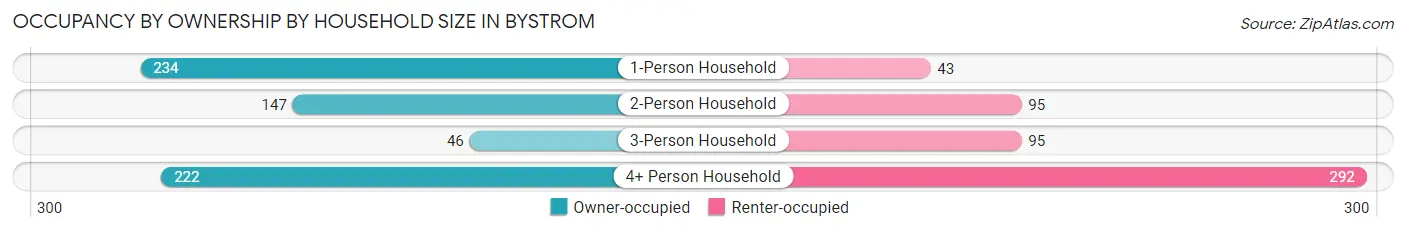
| Household Size | Owner-occupied | Renter-occupied |
| 1-Person Household | 234 (84.5%) | 43 (15.5%) |
| 2-Person Household | 147 (60.7%) | 95 (39.3%) |
| 3-Person Household | 46 (32.6%) | 95 (67.4%) |
| 4+ Person Household | 222 (43.2%) | 292 (56.8%) |
| Total Housing Units | 649 (55.3%) | 525 (44.7%) |
Occupancy by Educational Attainment in Bystrom
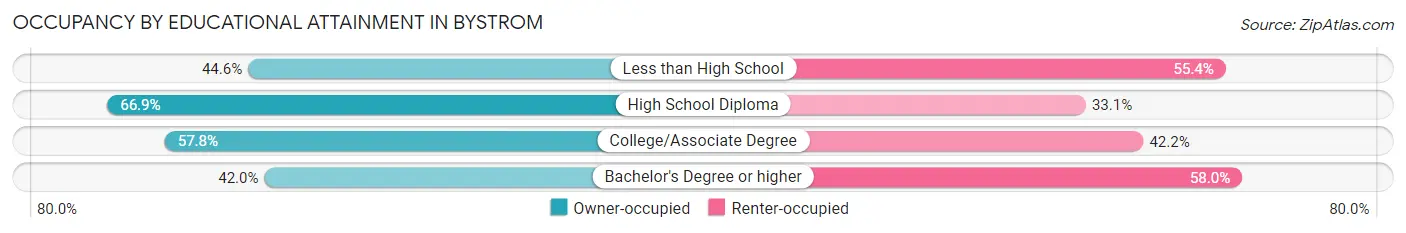
| Household Size | Owner-occupied | Renter-occupied |
| Less than High School | 152 (44.6%) | 189 (55.4%) |
| High School Diploma | 210 (66.9%) | 104 (33.1%) |
| College/Associate Degree | 253 (57.8%) | 185 (42.2%) |
| Bachelor's Degree or higher | 34 (42.0%) | 47 (58.0%) |
Occupancy by Age of Householder in Bystrom
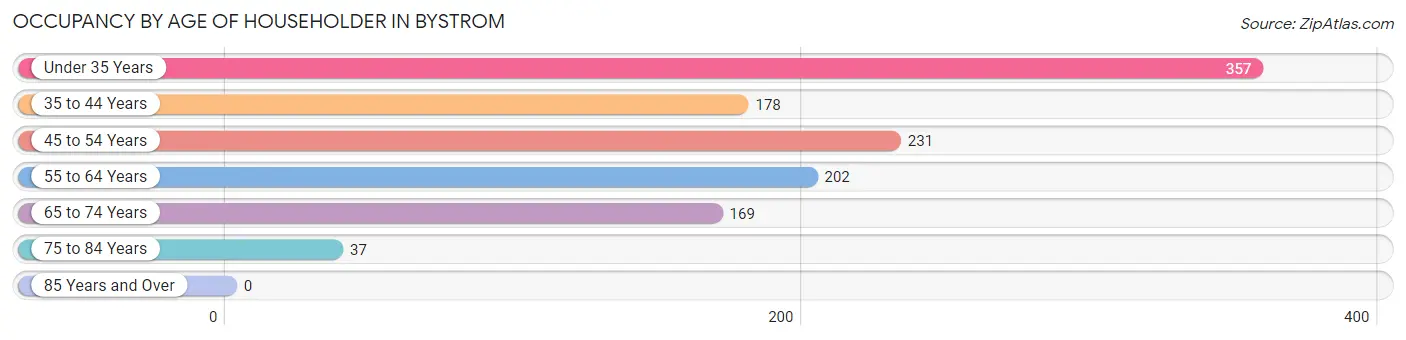
| Age Bracket | # Households | % Households |
| Under 35 Years | 357 | 30.4% |
| 35 to 44 Years | 178 | 15.2% |
| 45 to 54 Years | 231 | 19.7% |
| 55 to 64 Years | 202 | 17.2% |
| 65 to 74 Years | 169 | 14.4% |
| 75 to 84 Years | 37 | 3.2% |
| 85 Years and Over | 0 | 0.0% |
| Total | 1,174 | 100.0% |
Housing Finances in Bystrom
Median Income by Occupancy in Bystrom
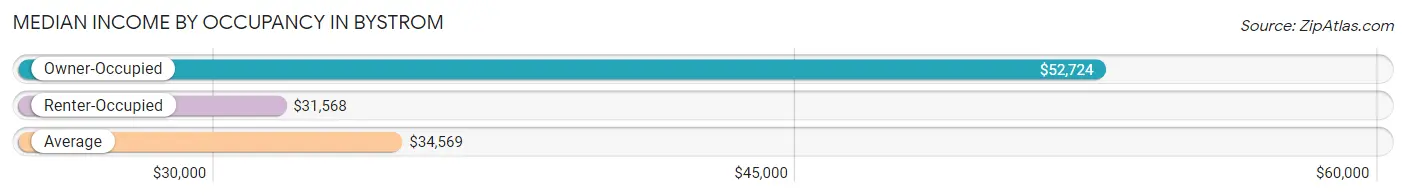
| Occupancy Type | # Households | Median Income |
| Owner-Occupied | 649 (55.3%) | $52,724 |
| Renter-Occupied | 525 (44.7%) | $31,568 |
| Average | 1,174 (100.0%) | $34,569 |
Occupancy by Householder Income Bracket in Bystrom
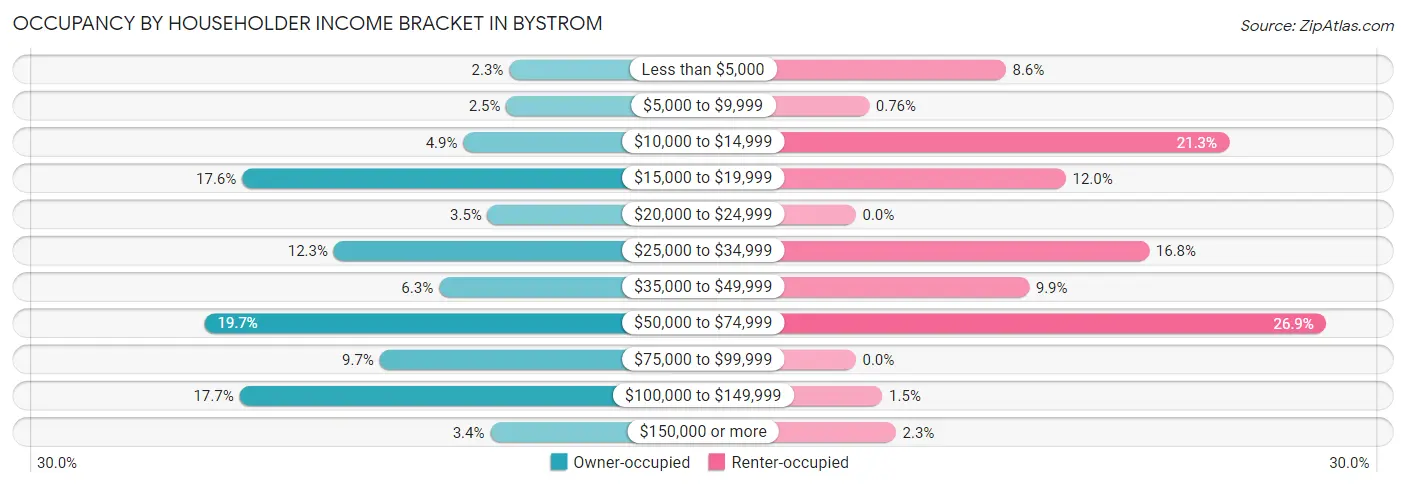
| Income Bracket | Owner-occupied | Renter-occupied |
| Less than $5,000 | 15 (2.3%) | 45 (8.6%) |
| $5,000 to $9,999 | 16 (2.5%) | 4 (0.8%) |
| $10,000 to $14,999 | 32 (4.9%) | 112 (21.3%) |
| $15,000 to $19,999 | 114 (17.6%) | 63 (12.0%) |
| $20,000 to $24,999 | 23 (3.5%) | 0 (0.0%) |
| $25,000 to $34,999 | 80 (12.3%) | 88 (16.8%) |
| $35,000 to $49,999 | 41 (6.3%) | 52 (9.9%) |
| $50,000 to $74,999 | 128 (19.7%) | 141 (26.9%) |
| $75,000 to $99,999 | 63 (9.7%) | 0 (0.0%) |
| $100,000 to $149,999 | 115 (17.7%) | 8 (1.5%) |
| $150,000 or more | 22 (3.4%) | 12 (2.3%) |
| Total | 649 (100.0%) | 525 (100.0%) |
Monthly Housing Cost Tiers in Bystrom
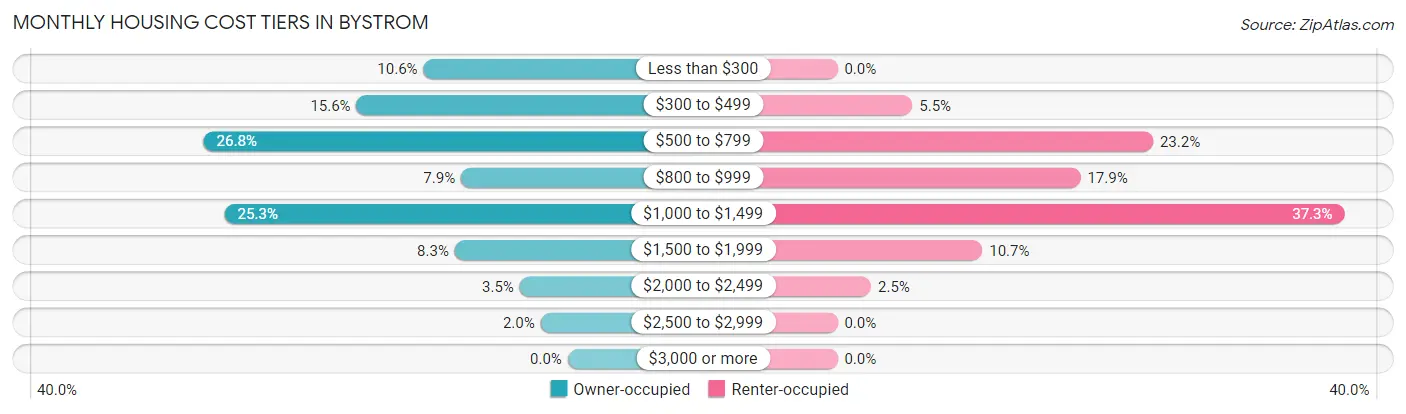
| Monthly Cost | Owner-occupied | Renter-occupied |
| Less than $300 | 69 (10.6%) | 0 (0.0%) |
| $300 to $499 | 101 (15.6%) | 29 (5.5%) |
| $500 to $799 | 174 (26.8%) | 122 (23.2%) |
| $800 to $999 | 51 (7.9%) | 94 (17.9%) |
| $1,000 to $1,499 | 164 (25.3%) | 196 (37.3%) |
| $1,500 to $1,999 | 54 (8.3%) | 56 (10.7%) |
| $2,000 to $2,499 | 23 (3.5%) | 13 (2.5%) |
| $2,500 to $2,999 | 13 (2.0%) | 0 (0.0%) |
| $3,000 or more | 0 (0.0%) | 0 (0.0%) |
| Total | 649 (100.0%) | 525 (100.0%) |
Physical Housing Characteristics in Bystrom
Housing Structures in Bystrom
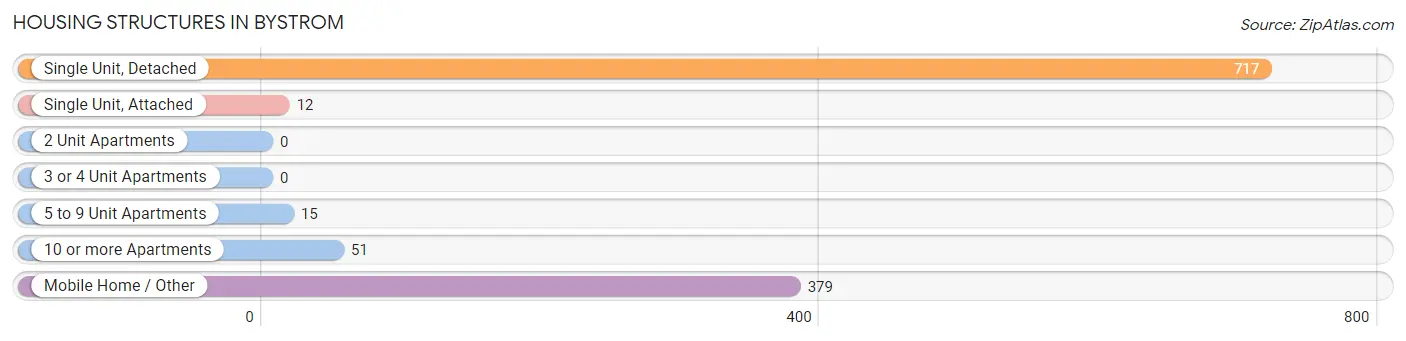
| Structure Type | # Housing Units | % Housing Units |
| Single Unit, Detached | 717 | 61.1% |
| Single Unit, Attached | 12 | 1.0% |
| 2 Unit Apartments | 0 | 0.0% |
| 3 or 4 Unit Apartments | 0 | 0.0% |
| 5 to 9 Unit Apartments | 15 | 1.3% |
| 10 or more Apartments | 51 | 4.3% |
| Mobile Home / Other | 379 | 32.3% |
| Total | 1,174 | 100.0% |
Housing Structures by Occupancy in Bystrom
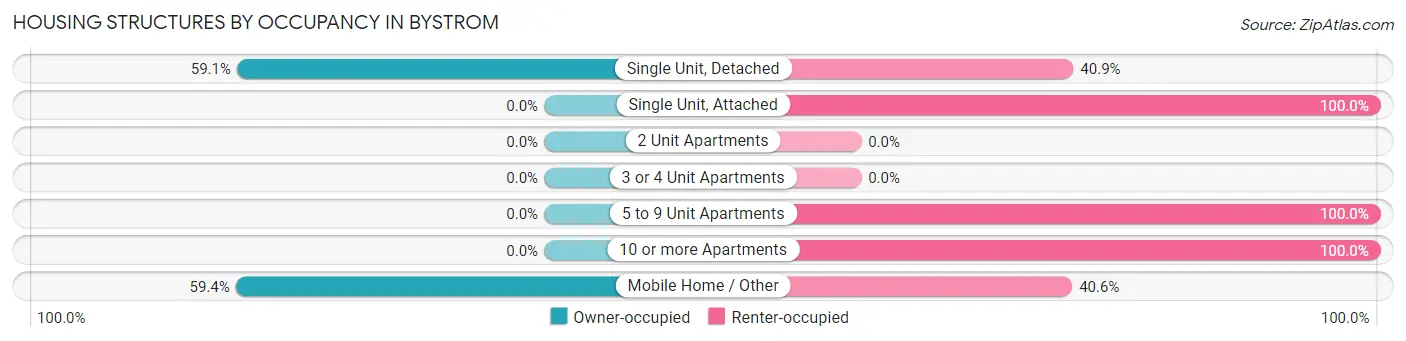
| Structure Type | Owner-occupied | Renter-occupied |
| Single Unit, Detached | 424 (59.1%) | 293 (40.9%) |
| Single Unit, Attached | 0 (0.0%) | 12 (100.0%) |
| 2 Unit Apartments | 0 (0.0%) | 0 (0.0%) |
| 3 or 4 Unit Apartments | 0 (0.0%) | 0 (0.0%) |
| 5 to 9 Unit Apartments | 0 (0.0%) | 15 (100.0%) |
| 10 or more Apartments | 0 (0.0%) | 51 (100.0%) |
| Mobile Home / Other | 225 (59.4%) | 154 (40.6%) |
| Total | 649 (55.3%) | 525 (44.7%) |
Housing Structures by Number of Rooms in Bystrom
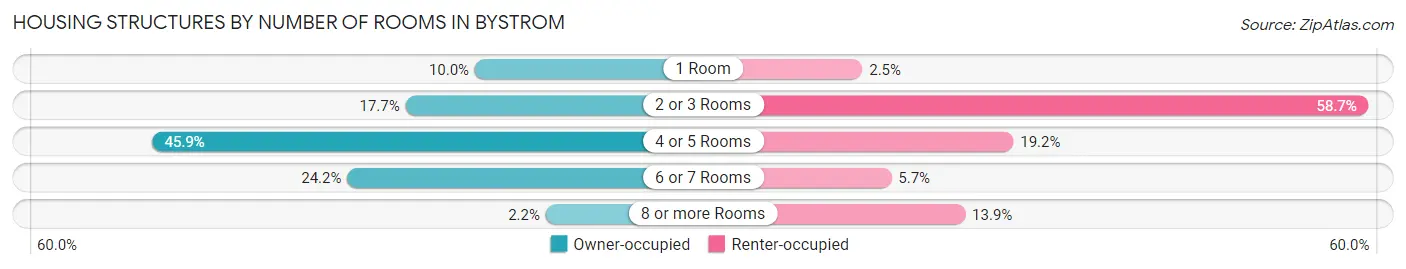
| Number of Rooms | Owner-occupied | Renter-occupied |
| 1 Room | 65 (10.0%) | 13 (2.5%) |
| 2 or 3 Rooms | 115 (17.7%) | 308 (58.7%) |
| 4 or 5 Rooms | 298 (45.9%) | 101 (19.2%) |
| 6 or 7 Rooms | 157 (24.2%) | 30 (5.7%) |
| 8 or more Rooms | 14 (2.2%) | 73 (13.9%) |
| Total | 649 (100.0%) | 525 (100.0%) |
Housing Structure by Heating Type in Bystrom
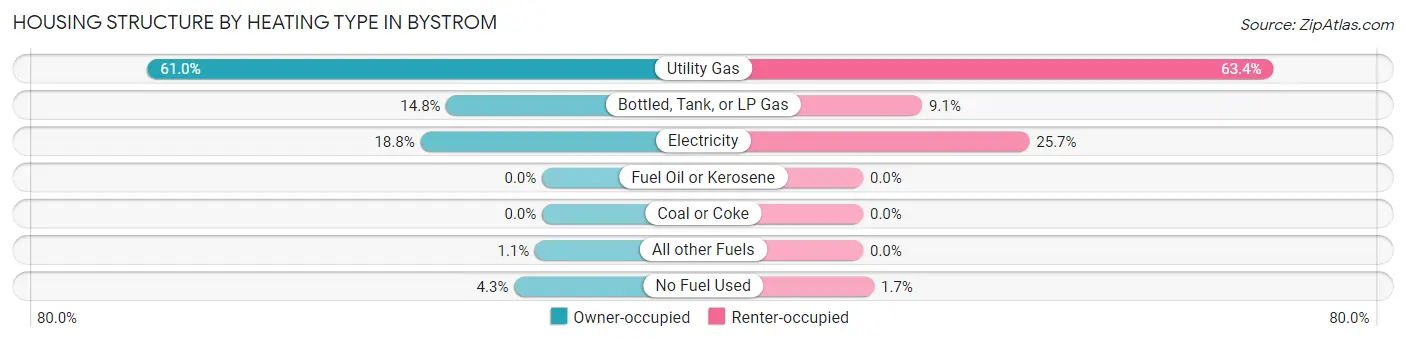
| Heating Type | Owner-occupied | Renter-occupied |
| Utility Gas | 396 (61.0%) | 333 (63.4%) |
| Bottled, Tank, or LP Gas | 96 (14.8%) | 48 (9.1%) |
| Electricity | 122 (18.8%) | 135 (25.7%) |
| Fuel Oil or Kerosene | 0 (0.0%) | 0 (0.0%) |
| Coal or Coke | 0 (0.0%) | 0 (0.0%) |
| All other Fuels | 7 (1.1%) | 0 (0.0%) |
| No Fuel Used | 28 (4.3%) | 9 (1.7%) |
| Total | 649 (100.0%) | 525 (100.0%) |
Household Vehicle Usage in Bystrom
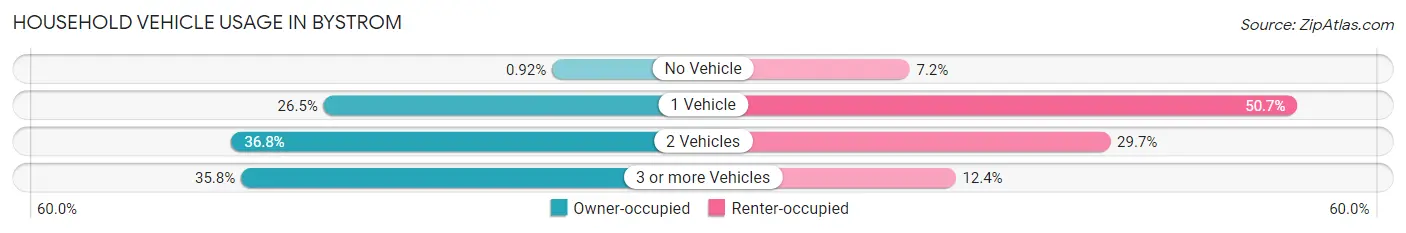
| Vehicles per Household | Owner-occupied | Renter-occupied |
| No Vehicle | 6 (0.9%) | 38 (7.2%) |
| 1 Vehicle | 172 (26.5%) | 266 (50.7%) |
| 2 Vehicles | 239 (36.8%) | 156 (29.7%) |
| 3 or more Vehicles | 232 (35.7%) | 65 (12.4%) |
| Total | 649 (100.0%) | 525 (100.0%) |
Real Estate & Mortgages in Bystrom
Real Estate and Mortgage Overview in Bystrom
| Characteristic | Without Mortgage | With Mortgage |
| Housing Units | 329 | 320 |
| Median Property Value | $13,800 | $283,100 |
| Median Household Income | $19,859 | $22 |
| Monthly Housing Costs | $518 | $0 |
| Real Estate Taxes | - | - |
Property Value by Mortgage Status in Bystrom
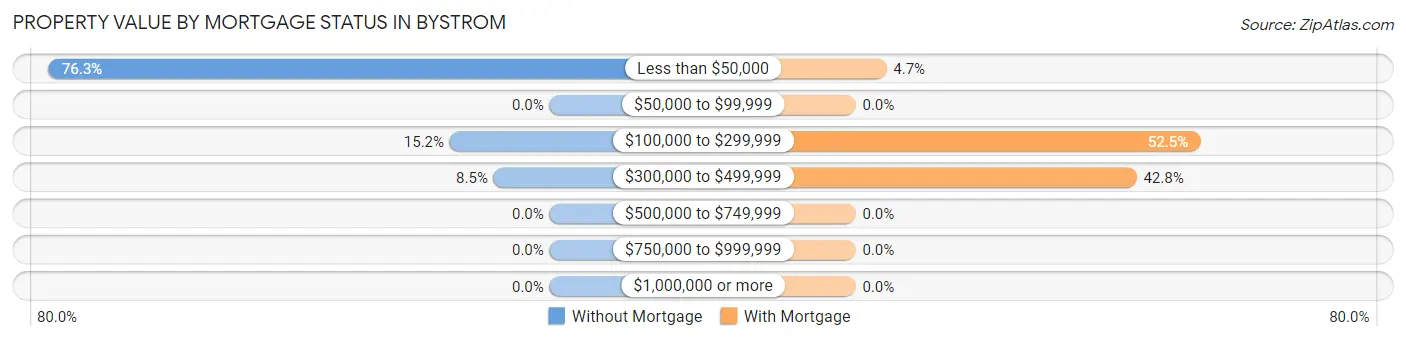
| Property Value | Without Mortgage | With Mortgage |
| Less than $50,000 | 251 (76.3%) | 15 (4.7%) |
| $50,000 to $99,999 | 0 (0.0%) | 0 (0.0%) |
| $100,000 to $299,999 | 50 (15.2%) | 168 (52.5%) |
| $300,000 to $499,999 | 28 (8.5%) | 137 (42.8%) |
| $500,000 to $749,999 | 0 (0.0%) | 0 (0.0%) |
| $750,000 to $999,999 | 0 (0.0%) | 0 (0.0%) |
| $1,000,000 or more | 0 (0.0%) | 0 (0.0%) |
| Total | 329 (100.0%) | 320 (100.0%) |
Household Income by Mortgage Status in Bystrom
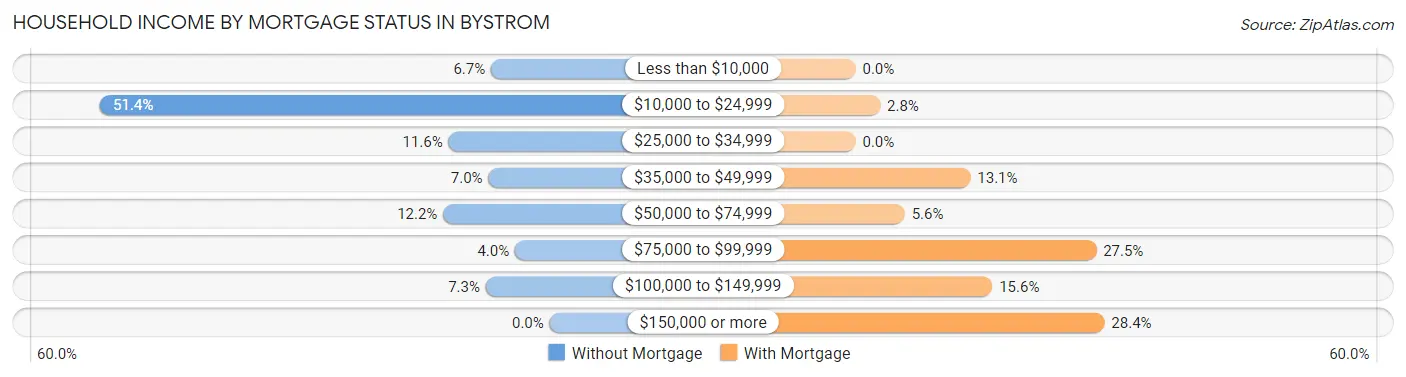
| Household Income | Without Mortgage | With Mortgage |
| Less than $10,000 | 22 (6.7%) | 0 (0.0%) |
| $10,000 to $24,999 | 169 (51.4%) | 9 (2.8%) |
| $25,000 to $34,999 | 38 (11.6%) | 0 (0.0%) |
| $35,000 to $49,999 | 23 (7.0%) | 42 (13.1%) |
| $50,000 to $74,999 | 40 (12.2%) | 18 (5.6%) |
| $75,000 to $99,999 | 13 (4.0%) | 88 (27.5%) |
| $100,000 to $149,999 | 24 (7.3%) | 50 (15.6%) |
| $150,000 or more | 0 (0.0%) | 91 (28.4%) |
| Total | 329 (100.0%) | 320 (100.0%) |
Property Value to Household Income Ratio in Bystrom
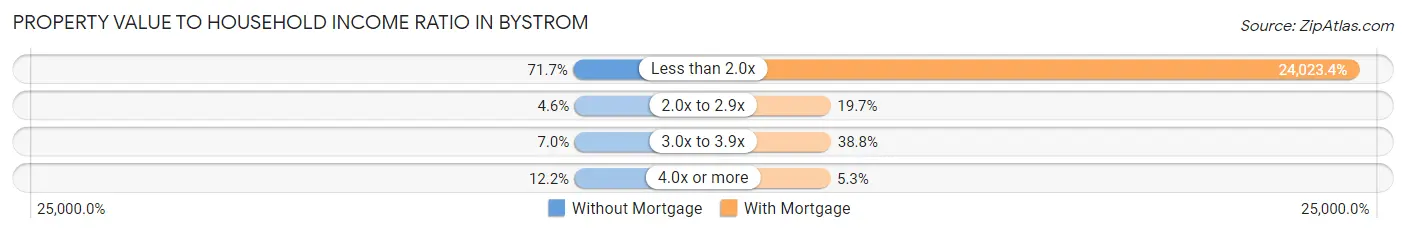
| Value-to-Income Ratio | Without Mortgage | With Mortgage |
| Less than 2.0x | 236 (71.7%) | 76,875 (24,023.4%) |
| 2.0x to 2.9x | 15 (4.6%) | 63 (19.7%) |
| 3.0x to 3.9x | 23 (7.0%) | 124 (38.8%) |
| 4.0x or more | 40 (12.2%) | 17 (5.3%) |
| Total | 329 (100.0%) | 320 (100.0%) |
Real Estate Taxes by Mortgage Status in Bystrom
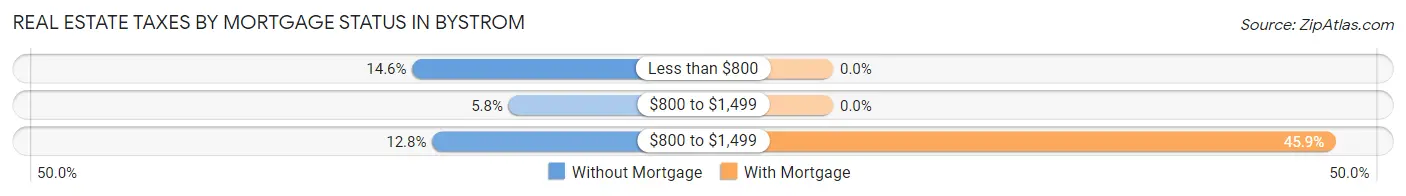
| Property Taxes | Without Mortgage | With Mortgage |
| Less than $800 | 48 (14.6%) | 0 (0.0%) |
| $800 to $1,499 | 19 (5.8%) | 0 (0.0%) |
| $800 to $1,499 | 42 (12.8%) | 147 (45.9%) |
| Total | 329 (100.0%) | 320 (100.0%) |
Health & Disability in Bystrom
Health Insurance Coverage by Age in Bystrom
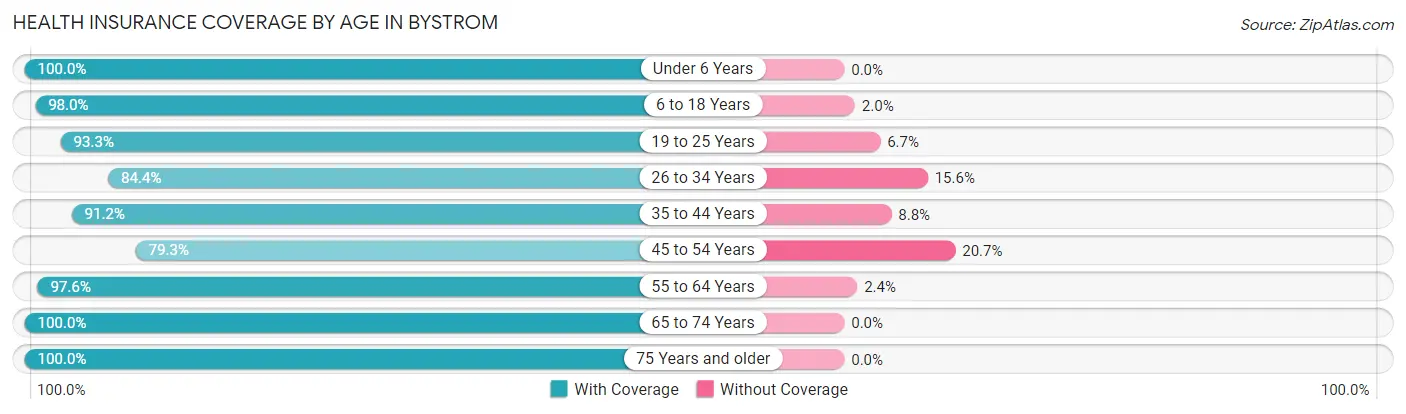
| Age Bracket | With Coverage | Without Coverage |
| Under 6 Years | 490 (100.0%) | 0 (0.0%) |
| 6 to 18 Years | 841 (98.0%) | 17 (2.0%) |
| 19 to 25 Years | 501 (93.3%) | 36 (6.7%) |
| 26 to 34 Years | 445 (84.4%) | 82 (15.6%) |
| 35 to 44 Years | 416 (91.2%) | 40 (8.8%) |
| 45 to 54 Years | 318 (79.3%) | 83 (20.7%) |
| 55 to 64 Years | 364 (97.6%) | 9 (2.4%) |
| 65 to 74 Years | 228 (100.0%) | 0 (0.0%) |
| 75 Years and older | 71 (100.0%) | 0 (0.0%) |
| Total | 3,674 (93.2%) | 267 (6.8%) |
Health Insurance Coverage by Citizenship Status in Bystrom
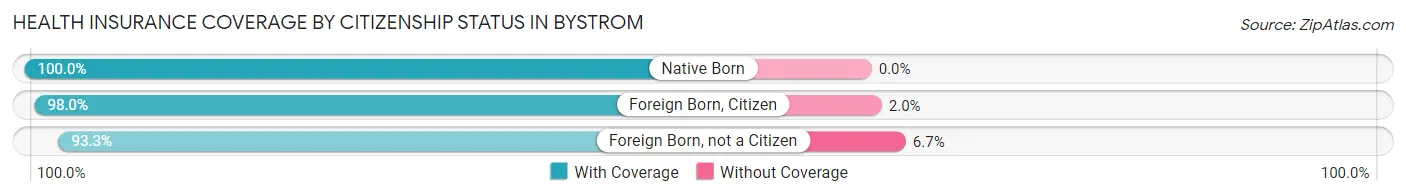
| Citizenship Status | With Coverage | Without Coverage |
| Native Born | 490 (100.0%) | 0 (0.0%) |
| Foreign Born, Citizen | 841 (98.0%) | 17 (2.0%) |
| Foreign Born, not a Citizen | 501 (93.3%) | 36 (6.7%) |
Health Insurance Coverage by Household Income in Bystrom
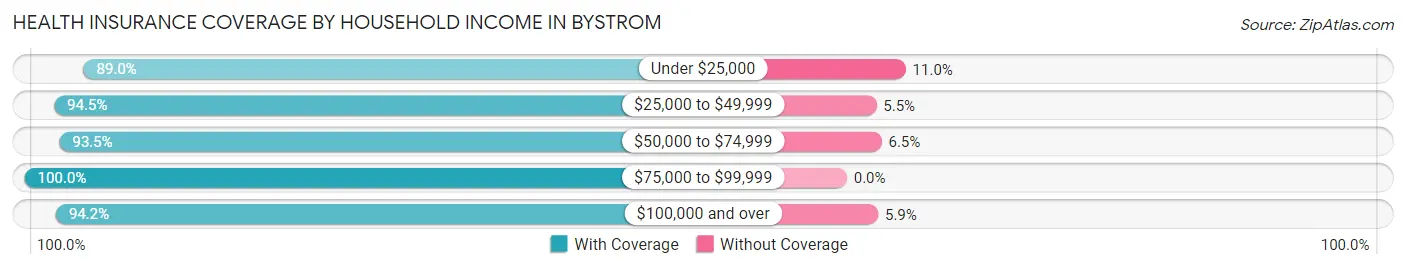
| Household Income | With Coverage | Without Coverage |
| Under $25,000 | 855 (89.0%) | 106 (11.0%) |
| $25,000 to $49,999 | 614 (94.5%) | 36 (5.5%) |
| $50,000 to $74,999 | 1,177 (93.5%) | 82 (6.5%) |
| $75,000 to $99,999 | 279 (100.0%) | 0 (0.0%) |
| $100,000 and over | 692 (94.2%) | 43 (5.9%) |
Public vs Private Health Insurance Coverage by Age in Bystrom
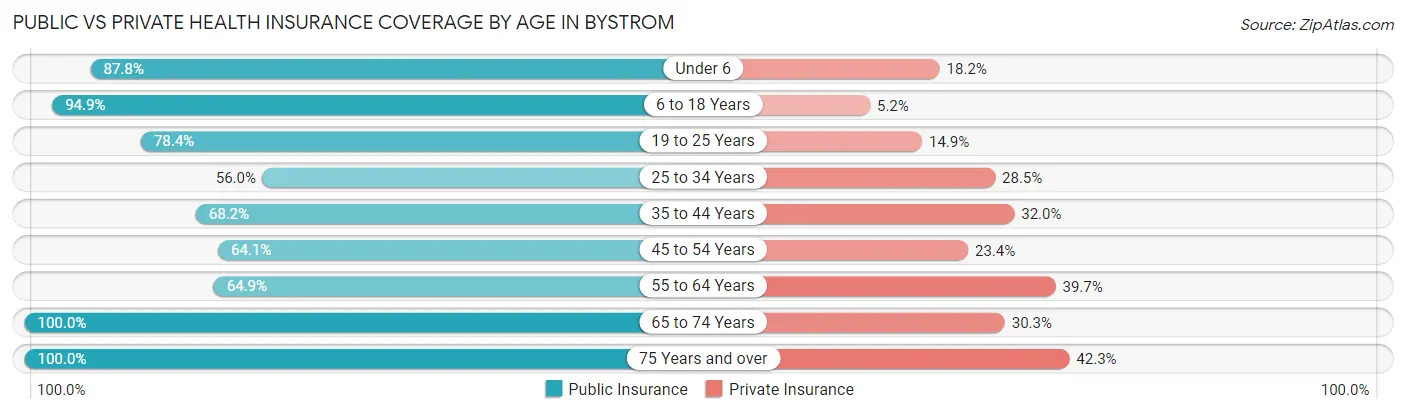
| Age Bracket | Public Insurance | Private Insurance |
| Under 6 | 430 (87.8%) | 89 (18.2%) |
| 6 to 18 Years | 814 (94.9%) | 45 (5.2%) |
| 19 to 25 Years | 421 (78.4%) | 80 (14.9%) |
| 25 to 34 Years | 295 (56.0%) | 150 (28.5%) |
| 35 to 44 Years | 311 (68.2%) | 146 (32.0%) |
| 45 to 54 Years | 257 (64.1%) | 94 (23.4%) |
| 55 to 64 Years | 242 (64.9%) | 148 (39.7%) |
| 65 to 74 Years | 228 (100.0%) | 69 (30.3%) |
| 75 Years and over | 71 (100.0%) | 30 (42.2%) |
| Total | 3,069 (77.9%) | 851 (21.6%) |
Disability Status by Sex by Age in Bystrom
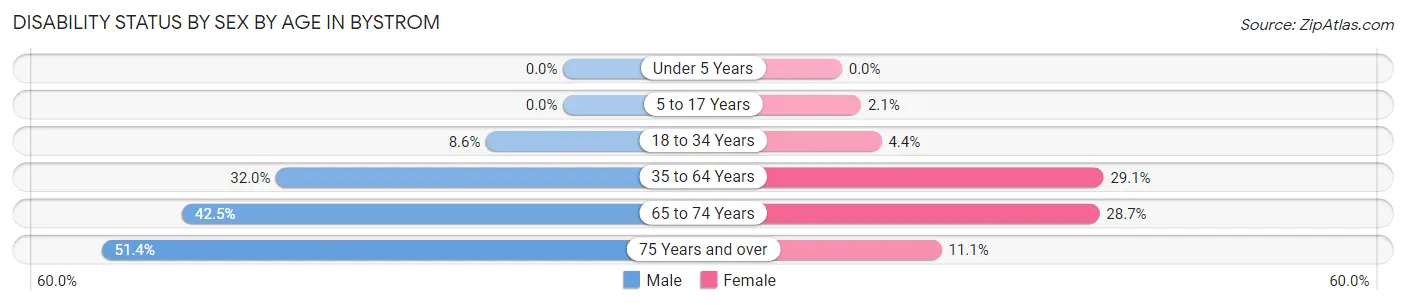
| Age Bracket | Male | Female |
| Under 5 Years | 0 (0.0%) | 0 (0.0%) |
| 5 to 17 Years | 0 (0.0%) | 10 (2.1%) |
| 18 to 34 Years | 44 (8.6%) | 28 (4.4%) |
| 35 to 64 Years | 210 (32.0%) | 167 (29.1%) |
| 65 to 74 Years | 45 (42.4%) | 35 (28.7%) |
| 75 Years and over | 18 (51.4%) | 4 (11.1%) |
Disability Class by Sex by Age in Bystrom
Disability Class: Hearing Difficulty
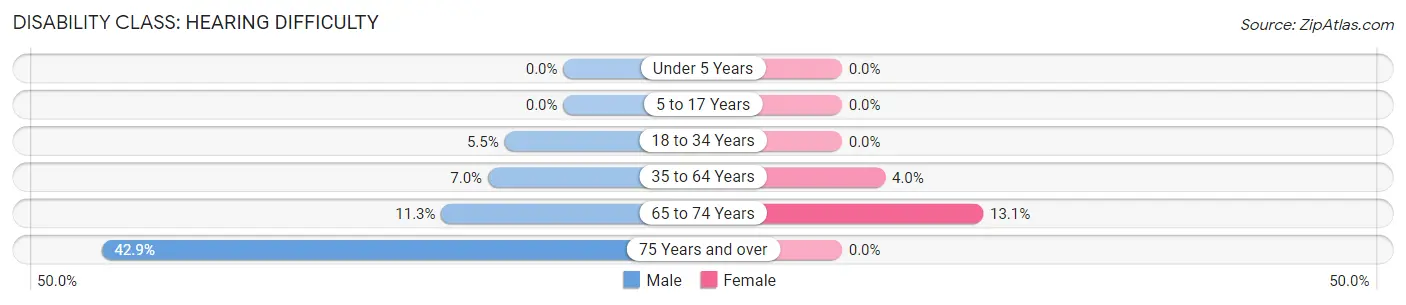
| Age Bracket | Male | Female |
| Under 5 Years | 0 (0.0%) | 0 (0.0%) |
| 5 to 17 Years | 0 (0.0%) | 0 (0.0%) |
| 18 to 34 Years | 28 (5.5%) | 0 (0.0%) |
| 35 to 64 Years | 46 (7.0%) | 23 (4.0%) |
| 65 to 74 Years | 12 (11.3%) | 16 (13.1%) |
| 75 Years and over | 15 (42.9%) | 0 (0.0%) |
Disability Class: Vision Difficulty
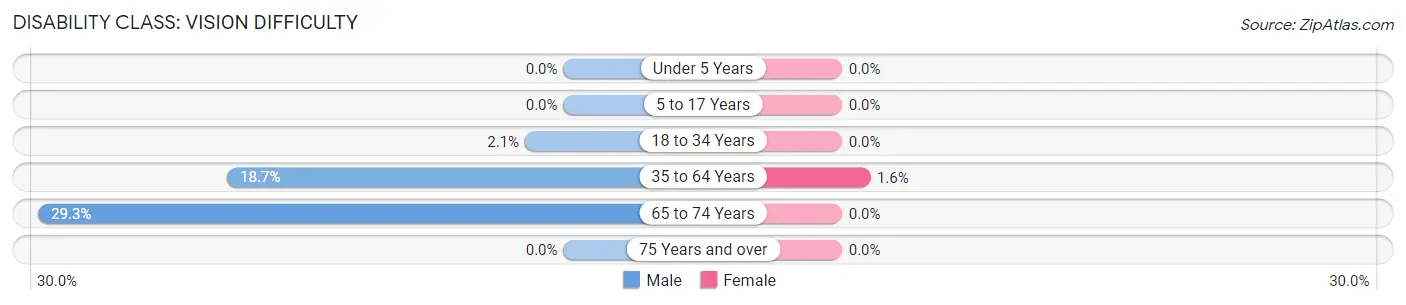
| Age Bracket | Male | Female |
| Under 5 Years | 0 (0.0%) | 0 (0.0%) |
| 5 to 17 Years | 0 (0.0%) | 0 (0.0%) |
| 18 to 34 Years | 11 (2.1%) | 0 (0.0%) |
| 35 to 64 Years | 123 (18.7%) | 9 (1.6%) |
| 65 to 74 Years | 31 (29.2%) | 0 (0.0%) |
| 75 Years and over | 0 (0.0%) | 0 (0.0%) |
Disability Class: Cognitive Difficulty
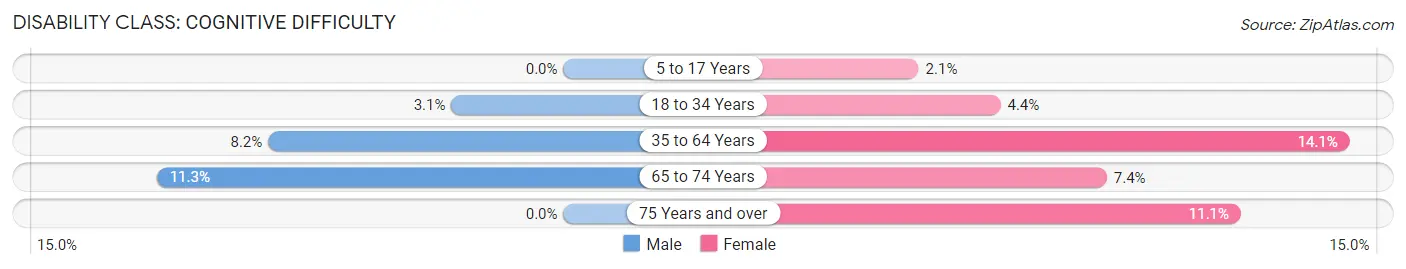
| Age Bracket | Male | Female |
| 5 to 17 Years | 0 (0.0%) | 10 (2.1%) |
| 18 to 34 Years | 16 (3.1%) | 28 (4.4%) |
| 35 to 64 Years | 54 (8.2%) | 81 (14.1%) |
| 65 to 74 Years | 12 (11.3%) | 9 (7.4%) |
| 75 Years and over | 0 (0.0%) | 4 (11.1%) |
Disability Class: Ambulatory Difficulty
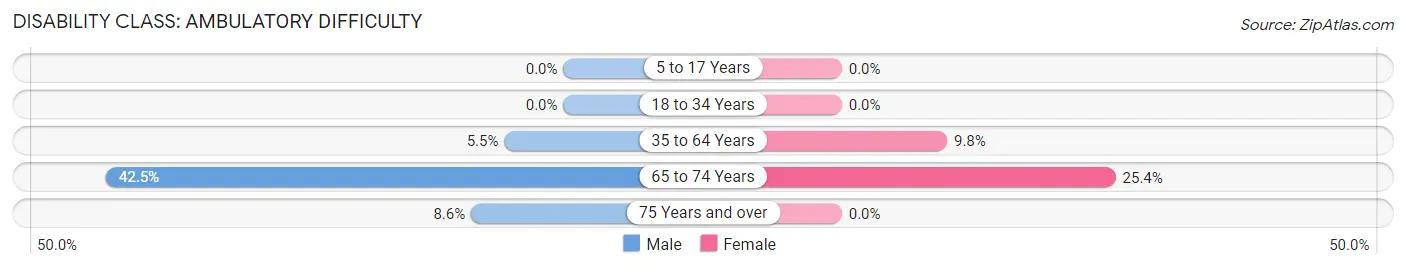
| Age Bracket | Male | Female |
| 5 to 17 Years | 0 (0.0%) | 0 (0.0%) |
| 18 to 34 Years | 0 (0.0%) | 0 (0.0%) |
| 35 to 64 Years | 36 (5.5%) | 56 (9.8%) |
| 65 to 74 Years | 45 (42.4%) | 31 (25.4%) |
| 75 Years and over | 3 (8.6%) | 0 (0.0%) |
Disability Class: Self-Care Difficulty
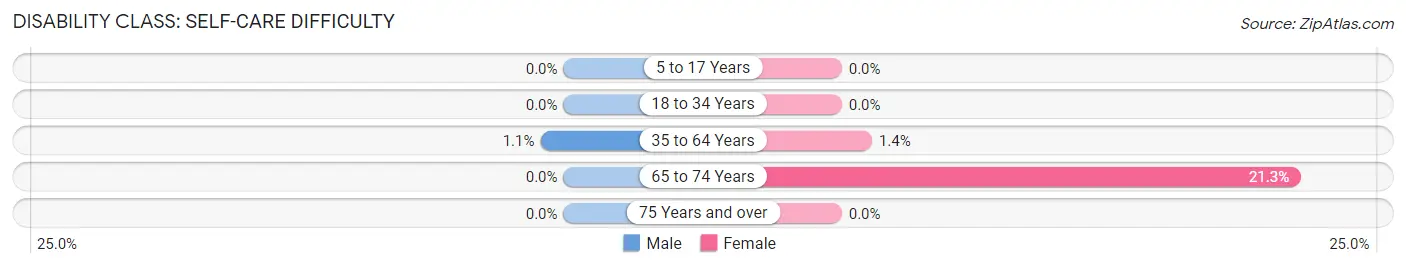
| Age Bracket | Male | Female |
| 5 to 17 Years | 0 (0.0%) | 0 (0.0%) |
| 18 to 34 Years | 0 (0.0%) | 0 (0.0%) |
| 35 to 64 Years | 7 (1.1%) | 8 (1.4%) |
| 65 to 74 Years | 0 (0.0%) | 26 (21.3%) |
| 75 Years and over | 0 (0.0%) | 0 (0.0%) |
Technology Access in Bystrom
Computing Device Access in Bystrom
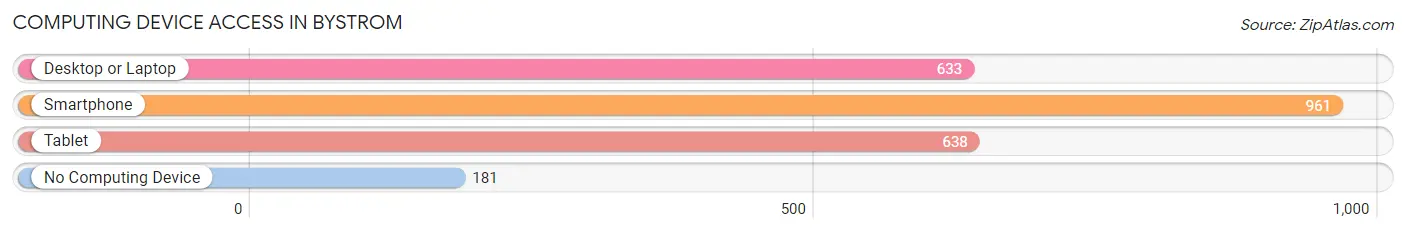
| Device Type | # Households | % Households |
| Desktop or Laptop | 633 | 53.9% |
| Smartphone | 961 | 81.9% |
| Tablet | 638 | 54.3% |
| No Computing Device | 181 | 15.4% |
| Total | 1,174 | 100.0% |
Internet Access in Bystrom
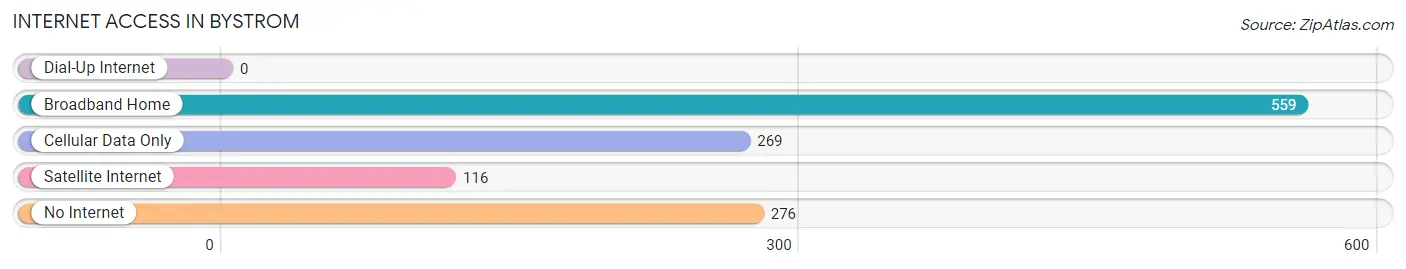
| Internet Type | # Households | % Households |
| Dial-Up Internet | 0 | 0.0% |
| Broadband Home | 559 | 47.6% |
| Cellular Data Only | 269 | 22.9% |
| Satellite Internet | 116 | 9.9% |
| No Internet | 276 | 23.5% |
| Total | 1,174 | 100.0% |
Bystrom Summary
Bystrom is a small unincorporated community located in the San Joaquin Valley of California, United States. It is situated in Fresno County, approximately 8 miles south of the city of Fresno. The population of Bystrom was estimated to be around 1,000 people in 2000.
History
Bystrom was founded in the late 1800s by Swedish immigrants who were looking for a place to settle and farm. The town was named after the Bystrom family, who were among the first settlers. The Bystroms were farmers and ranchers, and they grew a variety of crops, including wheat, barley, and alfalfa.
The town grew slowly over the years, and by the early 1900s, it had a post office, a general store, a blacksmith shop, and a few other businesses. In the 1920s, the town was home to a large dairy farm, which provided milk to the local community.
Geography
Bystrom is located in the San Joaquin Valley of California, approximately 8 miles south of the city of Fresno. The town is situated on the west side of the San Joaquin River, and is surrounded by rolling hills and farmland. The climate in Bystrom is hot and dry in the summer, and mild and wet in the winter.
Economy
The economy of Bystrom is largely based on agriculture. The town is home to several large farms, which grow a variety of crops, including wheat, barley, alfalfa, and other grains. The town also has a few small businesses, including a general store, a post office, and a few other services.
Demographics
As of the 2000 census, the population of Bystrom was estimated to be around 1,000 people. The racial makeup of the town was 94.7% White, 0.7% African American, 0.3% Native American, 0.3% Asian, 0.1% Pacific Islander, and 3.8% from other races. The median household income was $30,000, and the median family income was $35,000. The per capita income was $14,000.
Conclusion
Bystrom is a small unincorporated community located in the San Joaquin Valley of California. It was founded in the late 1800s by Swedish immigrants, and has since grown to a population of around 1,000 people. The economy of Bystrom is largely based on agriculture, and the town is home to several large farms. The racial makeup of the town is predominantly White, with a small percentage of other races. The median household income is $30,000, and the per capita income is $14,000.
Common Questions
What is Per Capita Income in Bystrom?
Per Capita income in Bystrom is $15,568.
What is the Median Family Income in Bystrom?
Median Family Income in Bystrom is $45,781.
What is the Median Household income in Bystrom?
Median Household Income in Bystrom is $34,569.
What is Income or Wage Gap in Bystrom?
Income or Wage Gap in Bystrom is 27.9%.
Women in Bystrom earn 72.1 cents for every dollar earned by a man.
What is Inequality or Gini Index in Bystrom?
Inequality or Gini Index in Bystrom is 0.44.
What is the Total Population of Bystrom?
Total Population of Bystrom is 3,941.
What is the Total Male Population of Bystrom?
Total Male Population of Bystrom is 1,842.
What is the Total Female Population of Bystrom?
Total Female Population of Bystrom is 2,099.
What is the Ratio of Males per 100 Females in Bystrom?
There are 87.76 Males per 100 Females in Bystrom.
What is the Ratio of Females per 100 Males in Bystrom?
There are 113.95 Females per 100 Males in Bystrom.
What is the Median Population Age in Bystrom?
Median Population Age in Bystrom is 27.3 Years.
What is the Average Family Size in Bystrom
Average Family Size in Bystrom is 4.0 People.
What is the Average Household Size in Bystrom
Average Household Size in Bystrom is 3.3 People.
How Large is the Labor Force in Bystrom?
There are 1,333 People in the Labor Forcein in Bystrom.
What is the Percentage of People in the Labor Force in Bystrom?
49.0% of People are in the Labor Force in Bystrom.
What is the Unemployment Rate in Bystrom?
Unemployment Rate in Bystrom is 20.6%.