Cities with the Highest Percentage of Haitian Population in California
RELATED REPORTS & OPTIONS
Haitian
California
Compare Cities
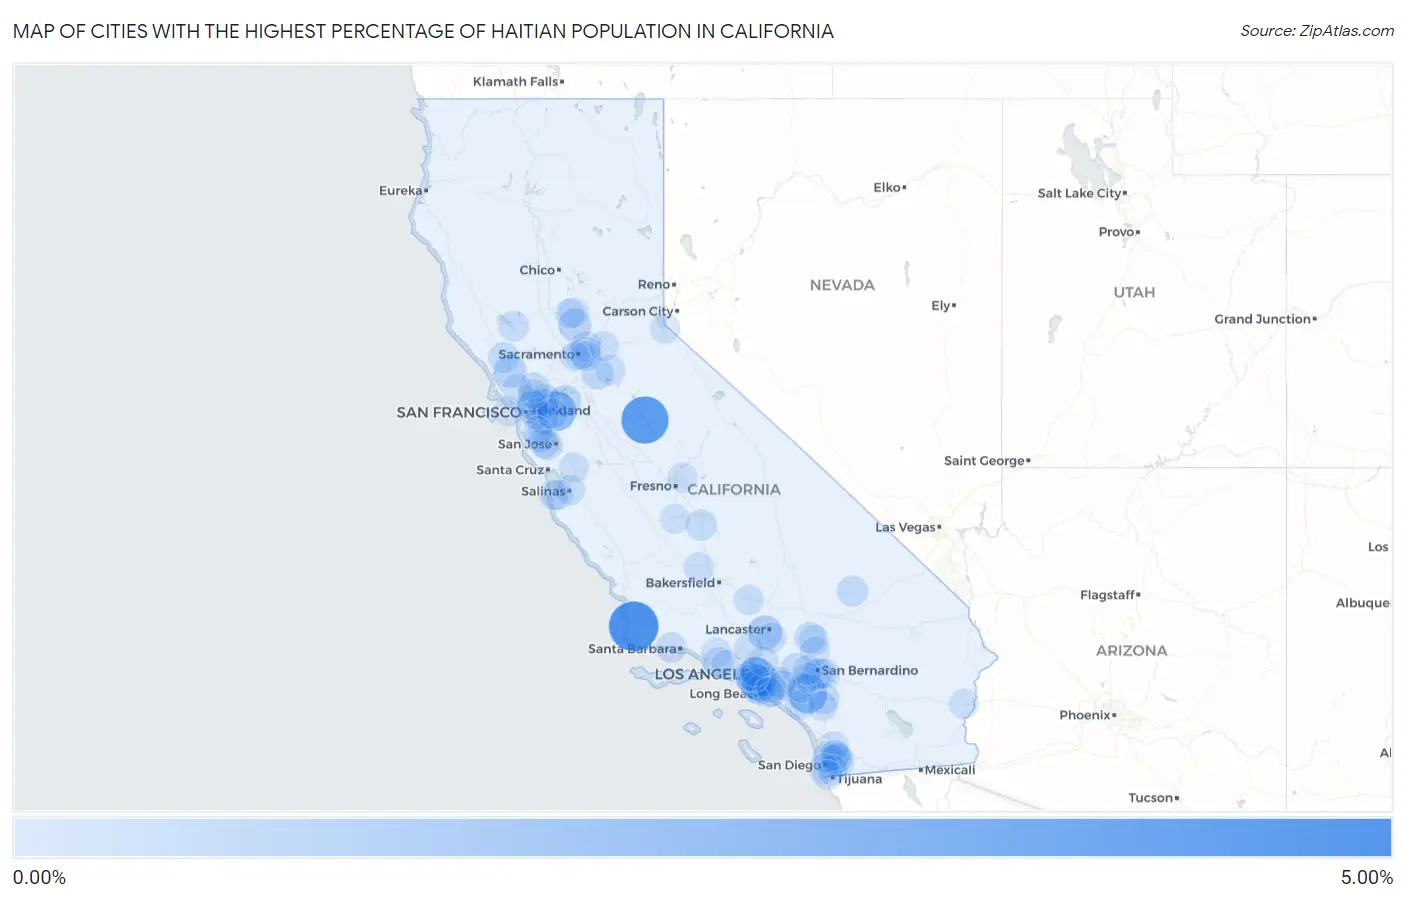
Map of Cities with the Highest Percentage of Haitian Population in California
0.00%
5.00%
Cities with the Highest Percentage of Haitian Population in California
| City | Haitian | vs State | vs National | |
| 1. | Vandenberg Afb | 4.13% | 0.035%(+4.09)#1 | 0.32%(+3.81)#164 |
| 2. | Lake Don Pedro | 3.62% | 0.035%(+3.59)#2 | 0.32%(+3.30)#187 |
| 3. | Ladera Heights | 2.04% | 0.035%(+2.01)#3 | 0.32%(+1.72)#314 |
| 4. | Camino Tassajara | 2.00% | 0.035%(+1.97)#4 | 0.32%(+1.68)#321 |
| 5. | Temescal Valley | 1.91% | 0.035%(+1.87)#5 | 0.32%(+1.59)#342 |
| 6. | Bonadelle Ranchos | 1.67% | 0.035%(+1.63)#6 | 0.32%(+1.35)#386 |
| 7. | Quartz Hill | 0.90% | 0.035%(+0.867)#7 | 0.32%(+0.582)#647 |
| 8. | Rohnert Park | 0.63% | 0.035%(+0.597)#8 | 0.32%(+0.312)#817 |
| 9. | Plumas Lake | 0.57% | 0.035%(+0.531)#9 | 0.32%(+0.246)#874 |
| 10. | Gardena | 0.54% | 0.035%(+0.505)#10 | 0.32%(+0.220)#898 |
| 11. | Emeryville | 0.50% | 0.035%(+0.463)#11 | 0.32%(+0.178)#938 |
| 12. | Inglewood | 0.44% | 0.035%(+0.400)#12 | 0.32%(+0.115)#1,031 |
| 13. | Brentwood | 0.43% | 0.035%(+0.390)#13 | 0.32%(+0.105)#1,048 |
| 14. | Westmont | 0.40% | 0.035%(+0.361)#14 | 0.32%(+0.076)#1,088 |
| 15. | Ashland | 0.39% | 0.035%(+0.357)#15 | 0.32%(+0.072)#1,094 |
| 16. | Clay | 0.36% | 0.035%(+0.321)#16 | 0.32%(+0.036)#1,153 |
| 17. | Pepperdine University | 0.33% | 0.035%(+0.293)#17 | 0.32%(+0.008)#1,200 |
| 18. | Upland | 0.32% | 0.035%(+0.280)#18 | 0.32%(-0.005)#1,227 |
| 19. | Rancho San Diego | 0.28% | 0.035%(+0.241)#19 | 0.32%(-0.044)#1,314 |
| 20. | East Niles | 0.27% | 0.035%(+0.238)#20 | 0.32%(-0.047)#1,323 |
| 21. | Windsor | 0.27% | 0.035%(+0.231)#21 | 0.32%(-0.054)#1,336 |
| 22. | Menifee | 0.26% | 0.035%(+0.224)#22 | 0.32%(-0.061)#1,346 |
| 23. | Tulare | 0.24% | 0.035%(+0.200)#23 | 0.32%(-0.085)#1,411 |
| 24. | Fort Irwin | 0.23% | 0.035%(+0.199)#24 | 0.32%(-0.086)#1,415 |
| 25. | Adelanto | 0.23% | 0.035%(+0.196)#25 | 0.32%(-0.089)#1,423 |
| 26. | Redondo Beach | 0.23% | 0.035%(+0.190)#26 | 0.32%(-0.095)#1,451 |
| 27. | Loyola | 0.21% | 0.035%(+0.174)#27 | 0.32%(-0.111)#1,503 |
| 28. | South Gate | 0.19% | 0.035%(+0.156)#28 | 0.32%(-0.129)#1,540 |
| 29. | Arden Arcade | 0.18% | 0.035%(+0.145)#29 | 0.32%(-0.140)#1,568 |
| 30. | La Habra | 0.17% | 0.035%(+0.139)#30 | 0.32%(-0.145)#1,586 |
| 31. | Bostonia | 0.17% | 0.035%(+0.137)#31 | 0.32%(-0.148)#1,606 |
| 32. | Clearlake | 0.16% | 0.035%(+0.127)#32 | 0.32%(-0.158)#1,646 |
| 33. | Loma Linda | 0.16% | 0.035%(+0.125)#33 | 0.32%(-0.160)#1,654 |
| 34. | Rossmoor | 0.15% | 0.035%(+0.118)#34 | 0.32%(-0.167)#1,681 |
| 35. | Grand Terrace | 0.15% | 0.035%(+0.117)#35 | 0.32%(-0.168)#1,684 |
| 36. | Goleta | 0.15% | 0.035%(+0.112)#36 | 0.32%(-0.173)#1,700 |
| 37. | Camarillo | 0.14% | 0.035%(+0.105)#37 | 0.32%(-0.180)#1,731 |
| 38. | Pleasant Hill | 0.13% | 0.035%(+0.095)#38 | 0.32%(-0.190)#1,775 |
| 39. | Victorville | 0.13% | 0.035%(+0.093)#39 | 0.32%(-0.192)#1,791 |
| 40. | Lawndale | 0.12% | 0.035%(+0.085)#40 | 0.32%(-0.200)#1,825 |
| 41. | La Mesa | 0.12% | 0.035%(+0.084)#41 | 0.32%(-0.200)#1,827 |
| 42. | Foothill Farms | 0.12% | 0.035%(+0.082)#42 | 0.32%(-0.203)#1,837 |
| 43. | Oakland | 0.12% | 0.035%(+0.081)#43 | 0.32%(-0.204)#1,840 |
| 44. | Stanford | 0.12% | 0.035%(+0.081)#44 | 0.32%(-0.204)#1,846 |
| 45. | Berkeley | 0.11% | 0.035%(+0.071)#45 | 0.32%(-0.214)#1,893 |
| 46. | Lafayette | 0.10% | 0.035%(+0.067)#46 | 0.32%(-0.218)#1,910 |
| 47. | Ione | 0.093% | 0.035%(+0.058)#47 | 0.32%(-0.227)#1,974 |
| 48. | Cupertino | 0.089% | 0.035%(+0.053)#48 | 0.32%(-0.232)#1,997 |
| 49. | Wasco | 0.087% | 0.035%(+0.052)#49 | 0.32%(-0.233)#2,005 |
| 50. | Vallejo | 0.085% | 0.035%(+0.049)#50 | 0.32%(-0.236)#2,018 |
| 51. | Monterey | 0.083% | 0.035%(+0.048)#51 | 0.32%(-0.237)#2,026 |
| 52. | San Diego | 0.083% | 0.035%(+0.048)#52 | 0.32%(-0.237)#2,029 |
| 53. | Tehachapi | 0.078% | 0.035%(+0.042)#53 | 0.32%(-0.243)#2,060 |
| 54. | El Cajon | 0.075% | 0.035%(+0.039)#54 | 0.32%(-0.246)#2,083 |
| 55. | Salinas | 0.072% | 0.035%(+0.037)#55 | 0.32%(-0.248)#2,100 |
| 56. | West Carson | 0.072% | 0.035%(+0.037)#56 | 0.32%(-0.248)#2,107 |
| 57. | Poway | 0.072% | 0.035%(+0.036)#57 | 0.32%(-0.249)#2,108 |
| 58. | Palmdale | 0.071% | 0.035%(+0.035)#58 | 0.32%(-0.250)#2,113 |
| 59. | Fullerton | 0.067% | 0.035%(+0.032)#59 | 0.32%(-0.253)#2,135 |
| 60. | Santee | 0.066% | 0.035%(+0.030)#60 | 0.32%(-0.255)#2,149 |
| 61. | Redlands | 0.066% | 0.035%(+0.030)#61 | 0.32%(-0.255)#2,150 |
| 62. | Novato | 0.064% | 0.035%(+0.029)#62 | 0.32%(-0.256)#2,159 |
| 63. | Marysville | 0.063% | 0.035%(+0.028)#63 | 0.32%(-0.257)#2,170 |
| 64. | Camp Pendleton Mainside | 0.063% | 0.035%(+0.027)#64 | 0.32%(-0.258)#2,175 |
| 65. | Culver City | 0.062% | 0.035%(+0.027)#65 | 0.32%(-0.258)#2,179 |
| 66. | Los Angeles | 0.062% | 0.035%(+0.026)#66 | 0.32%(-0.259)#2,180 |
| 67. | University Of California-Santa Barbara | 0.061% | 0.035%(+0.026)#67 | 0.32%(-0.259)#2,188 |
| 68. | Sacramento | 0.061% | 0.035%(+0.025)#68 | 0.32%(-0.260)#2,191 |
| 69. | San Ramon | 0.060% | 0.035%(+0.025)#69 | 0.32%(-0.260)#2,195 |
| 70. | Spring Valley Cdp San Diego County | 0.058% | 0.035%(+0.023)#70 | 0.32%(-0.262)#2,212 |
| 71. | Santa Paula | 0.058% | 0.035%(+0.023)#71 | 0.32%(-0.262)#2,213 |
| 72. | Hercules | 0.058% | 0.035%(+0.022)#72 | 0.32%(-0.263)#2,222 |
| 73. | Coto De Caza | 0.058% | 0.035%(+0.022)#73 | 0.32%(-0.263)#2,223 |
| 74. | Thousand Oaks | 0.056% | 0.035%(+0.021)#74 | 0.32%(-0.264)#2,234 |
| 75. | Rosemont | 0.055% | 0.035%(+0.019)#75 | 0.32%(-0.266)#2,245 |
| 76. | Pacific Grove | 0.053% | 0.035%(+0.018)#76 | 0.32%(-0.267)#2,254 |
| 77. | Lakewood | 0.053% | 0.035%(+0.017)#77 | 0.32%(-0.268)#2,257 |
| 78. | Lemoore | 0.052% | 0.035%(+0.017)#78 | 0.32%(-0.268)#2,263 |
| 79. | Santa Monica | 0.051% | 0.035%(+0.016)#79 | 0.32%(-0.269)#2,268 |
| 80. | Chula Vista | 0.049% | 0.035%(+0.013)#80 | 0.32%(-0.271)#2,285 |
| 81. | Gilroy | 0.048% | 0.035%(+0.012)#81 | 0.32%(-0.273)#2,299 |
| 82. | La Crescenta Montrose | 0.045% | 0.035%(+0.009)#82 | 0.32%(-0.276)#2,324 |
| 83. | San Francisco | 0.043% | 0.035%(+0.008)#83 | 0.32%(-0.277)#2,334 |
| 84. | El Dorado Hills | 0.043% | 0.035%(+0.007)#84 | 0.32%(-0.278)#2,338 |
| 85. | Coronado | 0.042% | 0.035%(+0.007)#85 | 0.32%(-0.278)#2,342 |
| 86. | Clovis | 0.042% | 0.035%(+0.007)#86 | 0.32%(-0.278)#2,345 |
| 87. | Santa Clarita | 0.041% | 0.035%(+0.005)#87 | 0.32%(-0.280)#2,356 |
| 88. | Corona | 0.040% | 0.035%(+0.005)#88 | 0.32%(-0.280)#2,360 |
| 89. | Blythe | 0.039% | 0.035%(+0.004)#89 | 0.32%(-0.281)#2,379 |
| 90. | Redwood City | 0.039% | 0.035%(+0.003)#90 | 0.32%(-0.282)#2,384 |
| 91. | South Lake Tahoe | 0.037% | 0.035%(+0.002)#91 | 0.32%(-0.283)#2,400 |
| 92. | West Sacramento | 0.035% | 0.035%(-0.000)#92 | 0.32%(-0.285)#2,420 |
| 93. | Hesperia | 0.035% | 0.035%(-0.000)#93 | 0.32%(-0.285)#2,422 |
| 94. | Murrieta | 0.035% | 0.035%(-0.001)#94 | 0.32%(-0.286)#2,424 |
| 95. | Yuba City | 0.035% | 0.035%(-0.001)#95 | 0.32%(-0.286)#2,426 |
| 96. | Imperial Beach | 0.034% | 0.035%(-0.001)#96 | 0.32%(-0.286)#2,428 |
| 97. | Beverly Hills | 0.034% | 0.035%(-0.001)#97 | 0.32%(-0.286)#2,435 |
| 98. | Jurupa Valley | 0.033% | 0.035%(-0.002)#98 | 0.32%(-0.287)#2,441 |
| 99. | Long Beach | 0.033% | 0.035%(-0.002)#99 | 0.32%(-0.287)#2,442 |
| 100. | Fontana | 0.031% | 0.035%(-0.004)#100 | 0.32%(-0.289)#2,469 |
Common Questions
What are the Top 10 Cities with the Highest Percentage of Haitian Population in California?
Top 10 Cities with the Highest Percentage of Haitian Population in California are:
#1
4.13%
#2
3.62%
#3
2.04%
#4
2.00%
#5
1.91%
#6
0.90%
#7
0.63%
#8
0.57%
#9
0.54%
#10
0.50%
What city has the Highest Percentage of Haitian Population in California?
Vandenberg AFB has the Highest Percentage of Haitian Population in California with 4.13%.
What is the Percentage of Haitian Population in the State of California?
Percentage of Haitian Population in California is 0.035%.
What is the Percentage of Haitian Population in the United States?
Percentage of Haitian Population in the United States is 0.32%.