Cities with the Highest Percentage of Native / Alaskan Population in California
RELATED REPORTS & OPTIONS
Native / Alaskan
California
Compare Cities
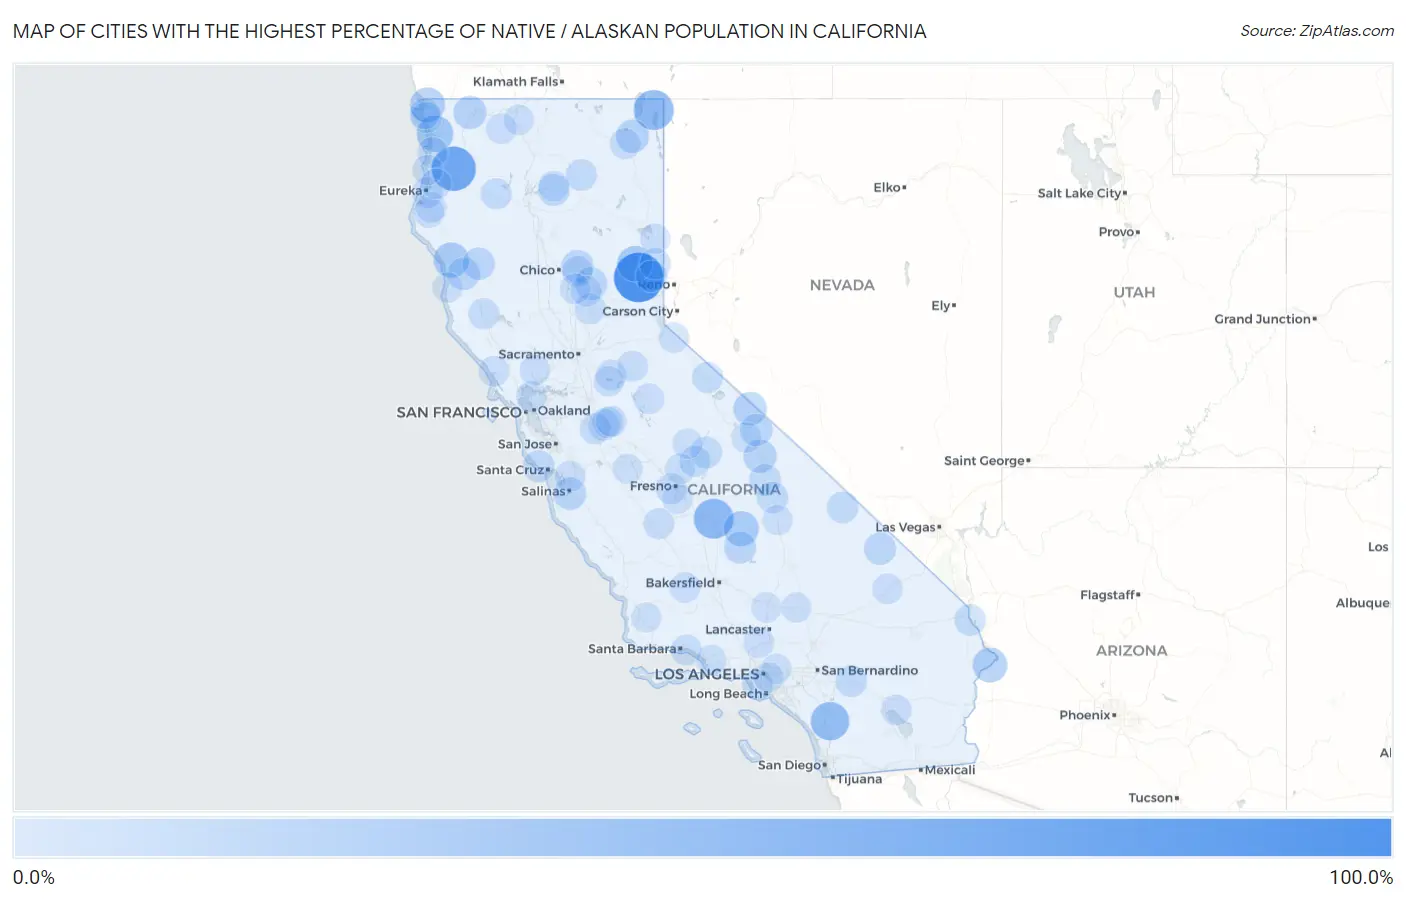
Map of Cities with the Highest Percentage of Native / Alaskan Population in California
0.0%
100.0%
Cities with the Highest Percentage of Native / Alaskan Population in California
| City | Native / Alaskan | vs State | vs National | |
| 1. | Sattley | 100.0% | 1.0%(+99.0)#1 | 0.84%(+99.2)#95 |
| 2. | Kep'el | 89.5% | 1.0%(+88.5)#2 | 0.84%(+88.6)#332 |
| 3. | Weitchpec | 83.5% | 1.0%(+82.5)#3 | 0.84%(+82.7)#401 |
| 4. | Wautec | 76.5% | 1.0%(+75.5)#4 | 0.84%(+75.6)#465 |
| 5. | Hoopa | 73.4% | 1.0%(+72.4)#5 | 0.84%(+72.5)#489 |
| 6. | Tooleville | 51.0% | 1.0%(+50.0)#6 | 0.84%(+50.1)#611 |
| 7. | Fort Bidwell | 50.9% | 1.0%(+49.9)#7 | 0.84%(+50.0)#612 |
| 8. | Tancred | 48.8% | 1.0%(+47.8)#8 | 0.84%(+47.9)#631 |
| 9. | Pala | 44.5% | 1.0%(+43.5)#9 | 0.84%(+43.7)#655 |
| 10. | Klamath | 34.6% | 1.0%(+33.6)#10 | 0.84%(+33.8)#743 |
| 11. | Delleker | 30.0% | 1.0%(+29.0)#11 | 0.84%(+29.2)#800 |
| 12. | Leggett | 28.3% | 1.0%(+27.3)#12 | 0.84%(+27.4)#822 |
| 13. | Pierpoint | 27.8% | 1.0%(+26.8)#13 | 0.84%(+27.0)#830 |
| 14. | Smith River | 27.3% | 1.0%(+26.3)#14 | 0.84%(+26.5)#835 |
| 15. | Bluewater | 26.3% | 1.0%(+25.3)#15 | 0.84%(+25.5)#848 |
| 16. | Ono | 22.2% | 1.0%(+21.2)#16 | 0.84%(+21.4)#923 |
| 17. | Benton | 20.1% | 1.0%(+19.1)#17 | 0.84%(+19.3)#964 |
| 18. | Daphnedale Park | 18.9% | 1.0%(+17.9)#18 | 0.84%(+18.1)#1,005 |
| 19. | La Grange | 18.9% | 1.0%(+17.9)#19 | 0.84%(+18.0)#1,008 |
| 20. | Happy Camp | 18.7% | 1.0%(+17.7)#20 | 0.84%(+17.9)#1,012 |
| 21. | Big Pine | 18.2% | 1.0%(+17.2)#21 | 0.84%(+17.3)#1,027 |
| 22. | Spreckels | 16.2% | 1.0%(+15.2)#22 | 0.84%(+15.3)#1,094 |
| 23. | Forbestown | 15.9% | 1.0%(+14.9)#23 | 0.84%(+15.0)#1,102 |
| 24. | Laytonville | 15.6% | 1.0%(+14.6)#24 | 0.84%(+14.7)#1,109 |
| 25. | Concow | 15.2% | 1.0%(+14.2)#25 | 0.84%(+14.3)#1,125 |
| 26. | Covelo | 14.9% | 1.0%(+13.9)#26 | 0.84%(+14.1)#1,136 |
| 27. | Chalfant | 14.2% | 1.0%(+13.2)#27 | 0.84%(+13.4)#1,156 |
| 28. | Tecopa | 13.9% | 1.0%(+12.9)#28 | 0.84%(+13.1)#1,164 |
| 29. | Pine Flat | 13.3% | 1.0%(+12.3)#29 | 0.84%(+12.4)#1,190 |
| 30. | San Miguel Cdp San Luis Obispo County | 12.5% | 1.0%(+11.5)#30 | 0.84%(+11.6)#1,244 |
| 31. | Davenport | 12.2% | 1.0%(+11.2)#31 | 0.84%(+11.3)#1,260 |
| 32. | Glennville | 12.1% | 1.0%(+11.1)#32 | 0.84%(+11.3)#1,262 |
| 33. | Round Mountain | 12.0% | 1.0%(+11.0)#33 | 0.84%(+11.2)#1,265 |
| 34. | Independence | 11.5% | 1.0%(+10.5)#34 | 0.84%(+10.7)#1,288 |
| 35. | Big Creek | 11.3% | 1.0%(+10.3)#35 | 0.84%(+10.5)#1,303 |
| 36. | Needles | 11.2% | 1.0%(+10.2)#36 | 0.84%(+10.4)#1,314 |
| 37. | Lone Pine | 11.0% | 1.0%(+9.96)#37 | 0.84%(+10.1)#1,327 |
| 38. | Furnace Creek | 10.8% | 1.0%(+9.77)#38 | 0.84%(+9.93)#1,335 |
| 39. | Fall River Mills | 10.8% | 1.0%(+9.77)#39 | 0.84%(+9.93)#1,336 |
| 40. | Chilcoot Vinton | 10.7% | 1.0%(+9.69)#40 | 0.84%(+9.85)#1,345 |
| 41. | Whitewater | 10.2% | 1.0%(+9.22)#41 | 0.84%(+9.38)#1,375 |
| 42. | Sierra Brooks | 10.1% | 1.0%(+9.14)#42 | 0.84%(+9.30)#1,380 |
| 43. | Orange Blossom | 9.9% | 1.0%(+8.87)#43 | 0.84%(+9.03)#1,400 |
| 44. | Auberry | 8.8% | 1.0%(+7.84)#44 | 0.84%(+8.00)#1,463 |
| 45. | Bridgeport | 8.8% | 1.0%(+7.82)#45 | 0.84%(+7.98)#1,466 |
| 46. | Bertsch Oceanview | 8.5% | 1.0%(+7.46)#46 | 0.84%(+7.62)#1,498 |
| 47. | Weaverville | 8.4% | 1.0%(+7.43)#47 | 0.84%(+7.59)#1,501 |
| 48. | Riverdale Park | 8.3% | 1.0%(+7.30)#48 | 0.84%(+7.46)#1,514 |
| 49. | Talmage | 8.2% | 1.0%(+7.24)#49 | 0.84%(+7.40)#1,520 |
| 50. | Smartsville | 8.2% | 1.0%(+7.18)#50 | 0.84%(+7.34)#1,526 |
| 51. | Cutten | 7.8% | 1.0%(+6.77)#51 | 0.84%(+6.93)#1,573 |
| 52. | California Pines | 7.7% | 1.0%(+6.72)#52 | 0.84%(+6.88)#1,581 |
| 53. | Westley | 7.6% | 1.0%(+6.64)#53 | 0.84%(+6.80)#1,589 |
| 54. | West Park | 7.6% | 1.0%(+6.58)#54 | 0.84%(+6.74)#1,598 |
| 55. | Huron | 7.5% | 1.0%(+6.46)#55 | 0.84%(+6.62)#1,606 |
| 56. | Summerland | 7.5% | 1.0%(+6.46)#56 | 0.84%(+6.62)#1,607 |
| 57. | Buena Vista | 7.3% | 1.0%(+6.29)#57 | 0.84%(+6.45)#1,624 |
| 58. | Yankee Hill | 7.2% | 1.0%(+6.23)#58 | 0.84%(+6.39)#1,632 |
| 59. | West Point | 7.2% | 1.0%(+6.21)#59 | 0.84%(+6.37)#1,636 |
| 60. | Orick | 7.1% | 1.0%(+6.14)#60 | 0.84%(+6.30)#1,639 |
| 61. | Airport | 6.9% | 1.0%(+5.92)#61 | 0.84%(+6.08)#1,666 |
| 62. | Alondra Park | 6.9% | 1.0%(+5.85)#62 | 0.84%(+6.01)#1,675 |
| 63. | Rackerby | 6.8% | 1.0%(+5.76)#63 | 0.84%(+5.92)#1,682 |
| 64. | North Shore | 6.7% | 1.0%(+5.74)#64 | 0.84%(+5.90)#1,685 |
| 65. | Aromas | 6.7% | 1.0%(+5.74)#65 | 0.84%(+5.90)#1,686 |
| 66. | Agua Dulce | 6.7% | 1.0%(+5.74)#66 | 0.84%(+5.90)#1,687 |
| 67. | Tuolumne City | 6.6% | 1.0%(+5.63)#67 | 0.84%(+5.79)#1,706 |
| 68. | South Oroville | 6.6% | 1.0%(+5.59)#68 | 0.84%(+5.75)#1,709 |
| 69. | Crescent City | 6.5% | 1.0%(+5.52)#69 | 0.84%(+5.68)#1,719 |
| 70. | Montalvin Manor | 6.5% | 1.0%(+5.51)#70 | 0.84%(+5.67)#1,720 |
| 71. | Fort Jones | 6.5% | 1.0%(+5.47)#71 | 0.84%(+5.63)#1,726 |
| 72. | Empire | 6.5% | 1.0%(+5.47)#72 | 0.84%(+5.63)#1,727 |
| 73. | Mckittrick | 6.5% | 1.0%(+5.45)#73 | 0.84%(+5.61)#1,732 |
| 74. | Bodega | 6.4% | 1.0%(+5.40)#74 | 0.84%(+5.56)#1,737 |
| 75. | North Fork | 6.3% | 1.0%(+5.31)#75 | 0.84%(+5.47)#1,750 |
| 76. | Woody | 6.2% | 1.0%(+5.25)#76 | 0.84%(+5.41)#1,760 |
| 77. | Rio Dell | 6.1% | 1.0%(+5.11)#77 | 0.84%(+5.27)#1,776 |
| 78. | Montgomery Creek | 6.1% | 1.0%(+5.07)#78 | 0.84%(+5.23)#1,784 |
| 79. | Baker | 5.8% | 1.0%(+4.79)#79 | 0.84%(+4.95)#1,836 |
| 80. | Montague | 5.7% | 1.0%(+4.66)#80 | 0.84%(+4.82)#1,850 |
| 81. | Hydesville | 5.7% | 1.0%(+4.66)#81 | 0.84%(+4.82)#1,851 |
| 82. | Herlong | 5.5% | 1.0%(+4.55)#82 | 0.84%(+4.71)#1,883 |
| 83. | Silverado Resort | 5.5% | 1.0%(+4.53)#83 | 0.84%(+4.69)#1,887 |
| 84. | Wallace | 5.4% | 1.0%(+4.43)#84 | 0.84%(+4.59)#1,906 |
| 85. | Blue Lake | 5.4% | 1.0%(+4.35)#85 | 0.84%(+4.51)#1,916 |
| 86. | Trinidad | 5.3% | 1.0%(+4.34)#86 | 0.84%(+4.50)#1,917 |
| 87. | Mesa Vista | 5.3% | 1.0%(+4.28)#87 | 0.84%(+4.44)#1,926 |
| 88. | Cleone | 5.2% | 1.0%(+4.17)#88 | 0.84%(+4.33)#1,951 |
| 89. | El Rio | 5.1% | 1.0%(+4.11)#89 | 0.84%(+4.27)#1,966 |
| 90. | Mojave | 5.0% | 1.0%(+3.99)#90 | 0.84%(+4.15)#1,998 |
| 91. | Monmouth | 5.0% | 1.0%(+3.95)#91 | 0.84%(+4.11)#2,006 |
| 92. | Boron | 4.9% | 1.0%(+3.94)#92 | 0.84%(+4.10)#2,007 |
| 93. | Mayflower Village | 4.9% | 1.0%(+3.86)#93 | 0.84%(+4.02)#2,025 |
| 94. | Friant | 4.7% | 1.0%(+3.73)#94 | 0.84%(+3.89)#2,047 |
| 95. | Olancha | 4.7% | 1.0%(+3.68)#95 | 0.84%(+3.84)#2,059 |
| 96. | Dos Palos | 4.7% | 1.0%(+3.66)#96 | 0.84%(+3.82)#2,065 |
| 97. | Commerce | 4.5% | 1.0%(+3.54)#97 | 0.84%(+3.70)#2,083 |
| 98. | Mesa | 4.5% | 1.0%(+3.54)#98 | 0.84%(+3.70)#2,086 |
| 99. | Sisquoc | 4.5% | 1.0%(+3.51)#99 | 0.84%(+3.67)#2,094 |
| 100. | Bass Lake | 4.4% | 1.0%(+3.40)#100 | 0.84%(+3.56)#2,125 |
Common Questions
What are the Top 10 Cities with the Highest Percentage of Native / Alaskan Population in California?
Top 10 Cities with the Highest Percentage of Native / Alaskan Population in California are:
#1
100.0%
#2
73.4%
#3
51.0%
#4
50.9%
#5
44.5%
#6
34.6%
#7
30.0%
#8
28.3%
#9
27.8%
#10
27.3%
What city has the Highest Percentage of Native / Alaskan Population in California?
Sattley has the Highest Percentage of Native / Alaskan Population in California with 100.0%.
What is the Percentage of Native / Alaskan Population in the State of California?
Percentage of Native / Alaskan Population in California is 1.0%.
What is the Percentage of Native / Alaskan Population in the United States?
Percentage of Native / Alaskan Population in the United States is 0.84%.