Cities with the Most Immigrants from Afghanistan in California
RELATED REPORTS & OPTIONS
Afghanistan
California
Compare Cities
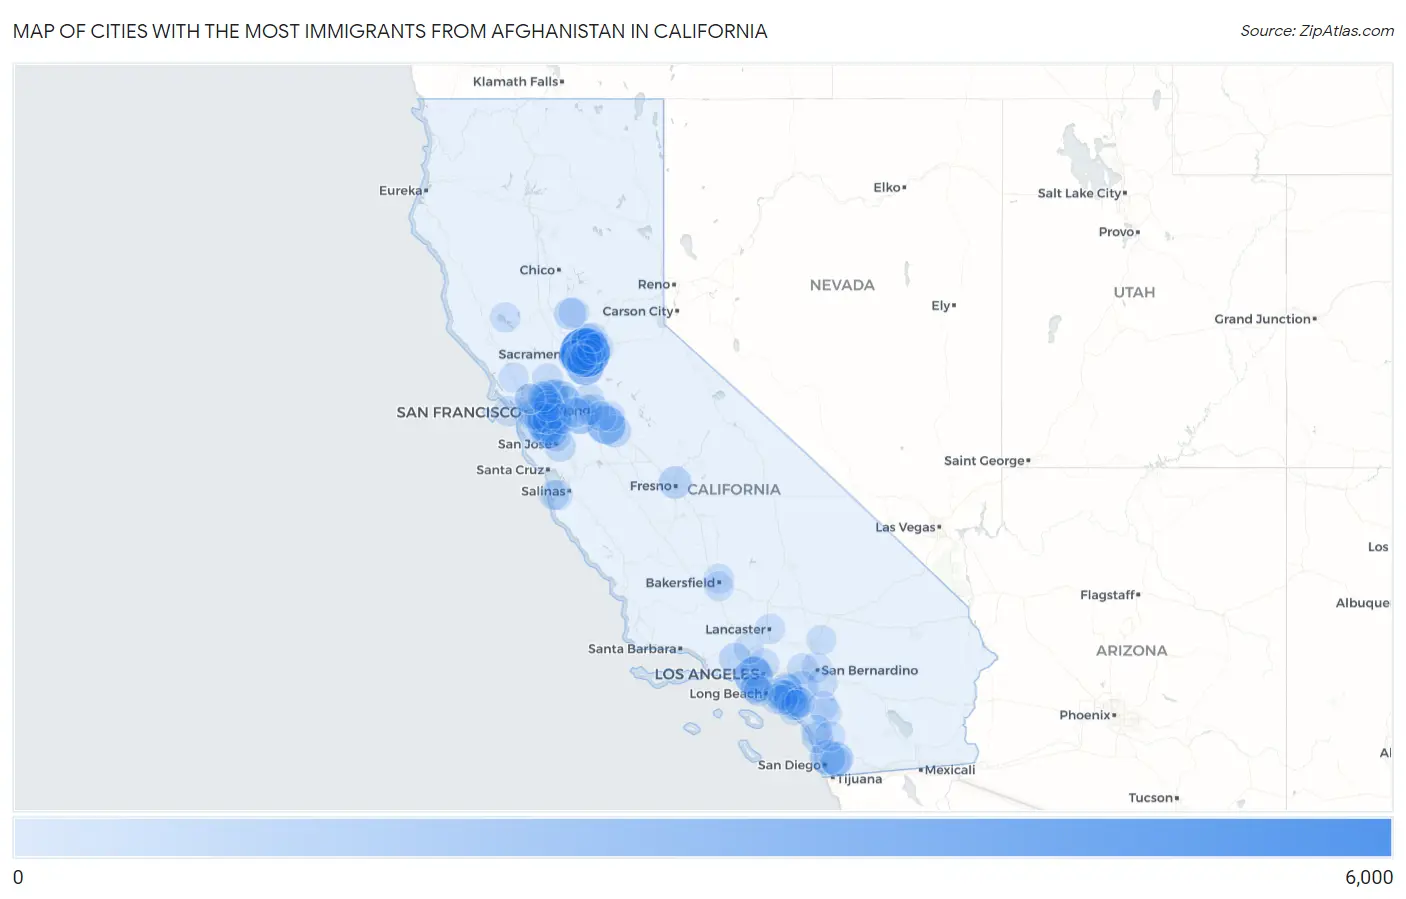
Map of Cities with the Most Immigrants from Afghanistan in California
0
6,000
Cities with the Most Immigrants from Afghanistan in California
| City | Afghanistan | vs State | vs National | |
| 1. | Arden Arcade | 5,256 | 53,260(9.87%)#1 | 136,364(3.85%)#1 |
| 2. | Sacramento | 2,222 | 53,260(4.17%)#2 | 136,364(1.63%)#6 |
| 3. | Los Angeles | 2,186 | 53,260(4.10%)#3 | 136,364(1.60%)#7 |
| 4. | Modesto | 2,155 | 53,260(4.05%)#4 | 136,364(1.58%)#8 |
| 5. | Elk Grove | 2,077 | 53,260(3.90%)#5 | 136,364(1.52%)#9 |
| 6. | Fremont | 1,880 | 53,260(3.53%)#6 | 136,364(1.38%)#10 |
| 7. | Carmichael | 1,627 | 53,260(3.05%)#7 | 136,364(1.19%)#12 |
| 8. | Foothill Farms | 1,592 | 53,260(2.99%)#8 | 136,364(1.17%)#14 |
| 9. | North Highlands | 1,567 | 53,260(2.94%)#9 | 136,364(1.15%)#15 |
| 10. | Hayward | 1,481 | 53,260(2.78%)#10 | 136,364(1.09%)#16 |
| 11. | Tracy | 1,472 | 53,260(2.76%)#11 | 136,364(1.08%)#17 |
| 12. | Concord | 1,346 | 53,260(2.53%)#12 | 136,364(0.99%)#19 |
| 13. | San Diego | 1,305 | 53,260(2.45%)#13 | 136,364(0.96%)#20 |
| 14. | Union City | 1,165 | 53,260(2.19%)#14 | 136,364(0.85%)#23 |
| 15. | El Cajon | 1,041 | 53,260(1.95%)#15 | 136,364(0.76%)#27 |
| 16. | Irvine | 962 | 53,260(1.81%)#16 | 136,364(0.71%)#29 |
| 17. | Antioch | 889 | 53,260(1.67%)#17 | 136,364(0.65%)#30 |
| 18. | Dublin | 794 | 53,260(1.49%)#18 | 136,364(0.58%)#31 |
| 19. | Corona | 775 | 53,260(1.46%)#19 | 136,364(0.57%)#33 |
| 20. | Roseville | 744 | 53,260(1.40%)#20 | 136,364(0.55%)#34 |
| 21. | West Sacramento | 712 | 53,260(1.34%)#21 | 136,364(0.52%)#35 |
| 22. | Fresno | 703 | 53,260(1.32%)#22 | 136,364(0.52%)#37 |
| 23. | Rancho Cordova | 654 | 53,260(1.23%)#23 | 136,364(0.48%)#40 |
| 24. | Alameda | 598 | 53,260(1.12%)#24 | 136,364(0.44%)#43 |
| 25. | Turlock | 582 | 53,260(1.09%)#25 | 136,364(0.43%)#44 |
| 26. | Anaheim | 555 | 53,260(1.04%)#26 | 136,364(0.41%)#45 |
| 27. | Simi Valley | 532 | 53,260(1.00%)#27 | 136,364(0.39%)#49 |
| 28. | Vineyard | 532 | 53,260(1.00%)#28 | 136,364(0.39%)#50 |
| 29. | Yuba City | 522 | 53,260(0.98%)#29 | 136,364(0.38%)#51 |
| 30. | Pleasanton | 473 | 53,260(0.89%)#30 | 136,364(0.35%)#56 |
| 31. | Carlsbad | 428 | 53,260(0.80%)#31 | 136,364(0.31%)#58 |
| 32. | Florin | 415 | 53,260(0.78%)#32 | 136,364(0.30%)#62 |
| 33. | San Jose | 411 | 53,260(0.77%)#33 | 136,364(0.30%)#63 |
| 34. | Pittsburg | 373 | 53,260(0.70%)#34 | 136,364(0.27%)#65 |
| 35. | Brentwood | 371 | 53,260(0.70%)#35 | 136,364(0.27%)#66 |
| 36. | Manteca | 314 | 53,260(0.59%)#36 | 136,364(0.23%)#81 |
| 37. | Orange | 300 | 53,260(0.56%)#37 | 136,364(0.22%)#87 |
| 38. | Tustin | 274 | 53,260(0.51%)#38 | 136,364(0.20%)#98 |
| 39. | Newark | 271 | 53,260(0.51%)#39 | 136,364(0.20%)#100 |
| 40. | Oakland | 267 | 53,260(0.50%)#40 | 136,364(0.20%)#101 |
| 41. | Contra Costa Centre | 265 | 53,260(0.50%)#41 | 136,364(0.19%)#102 |
| 42. | San Leandro | 254 | 53,260(0.48%)#42 | 136,364(0.19%)#104 |
| 43. | Walnut Creek | 233 | 53,260(0.44%)#43 | 136,364(0.17%)#115 |
| 44. | Pleasant Hill | 232 | 53,260(0.44%)#44 | 136,364(0.17%)#116 |
| 45. | Lake Forest | 229 | 53,260(0.43%)#45 | 136,364(0.17%)#119 |
| 46. | Garden Grove | 220 | 53,260(0.41%)#46 | 136,364(0.16%)#123 |
| 47. | Beverly Hills | 211 | 53,260(0.40%)#47 | 136,364(0.15%)#127 |
| 48. | Laguna Niguel | 209 | 53,260(0.39%)#48 | 136,364(0.15%)#129 |
| 49. | Murrieta | 194 | 53,260(0.36%)#49 | 136,364(0.14%)#136 |
| 50. | Temecula | 192 | 53,260(0.36%)#50 | 136,364(0.14%)#137 |
| 51. | Ashland | 192 | 53,260(0.36%)#51 | 136,364(0.14%)#138 |
| 52. | Santa Ana | 187 | 53,260(0.35%)#52 | 136,364(0.14%)#143 |
| 53. | Laguna Hills | 181 | 53,260(0.34%)#53 | 136,364(0.13%)#147 |
| 54. | Torrance | 180 | 53,260(0.34%)#54 | 136,364(0.13%)#149 |
| 55. | Glendale | 176 | 53,260(0.33%)#55 | 136,364(0.13%)#153 |
| 56. | Redondo Beach | 171 | 53,260(0.32%)#56 | 136,364(0.13%)#160 |
| 57. | Fairfield | 170 | 53,260(0.32%)#57 | 136,364(0.12%)#161 |
| 58. | Rancho Cucamonga | 163 | 53,260(0.31%)#58 | 136,364(0.12%)#166 |
| 59. | Antelope | 163 | 53,260(0.31%)#59 | 136,364(0.12%)#167 |
| 60. | San Francisco | 158 | 53,260(0.30%)#60 | 136,364(0.12%)#169 |
| 61. | San Mateo | 155 | 53,260(0.29%)#61 | 136,364(0.11%)#173 |
| 62. | Marysville | 155 | 53,260(0.29%)#62 | 136,364(0.11%)#174 |
| 63. | Lathrop | 154 | 53,260(0.29%)#63 | 136,364(0.11%)#176 |
| 64. | Milpitas | 153 | 53,260(0.29%)#64 | 136,364(0.11%)#177 |
| 65. | Lemon Hill | 152 | 53,260(0.29%)#65 | 136,364(0.11%)#179 |
| 66. | San Ramon | 148 | 53,260(0.28%)#66 | 136,364(0.11%)#181 |
| 67. | Oceanside | 146 | 53,260(0.27%)#67 | 136,364(0.11%)#185 |
| 68. | Livermore | 145 | 53,260(0.27%)#68 | 136,364(0.11%)#187 |
| 69. | Casa De Oro Mount Helix | 135 | 53,260(0.25%)#69 | 136,364(0.10%)#195 |
| 70. | La Riviera | 133 | 53,260(0.25%)#70 | 136,364(0.10%)#197 |
| 71. | Santa Clarita | 128 | 53,260(0.24%)#71 | 136,364(0.09%)#207 |
| 72. | Fairview | 124 | 53,260(0.23%)#72 | 136,364(0.09%)#213 |
| 73. | Fair Oaks | 118 | 53,260(0.22%)#73 | 136,364(0.09%)#223 |
| 74. | Lucerne | 113 | 53,260(0.21%)#74 | 136,364(0.08%)#229 |
| 75. | Oildale | 109 | 53,260(0.20%)#75 | 136,364(0.08%)#236 |
| 76. | Monterey | 108 | 53,260(0.20%)#76 | 136,364(0.08%)#238 |
| 77. | Mission Viejo | 105 | 53,260(0.20%)#77 | 136,364(0.08%)#243 |
| 78. | Stockton | 100 | 53,260(0.19%)#78 | 136,364(0.07%)#248 |
| 79. | Lancaster | 100 | 53,260(0.19%)#79 | 136,364(0.07%)#249 |
| 80. | Escondido | 100 | 53,260(0.19%)#80 | 136,364(0.07%)#250 |
| 81. | San Pablo | 100 | 53,260(0.19%)#81 | 136,364(0.07%)#253 |
| 82. | Huntington Beach | 96 | 53,260(0.18%)#82 | 136,364(0.07%)#257 |
| 83. | San Bernardino | 94 | 53,260(0.18%)#83 | 136,364(0.07%)#261 |
| 84. | Riverbank | 93 | 53,260(0.17%)#84 | 136,364(0.07%)#264 |
| 85. | Costa Mesa | 89 | 53,260(0.17%)#85 | 136,364(0.07%)#274 |
| 86. | Richmond | 87 | 53,260(0.16%)#86 | 136,364(0.06%)#280 |
| 87. | Salida | 84 | 53,260(0.16%)#87 | 136,364(0.06%)#285 |
| 88. | Lomita | 83 | 53,260(0.16%)#88 | 136,364(0.06%)#287 |
| 89. | Pacific Grove | 82 | 53,260(0.15%)#89 | 136,364(0.06%)#289 |
| 90. | Bakersfield | 78 | 53,260(0.15%)#90 | 136,364(0.06%)#294 |
| 91. | Alamo | 77 | 53,260(0.14%)#91 | 136,364(0.06%)#300 |
| 92. | Martinez | 75 | 53,260(0.14%)#92 | 136,364(0.05%)#302 |
| 93. | Rancho Santa Margarita | 74 | 53,260(0.14%)#93 | 136,364(0.05%)#304 |
| 94. | Folsom | 73 | 53,260(0.14%)#94 | 136,364(0.05%)#305 |
| 95. | Parkway | 73 | 53,260(0.14%)#95 | 136,364(0.05%)#308 |
| 96. | Petaluma | 71 | 53,260(0.13%)#96 | 136,364(0.05%)#311 |
| 97. | Moreno Valley | 70 | 53,260(0.13%)#97 | 136,364(0.05%)#315 |
| 98. | Rocklin | 70 | 53,260(0.13%)#98 | 136,364(0.05%)#316 |
| 99. | Mountain House | 70 | 53,260(0.13%)#99 | 136,364(0.05%)#317 |
| 100. | Apple Valley | 67 | 53,260(0.13%)#100 | 136,364(0.05%)#321 |
Common Questions
What are the Top 10 Cities with the Most Immigrants from Afghanistan in California?
Top 10 Cities with the Most Immigrants from Afghanistan in California are:
#1
5,256
#2
2,222
#3
2,186
#4
2,155
#5
2,077
#6
1,880
#7
1,627
#8
1,592
#9
1,567
#10
1,481
What city has the Most Immigrants from Afghanistan in California?
Arden Arcade has the Most Immigrants from Afghanistan in California with 5,256.
What is the Total Immigrants from Afghanistan in the State of California?
Total Immigrants from Afghanistan in California is 53,260.
What is the Total Immigrants from Afghanistan in the United States?
Total Immigrants from Afghanistan in the United States is 136,364.