Cities with the Highest Percentage of Northern European Population in California
RELATED REPORTS & OPTIONS
Northern European
California
Compare Cities
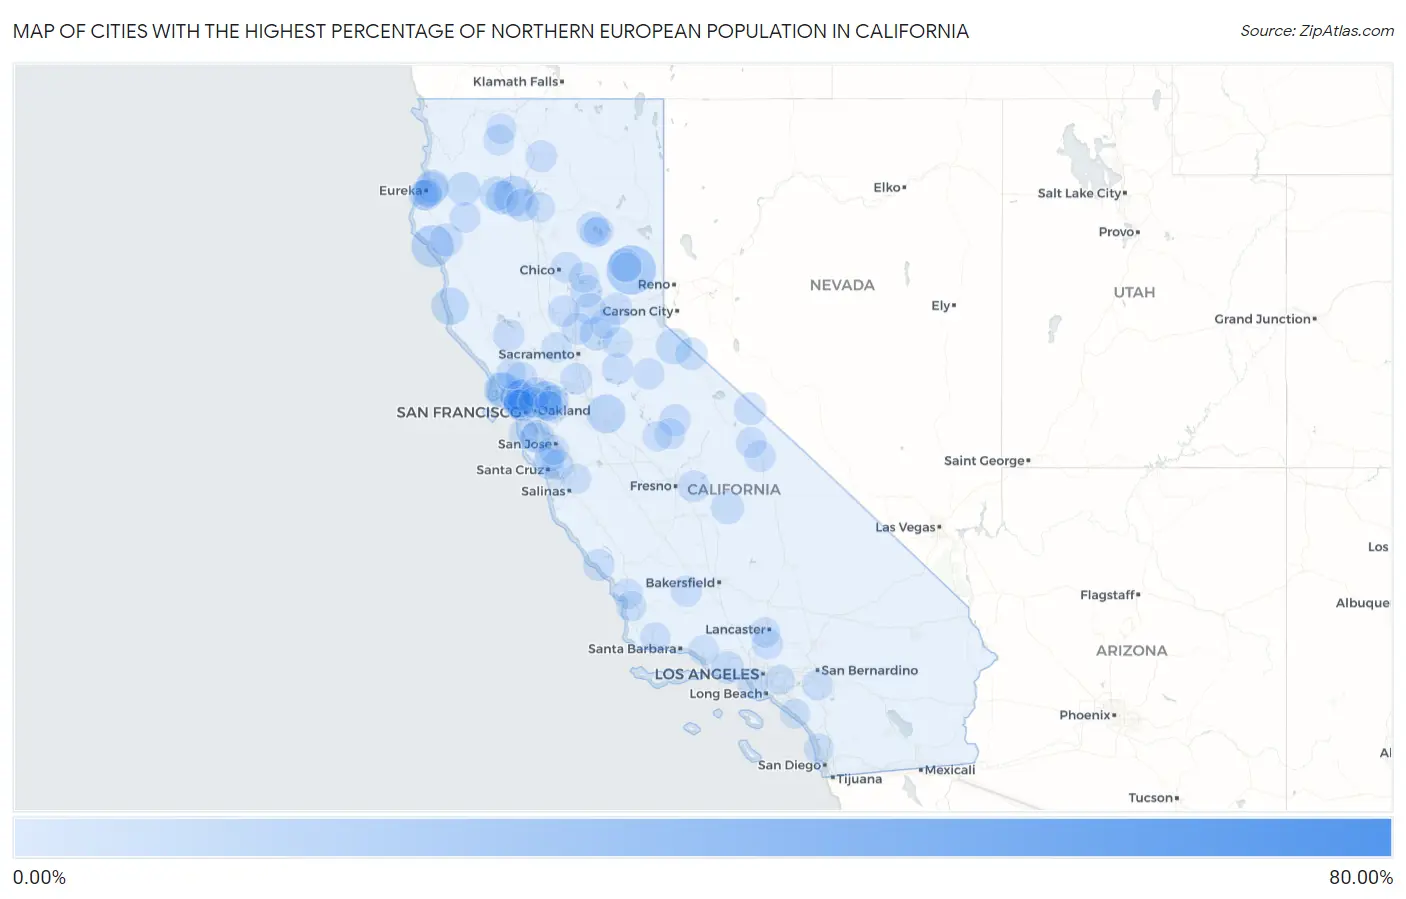
Map of Cities with the Highest Percentage of Northern European Population in California
0.00%
80.00%
Cities with the Highest Percentage of Northern European Population in California
| City | Northern European | vs State | vs National | |
| 1. | Post Mountain | 78.22% | 0.19%(+78.0)#1 | 0.15%(+78.1)#2 |
| 2. | Whitehawk | 18.03% | 0.19%(+17.8)#2 | 0.15%(+17.9)#19 |
| 3. | Shelter Cove | 11.80% | 0.19%(+11.6)#3 | 0.15%(+11.7)#37 |
| 4. | French Gulch | 9.89% | 0.19%(+9.70)#4 | 0.15%(+9.75)#48 |
| 5. | Del Rio | 8.81% | 0.19%(+8.62)#5 | 0.15%(+8.67)#55 |
| 6. | Salyer | 8.28% | 0.19%(+8.09)#6 | 0.15%(+8.14)#62 |
| 7. | Albion | 7.66% | 0.19%(+7.47)#7 | 0.15%(+7.51)#67 |
| 8. | Reliez Valley | 6.83% | 0.19%(+6.64)#8 | 0.15%(+6.69)#75 |
| 9. | Markleeville | 6.13% | 0.19%(+5.94)#9 | 0.15%(+5.99)#85 |
| 10. | Point Reyes Station | 5.48% | 0.19%(+5.29)#10 | 0.15%(+5.34)#95 |
| 11. | Inverness | 5.38% | 0.19%(+5.19)#11 | 0.15%(+5.23)#97 |
| 12. | Weaverville | 4.80% | 0.19%(+4.61)#12 | 0.15%(+4.65)#115 |
| 13. | Burnt Ranch | 4.39% | 0.19%(+4.19)#13 | 0.15%(+4.24)#133 |
| 14. | Indianola | 4.32% | 0.19%(+4.13)#14 | 0.15%(+4.18)#135 |
| 15. | San Anselmo | 4.23% | 0.19%(+4.04)#15 | 0.15%(+4.08)#137 |
| 16. | Arcata | 4.22% | 0.19%(+4.03)#16 | 0.15%(+4.07)#138 |
| 17. | Lewiston | 4.10% | 0.19%(+3.91)#17 | 0.15%(+3.96)#139 |
| 18. | Penryn | 4.05% | 0.19%(+3.85)#18 | 0.15%(+3.90)#141 |
| 19. | Three Rivers | 4.01% | 0.19%(+3.81)#19 | 0.15%(+3.86)#143 |
| 20. | Redway | 3.90% | 0.19%(+3.71)#20 | 0.15%(+3.75)#149 |
| 21. | Plumas Eureka | 3.83% | 0.19%(+3.64)#21 | 0.15%(+3.68)#154 |
| 22. | Sleepy Hollow | 3.82% | 0.19%(+3.62)#22 | 0.15%(+3.67)#156 |
| 23. | Shasta | 3.78% | 0.19%(+3.59)#23 | 0.15%(+3.63)#157 |
| 24. | Lake Sherwood | 3.46% | 0.19%(+3.27)#24 | 0.15%(+3.32)#179 |
| 25. | Tiburon | 3.41% | 0.19%(+3.22)#25 | 0.15%(+3.26)#183 |
| 26. | Benton | 3.31% | 0.19%(+3.12)#26 | 0.15%(+3.16)#191 |
| 27. | Amador Pines | 3.21% | 0.19%(+3.02)#27 | 0.15%(+3.07)#195 |
| 28. | West Menlo Park | 3.20% | 0.19%(+3.01)#28 | 0.15%(+3.06)#196 |
| 29. | Rackerby | 3.15% | 0.19%(+2.96)#29 | 0.15%(+3.01)#200 |
| 30. | Coleville | 3.09% | 0.19%(+2.90)#30 | 0.15%(+2.95)#204 |
| 31. | Dutch Flat | 2.88% | 0.19%(+2.69)#31 | 0.15%(+2.74)#214 |
| 32. | Chester | 2.82% | 0.19%(+2.63)#32 | 0.15%(+2.67)#221 |
| 33. | Cold Springs Cdp El Dorado County | 2.78% | 0.19%(+2.59)#33 | 0.15%(+2.63)#227 |
| 34. | Corte Madera | 2.73% | 0.19%(+2.54)#34 | 0.15%(+2.58)#239 |
| 35. | Mccloud | 2.71% | 0.19%(+2.52)#35 | 0.15%(+2.56)#242 |
| 36. | Walnut Grove | 2.70% | 0.19%(+2.51)#36 | 0.15%(+2.56)#243 |
| 37. | Smartsville | 2.64% | 0.19%(+2.45)#37 | 0.15%(+2.49)#251 |
| 38. | Minkler | 2.64% | 0.19%(+2.44)#38 | 0.15%(+2.49)#252 |
| 39. | Cobb | 2.63% | 0.19%(+2.44)#39 | 0.15%(+2.48)#256 |
| 40. | Belvedere | 2.62% | 0.19%(+2.43)#40 | 0.15%(+2.47)#259 |
| 41. | San Simeon | 2.61% | 0.19%(+2.41)#41 | 0.15%(+2.46)#260 |
| 42. | Trowbridge | 2.60% | 0.19%(+2.41)#42 | 0.15%(+2.46)#261 |
| 43. | Diablo | 2.59% | 0.19%(+2.40)#43 | 0.15%(+2.44)#264 |
| 44. | El Portal | 2.51% | 0.19%(+2.31)#44 | 0.15%(+2.36)#286 |
| 45. | Temelec | 2.48% | 0.19%(+2.29)#45 | 0.15%(+2.33)#290 |
| 46. | Scotts Valley | 2.43% | 0.19%(+2.23)#46 | 0.15%(+2.28)#301 |
| 47. | Sutter | 2.42% | 0.19%(+2.23)#47 | 0.15%(+2.28)#302 |
| 48. | Sutter Creek | 2.41% | 0.19%(+2.21)#48 | 0.15%(+2.26)#305 |
| 49. | Dorrington | 2.21% | 0.19%(+2.02)#49 | 0.15%(+2.06)#344 |
| 50. | Big Pine | 2.18% | 0.19%(+1.98)#50 | 0.15%(+2.03)#350 |
| 51. | Derby Acres | 2.16% | 0.19%(+1.97)#51 | 0.15%(+2.02)#354 |
| 52. | Bootjack | 2.08% | 0.19%(+1.88)#52 | 0.15%(+1.93)#372 |
| 53. | Acton | 2.07% | 0.19%(+1.88)#53 | 0.15%(+1.93)#373 |
| 54. | Santa Venetia | 2.06% | 0.19%(+1.87)#54 | 0.15%(+1.91)#376 |
| 55. | Butte Creek Canyon | 2.03% | 0.19%(+1.84)#55 | 0.15%(+1.88)#381 |
| 56. | Pine Hills | 2.02% | 0.19%(+1.83)#56 | 0.15%(+1.88)#384 |
| 57. | Castle Hill | 1.98% | 0.19%(+1.79)#57 | 0.15%(+1.83)#390 |
| 58. | Day Valley | 1.94% | 0.19%(+1.75)#58 | 0.15%(+1.79)#399 |
| 59. | Mad River | 1.86% | 0.19%(+1.67)#59 | 0.15%(+1.72)#421 |
| 60. | Elfin Forest | 1.85% | 0.19%(+1.66)#60 | 0.15%(+1.70)#427 |
| 61. | Pacheco | 1.84% | 0.19%(+1.65)#61 | 0.15%(+1.70)#430 |
| 62. | Mill Valley | 1.82% | 0.19%(+1.63)#62 | 0.15%(+1.68)#437 |
| 63. | Etna | 1.81% | 0.19%(+1.62)#63 | 0.15%(+1.67)#440 |
| 64. | West Bishop | 1.81% | 0.19%(+1.62)#64 | 0.15%(+1.66)#441 |
| 65. | El Segundo | 1.81% | 0.19%(+1.62)#65 | 0.15%(+1.66)#442 |
| 66. | Crockett | 1.79% | 0.19%(+1.60)#66 | 0.15%(+1.64)#446 |
| 67. | Placerville | 1.74% | 0.19%(+1.55)#67 | 0.15%(+1.59)#460 |
| 68. | Woodside | 1.73% | 0.19%(+1.54)#68 | 0.15%(+1.58)#463 |
| 69. | Berry Creek | 1.69% | 0.19%(+1.50)#69 | 0.15%(+1.54)#480 |
| 70. | March Arb | 1.62% | 0.19%(+1.42)#70 | 0.15%(+1.47)#515 |
| 71. | Solvang | 1.61% | 0.19%(+1.42)#71 | 0.15%(+1.46)#522 |
| 72. | Penngrove | 1.60% | 0.19%(+1.41)#72 | 0.15%(+1.46)#524 |
| 73. | Tamalpais Homestead Valley | 1.57% | 0.19%(+1.38)#73 | 0.15%(+1.43)#539 |
| 74. | Kensington | 1.56% | 0.19%(+1.37)#74 | 0.15%(+1.42)#543 |
| 75. | Monument Hills | 1.56% | 0.19%(+1.37)#75 | 0.15%(+1.41)#544 |
| 76. | Fort Jones | 1.46% | 0.19%(+1.26)#76 | 0.15%(+1.31)#581 |
| 77. | San Juan Bautista | 1.42% | 0.19%(+1.22)#77 | 0.15%(+1.27)#602 |
| 78. | Oak View | 1.41% | 0.19%(+1.21)#78 | 0.15%(+1.26)#608 |
| 79. | Los Ranchos | 1.40% | 0.19%(+1.21)#79 | 0.15%(+1.25)#609 |
| 80. | Catheys Valley | 1.38% | 0.19%(+1.19)#80 | 0.15%(+1.24)#623 |
| 81. | Woodlands | 1.35% | 0.19%(+1.16)#81 | 0.15%(+1.20)#635 |
| 82. | Clayton | 1.32% | 0.19%(+1.13)#82 | 0.15%(+1.17)#663 |
| 83. | Half Moon Bay | 1.32% | 0.19%(+1.12)#83 | 0.15%(+1.17)#667 |
| 84. | Lexington Hills | 1.31% | 0.19%(+1.12)#84 | 0.15%(+1.17)#668 |
| 85. | Meadow Vista | 1.31% | 0.19%(+1.12)#85 | 0.15%(+1.16)#671 |
| 86. | Del Mar | 1.29% | 0.19%(+1.10)#86 | 0.15%(+1.14)#683 |
| 87. | Quartz Hill | 1.29% | 0.19%(+1.10)#87 | 0.15%(+1.14)#684 |
| 88. | Fields Landing | 1.27% | 0.19%(+1.08)#88 | 0.15%(+1.12)#690 |
| 89. | Graeagle | 1.25% | 0.19%(+1.05)#89 | 0.15%(+1.10)#700 |
| 90. | Lake Almanor West | 1.24% | 0.19%(+1.05)#90 | 0.15%(+1.09)#702 |
| 91. | Cambrian Park | 1.24% | 0.19%(+1.05)#91 | 0.15%(+1.09)#704 |
| 92. | Highlands | 1.21% | 0.19%(+1.02)#92 | 0.15%(+1.06)#719 |
| 93. | Bonadelle Ranchos | 1.21% | 0.19%(+1.01)#93 | 0.15%(+1.06)#721 |
| 94. | Meyers | 1.17% | 0.19%(+0.976)#94 | 0.15%(+1.02)#744 |
| 95. | La Habra Heights | 1.16% | 0.19%(+0.969)#95 | 0.15%(+1.01)#750 |
| 96. | Dana Point | 1.15% | 0.19%(+0.958)#96 | 0.15%(+1.00)#757 |
| 97. | Cutten | 1.15% | 0.19%(+0.956)#97 | 0.15%(+1.00)#760 |
| 98. | Alamo | 1.14% | 0.19%(+0.950)#98 | 0.15%(+0.995)#768 |
| 99. | Lake Almanor Country Club | 1.13% | 0.19%(+0.942)#99 | 0.15%(+0.987)#774 |
| 100. | Millville | 1.13% | 0.19%(+0.941)#100 | 0.15%(+0.986)#775 |
Common Questions
What are the Top 10 Cities with the Highest Percentage of Northern European Population in California?
Top 10 Cities with the Highest Percentage of Northern European Population in California are:
#1
18.03%
#2
11.80%
#3
9.89%
#4
8.81%
#5
7.66%
#6
6.83%
#7
6.13%
#8
5.48%
#9
5.38%
#10
4.80%
What city has the Highest Percentage of Northern European Population in California?
Whitehawk has the Highest Percentage of Northern European Population in California with 18.03%.
What is the Percentage of Northern European Population in the State of California?
Percentage of Northern European Population in California is 0.19%.
What is the Percentage of Northern European Population in the United States?
Percentage of Northern European Population in the United States is 0.15%.