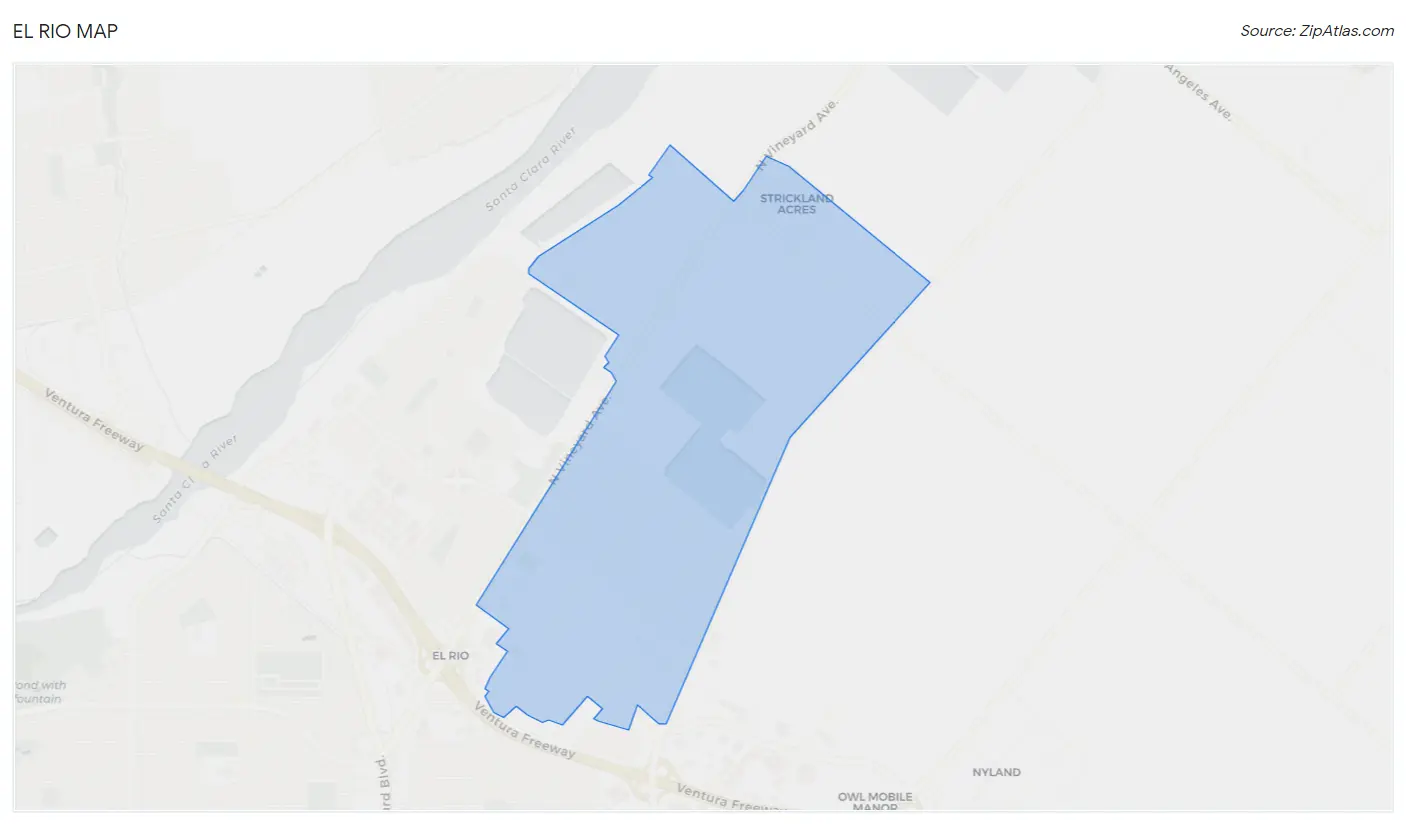
El Rio, CA Map & Demographics
El Rio Map
El Rio Overview
$27,548
PER CAPITA INCOME
$74,688
AVG FAMILY INCOME
$69,665
AVG HOUSEHOLD INCOME
14.8%
WAGE / INCOME GAP [ % ]
85.2¢/ $1
WAGE / INCOME GAP [ $ ]
0.39
INEQUALITY / GINI INDEX
6,418
TOTAL POPULATION
3,143
MALE POPULATION
3,275
FEMALE POPULATION
95.97
MALES / 100 FEMALES
104.20
FEMALES / 100 MALES
35.5
MEDIAN AGE
4.2
AVG FAMILY SIZE
3.8
AVG HOUSEHOLD SIZE
3,238
LABOR FORCE [ PEOPLE ]
66.7%
PERCENT IN LABOR FORCE
12.7%
UNEMPLOYMENT RATE
Income in El Rio
Income Overview in El Rio
Per Capita Income in El Rio is $27,548, while median incomes of families and households are $74,688 and $69,665 respectively.
| Characteristic | Number | Measure |
| Per Capita Income | 6,418 | $27,548 |
| Median Family Income | 1,403 | $74,688 |
| Mean Family Income | 1,403 | $94,491 |
| Median Household Income | 1,697 | $69,665 |
| Mean Household Income | 1,697 | $97,717 |
| Income Deficit | 1,403 | $0 |
| Wage / Income Gap (%) | 6,418 | 14.81% |
| Wage / Income Gap ($) | 6,418 | 85.19¢ per $1 |
| Gini / Inequality Index | 6,418 | 0.39 |
Earnings by Sex in El Rio
Average Earnings in El Rio are $34,422, $38,750 for men and $33,011 for women, a difference of 14.8%.
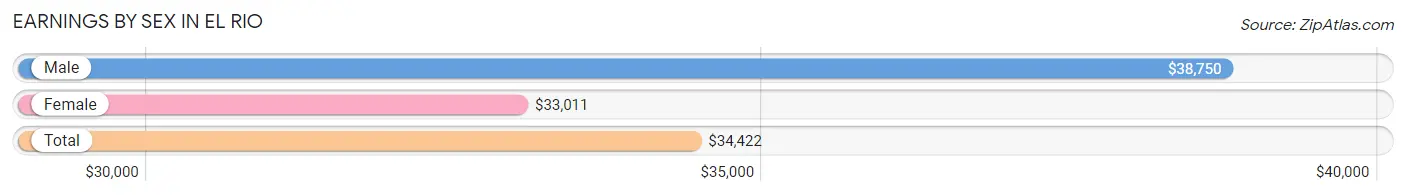
| Sex | Number | Average Earnings |
| Male | 1,763 (55.8%) | $38,750 |
| Female | 1,397 (44.2%) | $33,011 |
| Total | 3,160 (100.0%) | $34,422 |
Earnings by Sex by Income Bracket in El Rio
The most common earnings brackets in El Rio are $30,000 to $34,999 for men (291 | 16.5%) and $30,000 to $34,999 for women (201 | 14.4%).
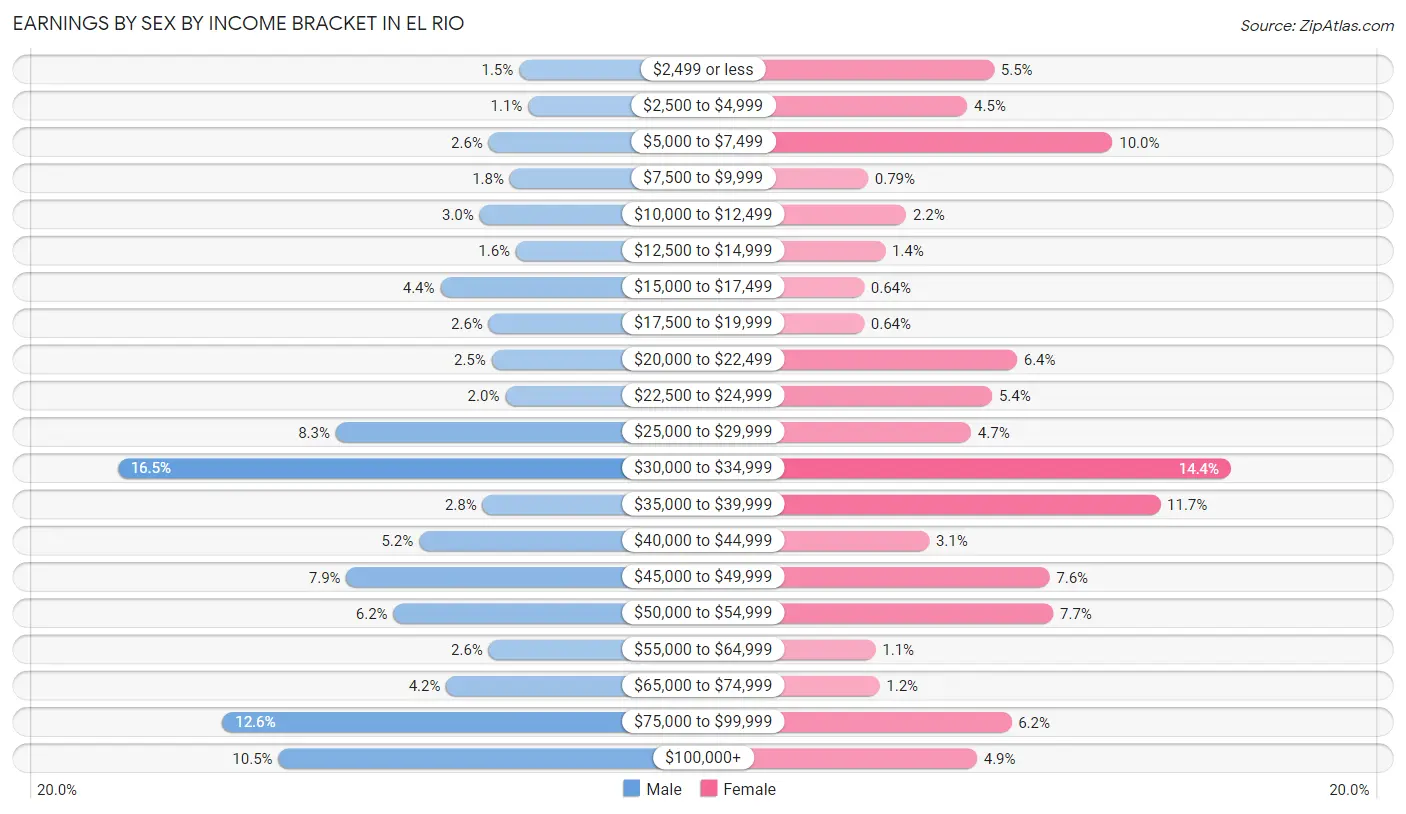
| Income | Male | Female |
| $2,499 or less | 26 (1.5%) | 77 (5.5%) |
| $2,500 to $4,999 | 20 (1.1%) | 63 (4.5%) |
| $5,000 to $7,499 | 46 (2.6%) | 139 (10.0%) |
| $7,500 to $9,999 | 32 (1.8%) | 11 (0.8%) |
| $10,000 to $12,499 | 52 (2.9%) | 31 (2.2%) |
| $12,500 to $14,999 | 28 (1.6%) | 20 (1.4%) |
| $15,000 to $17,499 | 78 (4.4%) | 9 (0.6%) |
| $17,500 to $19,999 | 46 (2.6%) | 9 (0.6%) |
| $20,000 to $22,499 | 44 (2.5%) | 89 (6.4%) |
| $22,500 to $24,999 | 35 (2.0%) | 76 (5.4%) |
| $25,000 to $29,999 | 147 (8.3%) | 65 (4.6%) |
| $30,000 to $34,999 | 291 (16.5%) | 201 (14.4%) |
| $35,000 to $39,999 | 50 (2.8%) | 164 (11.7%) |
| $40,000 to $44,999 | 92 (5.2%) | 43 (3.1%) |
| $45,000 to $49,999 | 140 (7.9%) | 106 (7.6%) |
| $50,000 to $54,999 | 109 (6.2%) | 108 (7.7%) |
| $55,000 to $64,999 | 46 (2.6%) | 15 (1.1%) |
| $65,000 to $74,999 | 74 (4.2%) | 17 (1.2%) |
| $75,000 to $99,999 | 222 (12.6%) | 86 (6.2%) |
| $100,000+ | 185 (10.5%) | 68 (4.9%) |
| Total | 1,763 (100.0%) | 1,397 (100.0%) |
Earnings by Sex by Educational Attainment in El Rio
Average earnings in El Rio are $41,647 for men and $35,366 for women, a difference of 15.1%. Men with an educational attainment of college or associate's degree enjoy the highest average annual earnings of $75,278, while those with less than high school education earn the least with $31,107. Women with an educational attainment of bachelor's degree earn the most with the average annual earnings of $64,063, while those with less than high school education have the smallest earnings of $24,375.
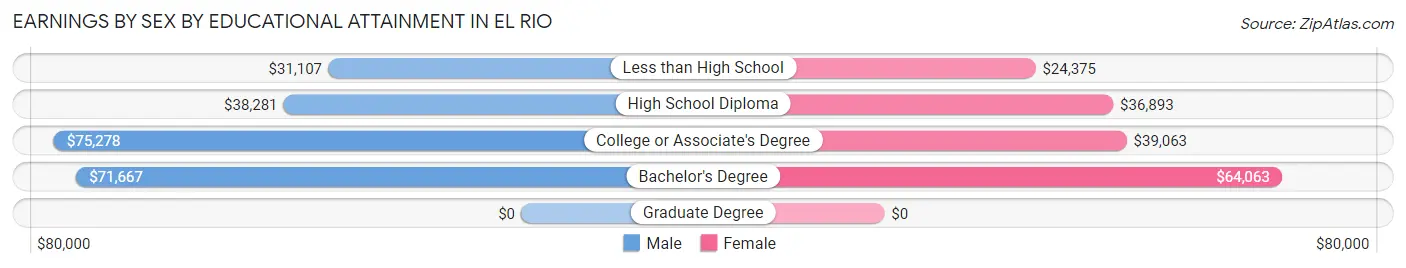
| Educational Attainment | Male Income | Female Income |
| Less than High School | $31,107 | $24,375 |
| High School Diploma | $38,281 | $36,893 |
| College or Associate's Degree | $75,278 | $39,063 |
| Bachelor's Degree | $71,667 | $64,063 |
| Graduate Degree | - | - |
| Total | $41,647 | $35,366 |
Family Income in El Rio
Family Income Brackets in El Rio
According to the El Rio family income data, there are 295 families falling into the $50,000 to $74,999 income range, which is the most common income bracket and makes up 21.0% of all families. Conversely, the less than $10,000 income bracket is the least frequent group with only 22 families (1.6%) belonging to this category.
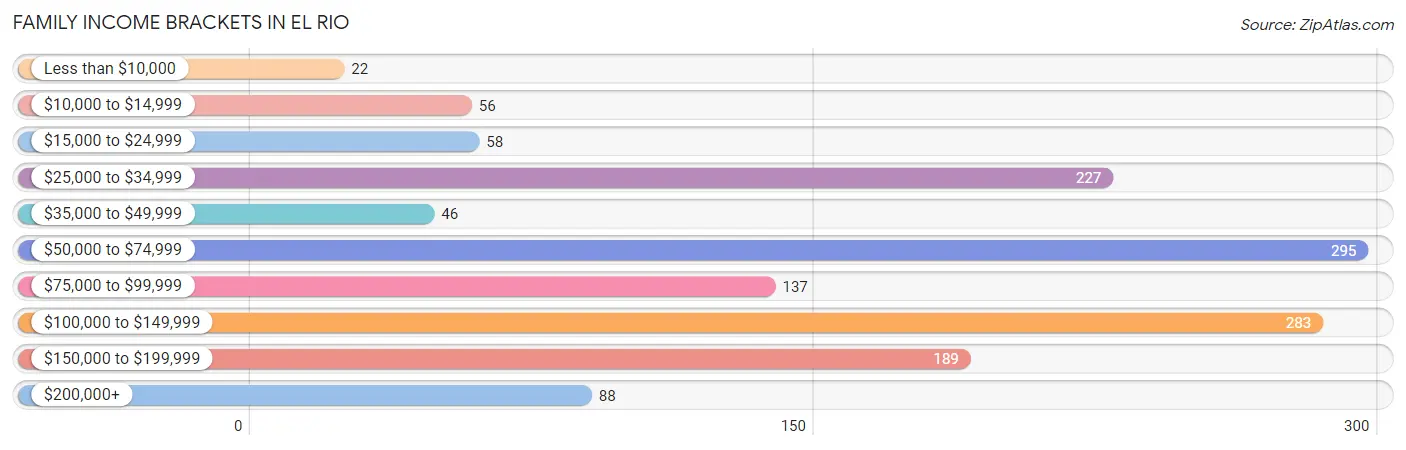
| Income Bracket | # Families | % Families |
| Less than $10,000 | 22 | 1.6% |
| $10,000 to $14,999 | 56 | 4.0% |
| $15,000 to $24,999 | 58 | 4.1% |
| $25,000 to $34,999 | 227 | 16.2% |
| $35,000 to $49,999 | 46 | 3.3% |
| $50,000 to $74,999 | 295 | 21.0% |
| $75,000 to $99,999 | 137 | 9.8% |
| $100,000 to $149,999 | 283 | 20.2% |
| $150,000 to $199,999 | 189 | 13.5% |
| $200,000+ | 88 | 6.3% |
Family Income by Famaliy Size in El Rio
7+ person families (90 | 6.4%) account for the highest median family income in El Rio with $128,846 per family, while 2-person families (351 | 25.0%) have the highest median income of $34,288 per family member.
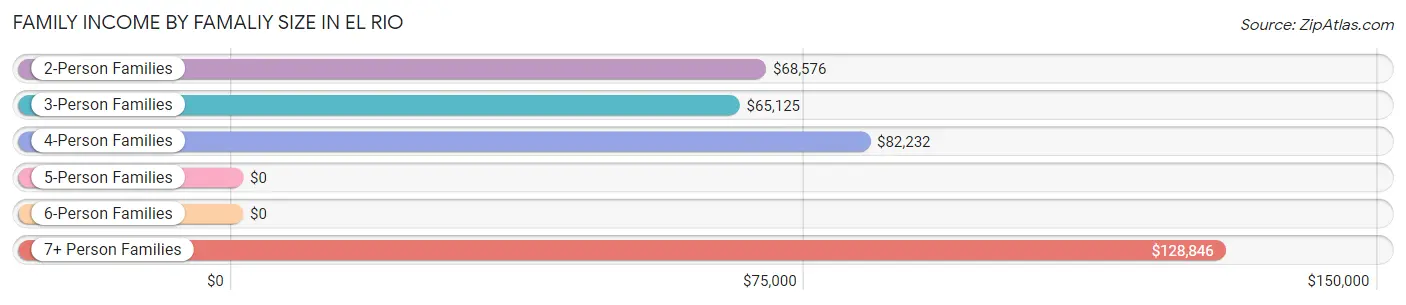
| Income Bracket | # Families | Median Income |
| 2-Person Families | 351 (25.0%) | $68,576 |
| 3-Person Families | 415 (29.6%) | $65,125 |
| 4-Person Families | 313 (22.3%) | $82,232 |
| 5-Person Families | 108 (7.7%) | $0 |
| 6-Person Families | 126 (9.0%) | $0 |
| 7+ Person Families | 90 (6.4%) | $128,846 |
| Total | 1,403 (100.0%) | $74,688 |
Family Income by Number of Earners in El Rio
The median family income in El Rio is $74,688, with families comprising 3+ earners (328) having the highest median family income of $140,500, while families with 1 earner (513) have the lowest median family income of $34,258, accounting for 23.4% and 36.6% of families, respectively.
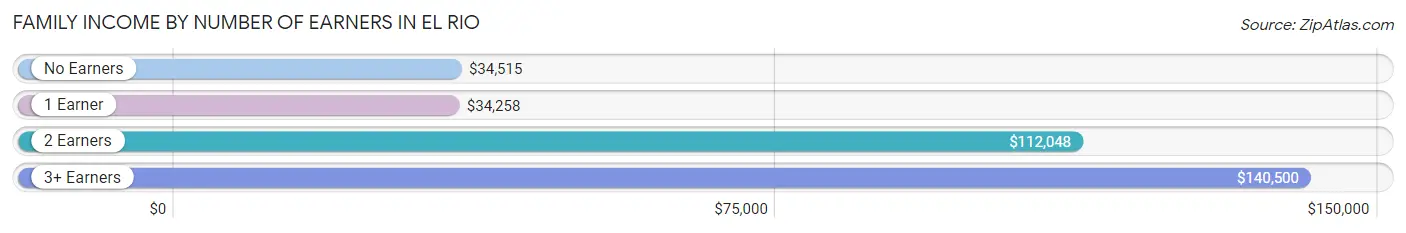
| Number of Earners | # Families | Median Income |
| No Earners | 121 (8.6%) | $34,515 |
| 1 Earner | 513 (36.6%) | $34,258 |
| 2 Earners | 441 (31.4%) | $112,048 |
| 3+ Earners | 328 (23.4%) | $140,500 |
| Total | 1,403 (100.0%) | $74,688 |
Household Income in El Rio
Household Income Brackets in El Rio
With 368 households falling in the category, the $50,000 to $74,999 income range is the most frequent in El Rio, accounting for 21.7% of all households. In contrast, only 7 households (0.4%) fall into the less than $10,000 income bracket, making it the least populous group.
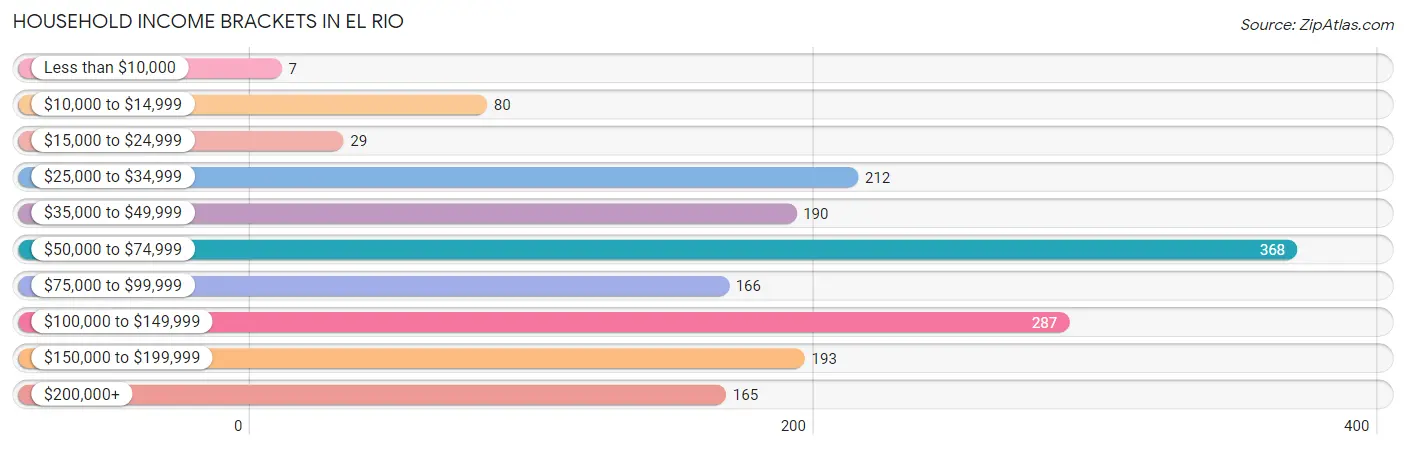
| Income Bracket | # Households | % Households |
| Less than $10,000 | 7 | 0.4% |
| $10,000 to $14,999 | 80 | 4.7% |
| $15,000 to $24,999 | 29 | 1.7% |
| $25,000 to $34,999 | 212 | 12.5% |
| $35,000 to $49,999 | 190 | 11.2% |
| $50,000 to $74,999 | 368 | 21.7% |
| $75,000 to $99,999 | 166 | 9.8% |
| $100,000 to $149,999 | 287 | 16.9% |
| $150,000 to $199,999 | 193 | 11.4% |
| $200,000+ | 165 | 9.7% |
Household Income by Householder Age in El Rio
The median household income in El Rio is $69,665, with the highest median household income of $95,032 found in the 45 to 64 years age bracket for the primary householder. A total of 767 households (45.2%) fall into this category.
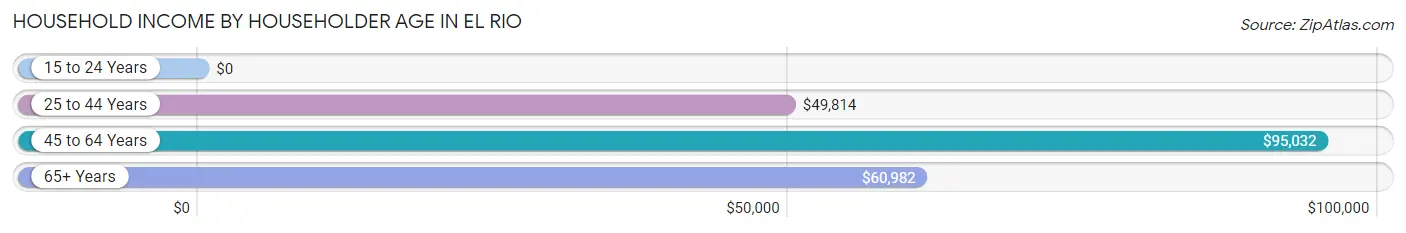
| Income Bracket | # Households | Median Income |
| 15 to 24 Years | 0 (0.0%) | $0 |
| 25 to 44 Years | 497 (29.3%) | $49,814 |
| 45 to 64 Years | 767 (45.2%) | $95,032 |
| 65+ Years | 433 (25.5%) | $60,982 |
| Total | 1,697 (100.0%) | $69,665 |
Poverty in El Rio
Income Below Poverty by Sex and Age in El Rio
With 12.5% poverty level for males and 22.8% for females among the residents of El Rio, 15 year old males and 5 year old females are the most vulnerable to poverty, with 85 males (74.6%) and 51 females (69.9%) in their respective age groups living below the poverty level.
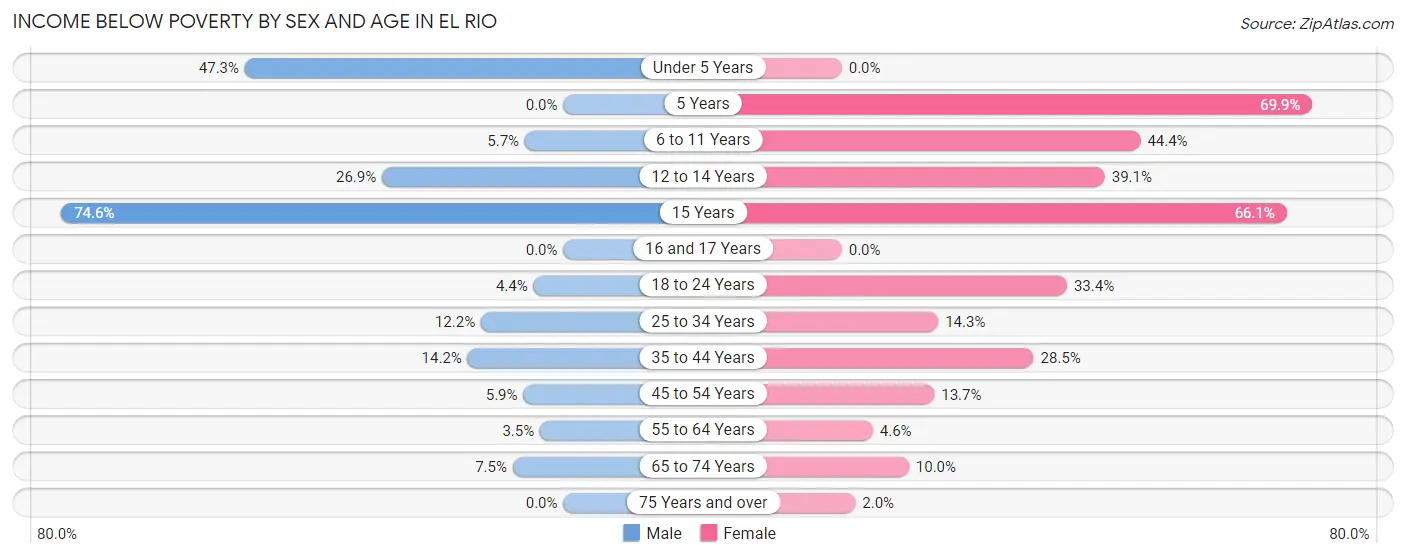
| Age Bracket | Male | Female |
| Under 5 Years | 61 (47.3%) | 0 (0.0%) |
| 5 Years | 0 (0.0%) | 51 (69.9%) |
| 6 to 11 Years | 13 (5.7%) | 165 (44.4%) |
| 12 to 14 Years | 35 (26.9%) | 100 (39.1%) |
| 15 Years | 85 (74.6%) | 72 (66.1%) |
| 16 and 17 Years | 0 (0.0%) | 0 (0.0%) |
| 18 to 24 Years | 8 (4.4%) | 102 (33.4%) |
| 25 to 34 Years | 74 (12.2%) | 58 (14.3%) |
| 35 to 44 Years | 54 (14.2%) | 96 (28.5%) |
| 45 to 54 Years | 29 (5.9%) | 56 (13.7%) |
| 55 to 64 Years | 16 (3.5%) | 21 (4.6%) |
| 65 to 74 Years | 18 (7.5%) | 23 (10.0%) |
| 75 Years and over | 0 (0.0%) | 3 (2.0%) |
| Total | 393 (12.5%) | 747 (22.8%) |
Income Above Poverty by Sex and Age in El Rio
According to the poverty statistics in El Rio, males aged 5 years and females aged under 5 years are the age groups that are most secure financially, with 100.0% of males and 100.0% of females in these age groups living above the poverty line.
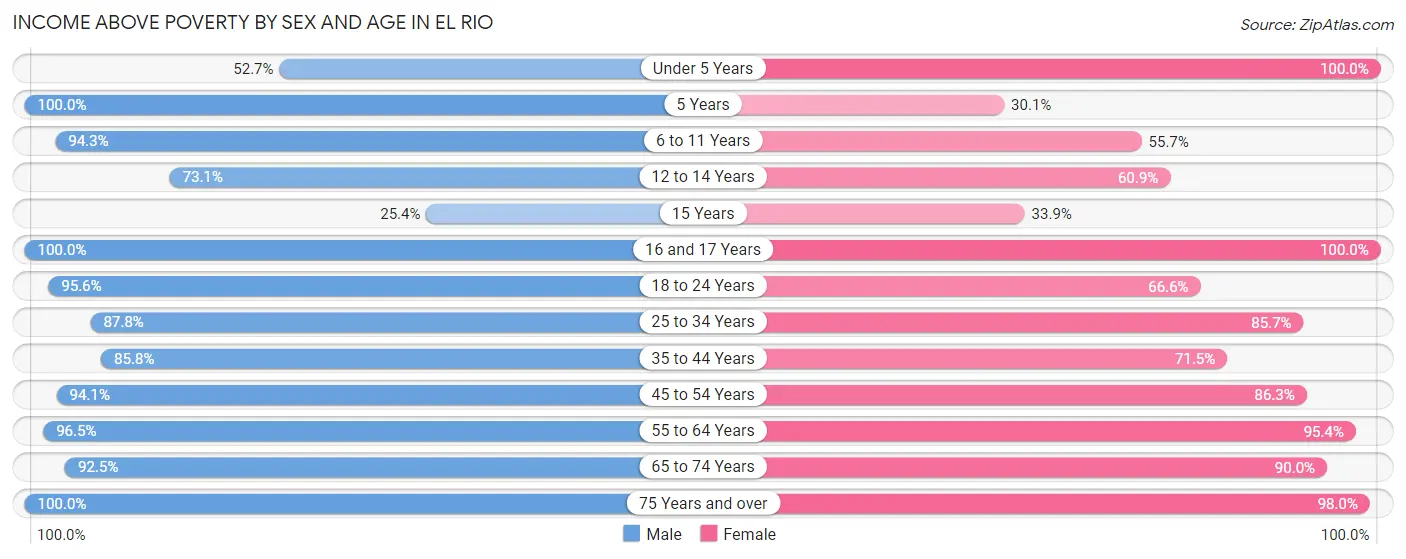
| Age Bracket | Male | Female |
| Under 5 Years | 68 (52.7%) | 128 (100.0%) |
| 5 Years | 25 (100.0%) | 22 (30.1%) |
| 6 to 11 Years | 215 (94.3%) | 207 (55.6%) |
| 12 to 14 Years | 95 (73.1%) | 156 (60.9%) |
| 15 Years | 29 (25.4%) | 37 (33.9%) |
| 16 and 17 Years | 64 (100.0%) | 46 (100.0%) |
| 18 to 24 Years | 173 (95.6%) | 203 (66.6%) |
| 25 to 34 Years | 531 (87.8%) | 347 (85.7%) |
| 35 to 44 Years | 326 (85.8%) | 241 (71.5%) |
| 45 to 54 Years | 459 (94.1%) | 352 (86.3%) |
| 55 to 64 Years | 447 (96.5%) | 435 (95.4%) |
| 65 to 74 Years | 222 (92.5%) | 208 (90.0%) |
| 75 Years and over | 93 (100.0%) | 146 (98.0%) |
| Total | 2,747 (87.5%) | 2,528 (77.2%) |
Income Below Poverty Among Married-Couple Families in El Rio
The poverty statistics for married-couple families in El Rio show that 10.9% or 111 of the total 1,017 families live below the poverty line. Families with 3 or 4 children have the highest poverty rate of 51.9%, comprising of 67 families. On the other hand, families with no children have the lowest poverty rate of 0.0%, which includes 0 families.
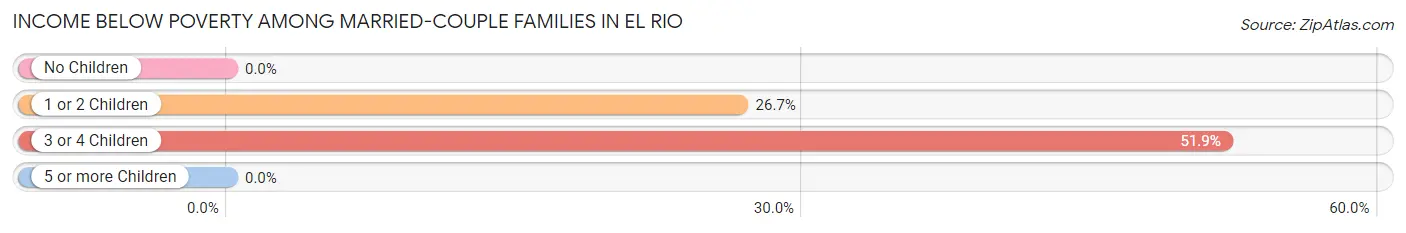
| Children | Above Poverty | Below Poverty |
| No Children | 675 (100.0%) | 0 (0.0%) |
| 1 or 2 Children | 121 (73.3%) | 44 (26.7%) |
| 3 or 4 Children | 62 (48.1%) | 67 (51.9%) |
| 5 or more Children | 48 (100.0%) | 0 (0.0%) |
| Total | 906 (89.1%) | 111 (10.9%) |
Income Below Poverty Among Single-Parent Households in El Rio
According to the poverty data in El Rio, 16.3% or 16 single-father households and 34.7% or 100 single-mother households are living below the poverty line. Among single-father households, those with no children have the highest poverty rate, with 16 households (28.6%) experiencing poverty. Likewise, among single-mother households, those with 3 or 4 children have the highest poverty rate, with 70 households (94.6%) falling below the poverty line.
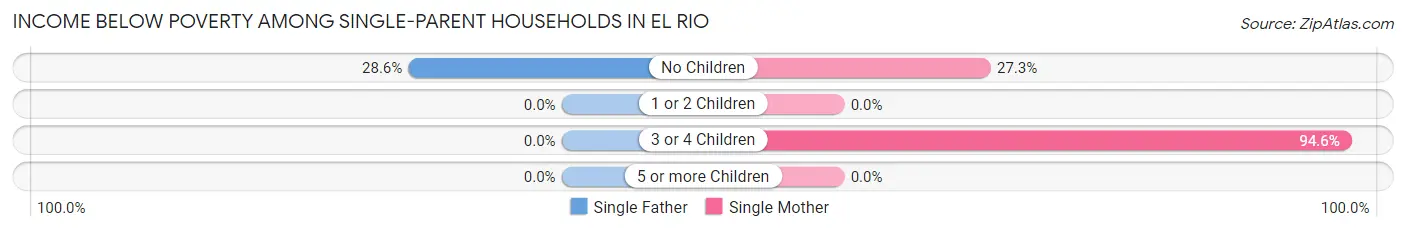
| Children | Single Father | Single Mother |
| No Children | 16 (28.6%) | 30 (27.3%) |
| 1 or 2 Children | 0 (0.0%) | 0 (0.0%) |
| 3 or 4 Children | 0 (0.0%) | 70 (94.6%) |
| 5 or more Children | 0 (0.0%) | 0 (0.0%) |
| Total | 16 (16.3%) | 100 (34.7%) |
Income Below Poverty Among Married-Couple vs Single-Parent Households in El Rio
The poverty data for El Rio shows that 111 of the married-couple family households (10.9%) and 116 of the single-parent households (30.0%) are living below the poverty level. Within the married-couple family households, those with 3 or 4 children have the highest poverty rate, with 67 households (51.9%) falling below the poverty line. Among the single-parent households, those with 3 or 4 children have the highest poverty rate, with 70 household (94.6%) living below poverty.
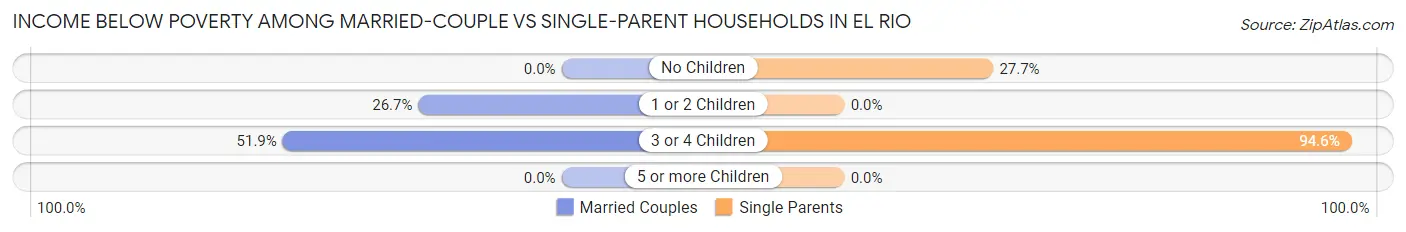
| Children | Married-Couple Families | Single-Parent Households |
| No Children | 0 (0.0%) | 46 (27.7%) |
| 1 or 2 Children | 44 (26.7%) | 0 (0.0%) |
| 3 or 4 Children | 67 (51.9%) | 70 (94.6%) |
| 5 or more Children | 0 (0.0%) | 0 (0.0%) |
| Total | 111 (10.9%) | 116 (30.0%) |
Race in El Rio
The most populous races in El Rio are Hispanic or Latino (5,456 | 85.0%), White / Caucasian (3,824 | 59.6%), and Two or more Races (1,352 | 21.1%).
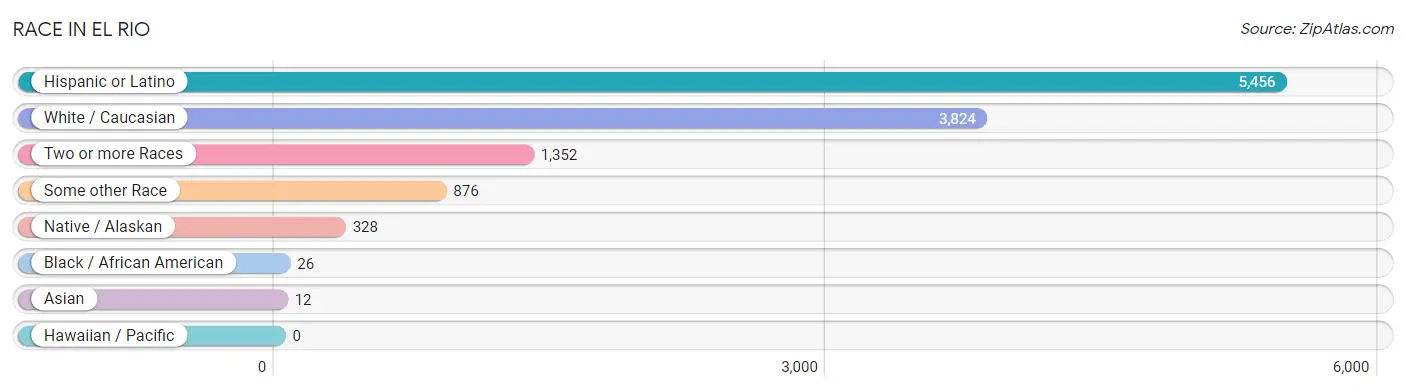
| Race | # Population | % Population |
| Asian | 12 | 0.2% |
| Black / African American | 26 | 0.4% |
| Hawaiian / Pacific | 0 | 0.0% |
| Hispanic or Latino | 5,456 | 85.0% |
| Native / Alaskan | 328 | 5.1% |
| White / Caucasian | 3,824 | 59.6% |
| Two or more Races | 1,352 | 21.1% |
| Some other Race | 876 | 13.7% |
| Total | 6,418 | 100.0% |
Ancestry in El Rio
The most populous ancestries reported in El Rio are Mexican (5,425 | 84.5%), American (616 | 9.6%), Mexican American Indian (337 | 5.2%), European (173 | 2.7%), and Irish (134 | 2.1%), together accounting for 104.2% of all El Rio residents.
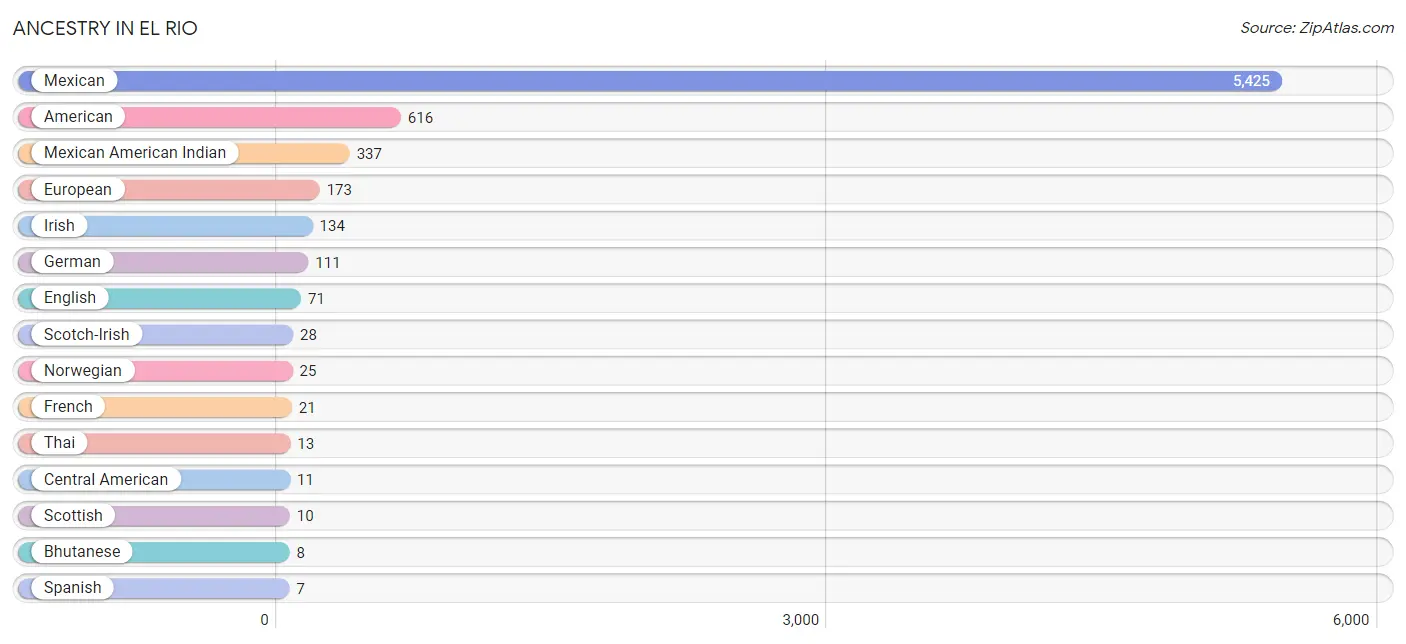
| Ancestry | # Population | % Population |
| American | 616 | 9.6% |
| Bhutanese | 8 | 0.1% |
| Central American | 11 | 0.2% |
| English | 71 | 1.1% |
| European | 173 | 2.7% |
| French | 21 | 0.3% |
| German | 111 | 1.7% |
| Guatemalan | 5 | 0.1% |
| Honduran | 6 | 0.1% |
| Irish | 134 | 2.1% |
| Italian | 6 | 0.1% |
| Korean | 5 | 0.1% |
| Mexican | 5,425 | 84.5% |
| Mexican American Indian | 337 | 5.2% |
| Norwegian | 25 | 0.4% |
| Scotch-Irish | 28 | 0.4% |
| Scottish | 10 | 0.2% |
| Spanish | 7 | 0.1% |
| Thai | 13 | 0.2% | View All 19 Rows |
Immigrants in El Rio
The most numerous immigrant groups reported in El Rio came from Latin America (1,746 | 27.2%), Central America (1,711 | 26.7%), Mexico (1,706 | 26.6%), Caribbean (35 | 0.5%), and Jamaica (35 | 0.5%), together accounting for 81.5% of all El Rio residents.
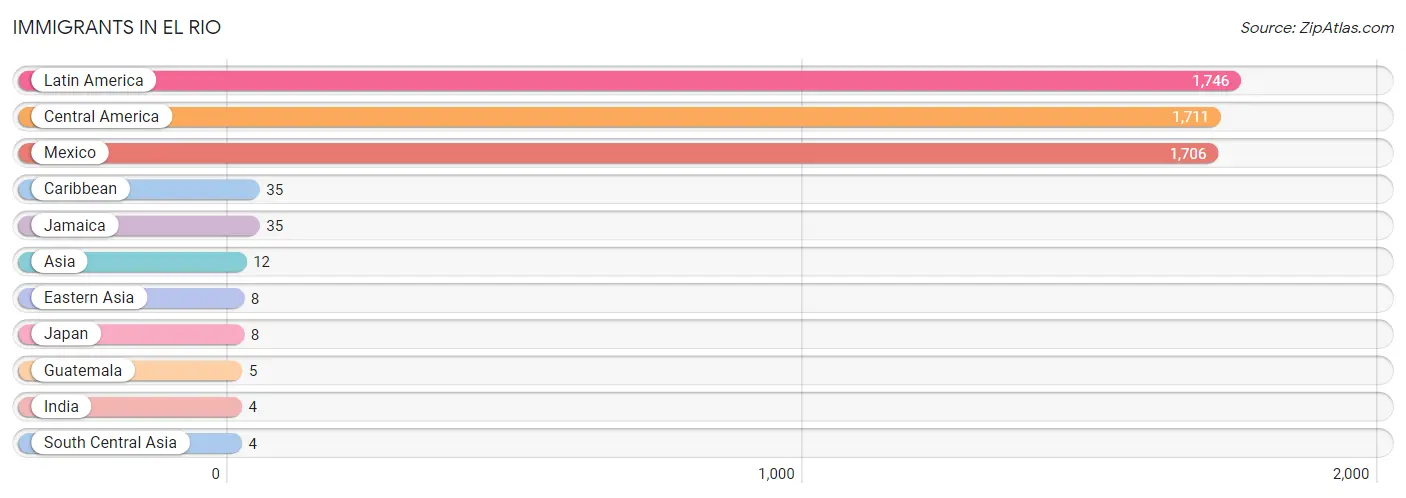
| Immigration Origin | # Population | % Population |
| Asia | 12 | 0.2% |
| Caribbean | 35 | 0.5% |
| Central America | 1,711 | 26.7% |
| Eastern Asia | 8 | 0.1% |
| Guatemala | 5 | 0.1% |
| India | 4 | 0.1% |
| Jamaica | 35 | 0.5% |
| Japan | 8 | 0.1% |
| Latin America | 1,746 | 27.2% |
| Mexico | 1,706 | 26.6% |
| South Central Asia | 4 | 0.1% | View All 11 Rows |
Sex and Age in El Rio
Sex and Age in El Rio
The most populous age groups in El Rio are 30 to 34 Years (343 | 10.9%) for men and 10 to 14 Years (399 | 12.2%) for women.
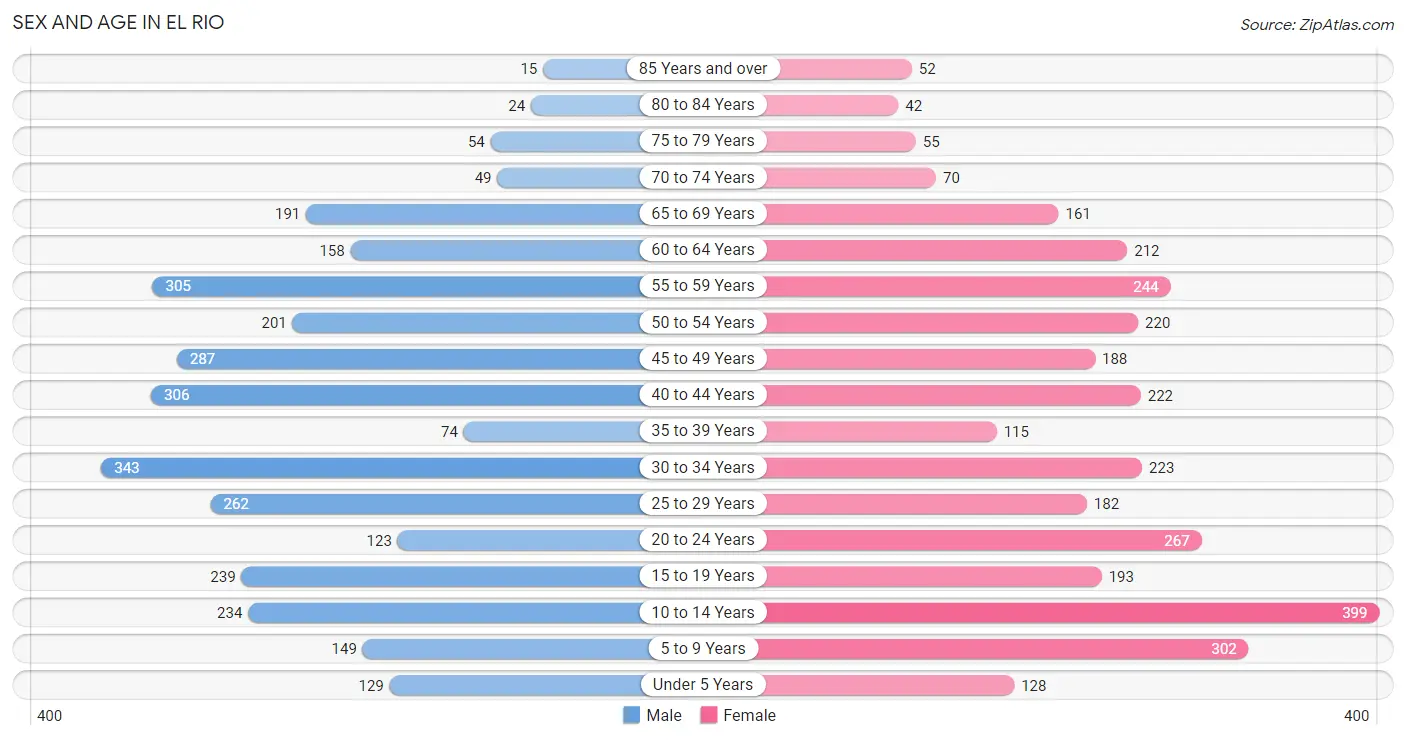
| Age Bracket | Male | Female |
| Under 5 Years | 129 (4.1%) | 128 (3.9%) |
| 5 to 9 Years | 149 (4.7%) | 302 (9.2%) |
| 10 to 14 Years | 234 (7.4%) | 399 (12.2%) |
| 15 to 19 Years | 239 (7.6%) | 193 (5.9%) |
| 20 to 24 Years | 123 (3.9%) | 267 (8.2%) |
| 25 to 29 Years | 262 (8.3%) | 182 (5.6%) |
| 30 to 34 Years | 343 (10.9%) | 223 (6.8%) |
| 35 to 39 Years | 74 (2.4%) | 115 (3.5%) |
| 40 to 44 Years | 306 (9.7%) | 222 (6.8%) |
| 45 to 49 Years | 287 (9.1%) | 188 (5.7%) |
| 50 to 54 Years | 201 (6.4%) | 220 (6.7%) |
| 55 to 59 Years | 305 (9.7%) | 244 (7.4%) |
| 60 to 64 Years | 158 (5.0%) | 212 (6.5%) |
| 65 to 69 Years | 191 (6.1%) | 161 (4.9%) |
| 70 to 74 Years | 49 (1.6%) | 70 (2.1%) |
| 75 to 79 Years | 54 (1.7%) | 55 (1.7%) |
| 80 to 84 Years | 24 (0.8%) | 42 (1.3%) |
| 85 Years and over | 15 (0.5%) | 52 (1.6%) |
| Total | 3,143 (100.0%) | 3,275 (100.0%) |
Families and Households in El Rio
Median Family Size in El Rio
The median family size in El Rio is 4.15 persons per family, with single female/mother families (288 | 20.5%) accounting for the largest median family size of 4.19 persons per family. On the other hand, single male/father families (98 | 7.0%) represent the smallest median family size with 3.94 persons per family.
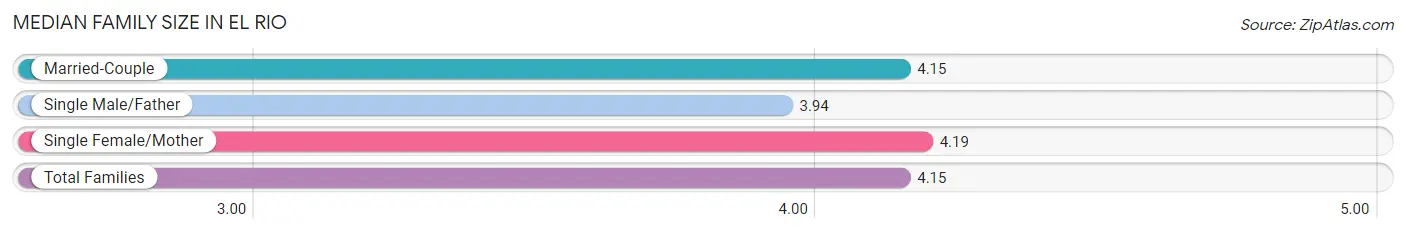
| Family Type | # Families | Family Size |
| Married-Couple | 1,017 (72.5%) | 4.15 |
| Single Male/Father | 98 (7.0%) | 3.94 |
| Single Female/Mother | 288 (20.5%) | 4.19 |
| Total Families | 1,403 (100.0%) | 4.15 |
Median Household Size in El Rio
The median household size in El Rio is 3.77 persons per household, with single male/father households (98 | 5.8%) accounting for the largest median household size of 4.57 persons per household. non-family households (294 | 17.3%) represent the smallest median household size with 1.10 persons per household.
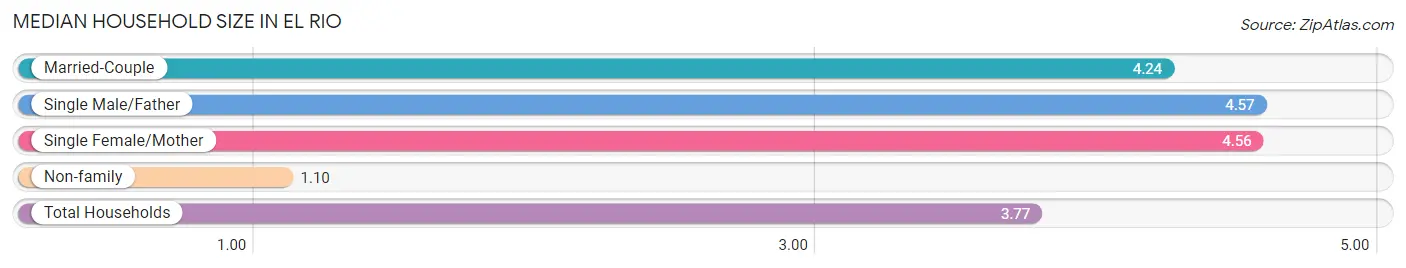
| Household Type | # Households | Household Size |
| Married-Couple | 1,017 (59.9%) | 4.24 |
| Single Male/Father | 98 (5.8%) | 4.57 |
| Single Female/Mother | 288 (17.0%) | 4.56 |
| Non-family | 294 (17.3%) | 1.10 |
| Total Households | 1,697 (100.0%) | 3.77 |
Household Size by Marriage Status in El Rio
Out of a total of 1,697 households in El Rio, 1,403 (82.7%) are family households, while 294 (17.3%) are nonfamily households. The most numerous type of family households are 4-person households, comprising 379, and the most common type of nonfamily households are 1-person households, comprising 264.
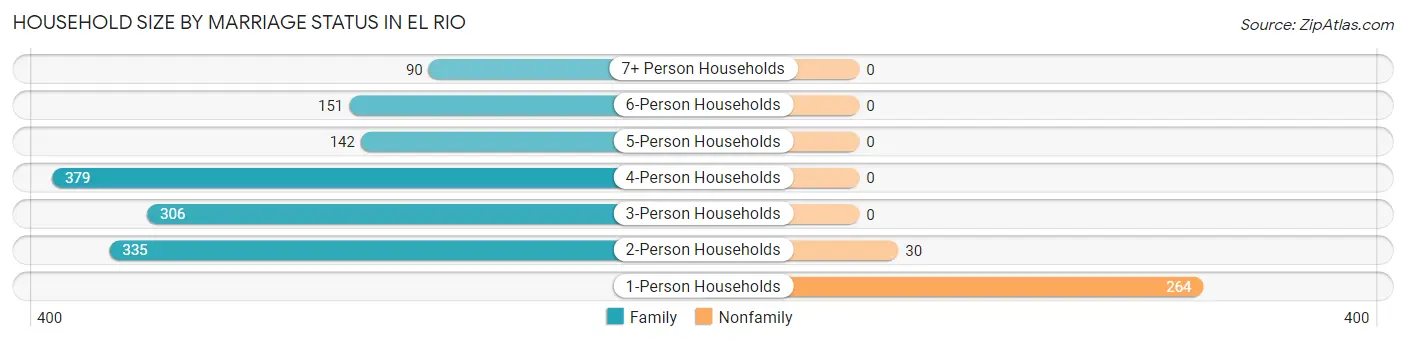
| Household Size | Family Households | Nonfamily Households |
| 1-Person Households | - | 264 (15.6%) |
| 2-Person Households | 335 (19.7%) | 30 (1.8%) |
| 3-Person Households | 306 (18.0%) | 0 (0.0%) |
| 4-Person Households | 379 (22.3%) | 0 (0.0%) |
| 5-Person Households | 142 (8.4%) | 0 (0.0%) |
| 6-Person Households | 151 (8.9%) | 0 (0.0%) |
| 7+ Person Households | 90 (5.3%) | 0 (0.0%) |
| Total | 1,403 (82.7%) | 294 (17.3%) |
Female Fertility in El Rio
Fertility by Age in El Rio
Average fertility rate in El Rio is 53.0 births per 1,000 women. Women in the age bracket of 20 to 34 years have the highest fertility rate with 97.0 births per 1,000 women. Women in the age bracket of 20 to 34 years acount for 87.8% of all women with births.
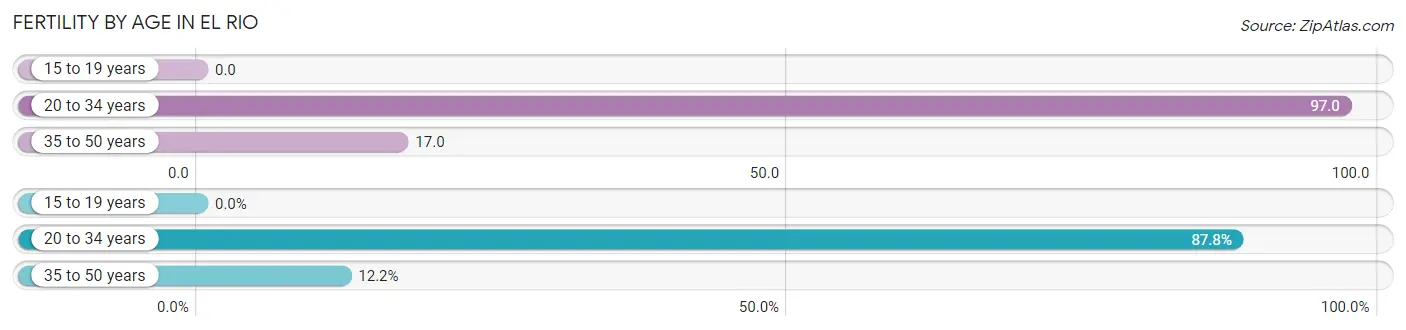
| Age Bracket | Women with Births | Births / 1,000 Women |
| 15 to 19 years | 0 (0.0%) | 0.0 |
| 20 to 34 years | 65 (87.8%) | 97.0 |
| 35 to 50 years | 9 (12.2%) | 17.0 |
| Total | 74 (100.0%) | 53.0 |
Fertility by Age by Marriage Status in El Rio
89.2% of women with births (74) in El Rio are married. The highest percentage of unmarried women with births falls into 20 to 34 years age bracket with 12.3% of them unmarried at the time of birth, while the lowest percentage of unmarried women with births belong to 35 to 50 years age bracket with 0.0% of them unmarried.
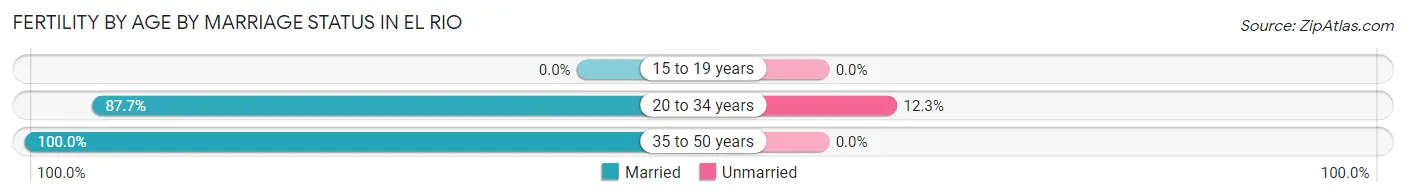
| Age Bracket | Married | Unmarried |
| 15 to 19 years | 0 (0.0%) | 0 (0.0%) |
| 20 to 34 years | 57 (87.7%) | 8 (12.3%) |
| 35 to 50 years | 9 (100.0%) | 0 (0.0%) |
| Total | 66 (89.2%) | 8 (10.8%) |
Fertility by Education in El Rio
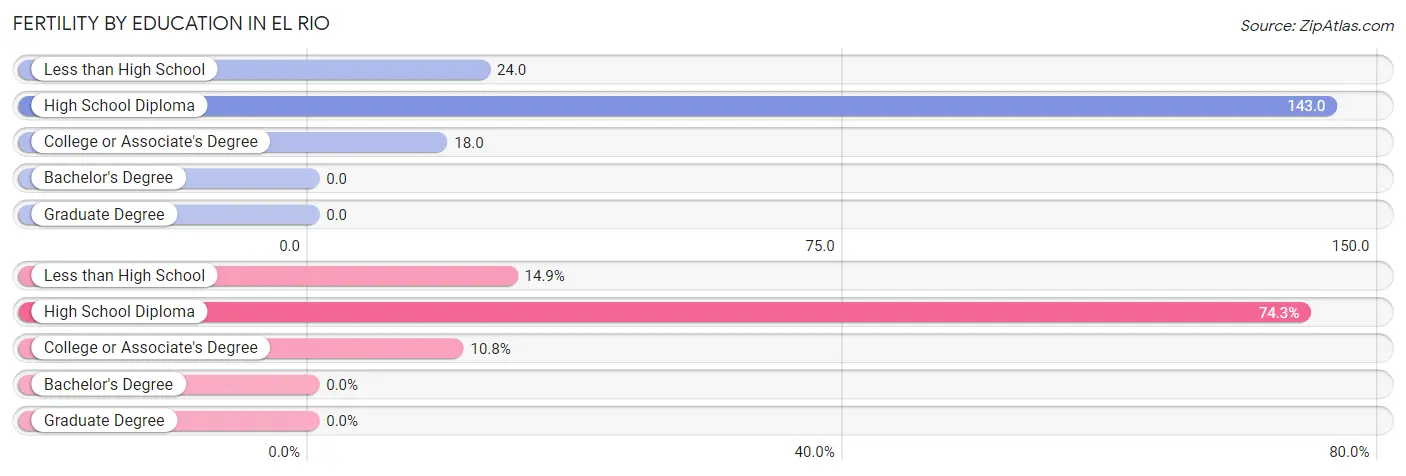
| Educational Attainment | Women with Births | Births / 1,000 Women |
| Less than High School | 11 (14.9%) | 24.0 |
| High School Diploma | 55 (74.3%) | 143.0 |
| College or Associate's Degree | 8 (10.8%) | 18.0 |
| Bachelor's Degree | 0 (0.0%) | 0.0 |
| Graduate Degree | 0 (0.0%) | 0.0 |
| Total | 74 (100.0%) | 53.0 |
Fertility by Education by Marriage Status in El Rio
10.8% of women with births in El Rio are unmarried. Women with the educational attainment of less than high school are most likely to be married with 100.0% of them married at childbirth, while women with the educational attainment of college or associate's degree are least likely to be married with 100.0% of them unmarried at childbirth.
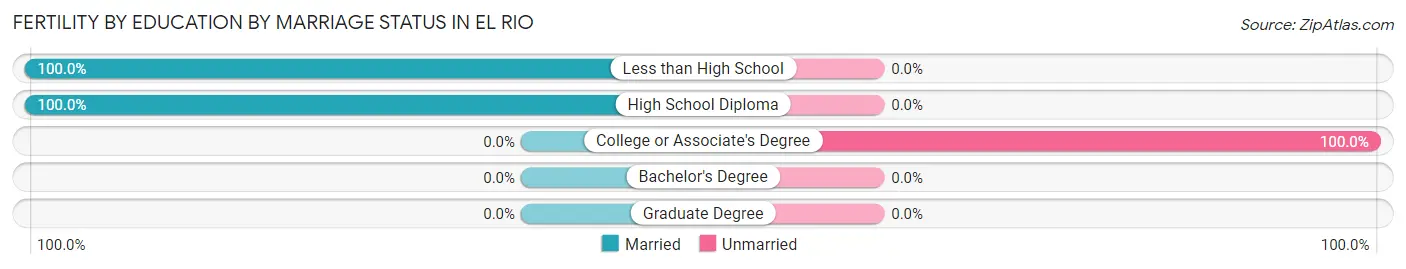
| Educational Attainment | Married | Unmarried |
| Less than High School | 11 (100.0%) | 0 (0.0%) |
| High School Diploma | 55 (100.0%) | 0 (0.0%) |
| College or Associate's Degree | 0 (0.0%) | 8 (100.0%) |
| Bachelor's Degree | 0 (0.0%) | 0 (0.0%) |
| Graduate Degree | 0 (0.0%) | 0 (0.0%) |
| Total | 66 (89.2%) | 8 (10.8%) |
Employment Characteristics in El Rio
Employment by Class of Employer in El Rio
Among the 2,760 employed individuals in El Rio, private company employees (1,975 | 71.6%), self-employed (not incorporated) (256 | 9.3%), and local government employees (197 | 7.1%) make up the most common classes of employment.
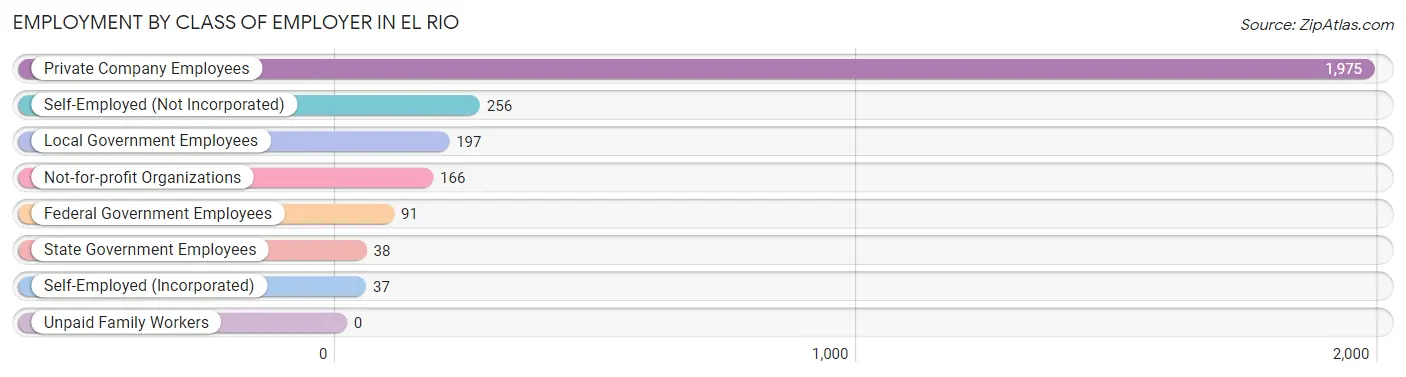
| Employer Class | # Employees | % Employees |
| Private Company Employees | 1,975 | 71.6% |
| Self-Employed (Incorporated) | 37 | 1.3% |
| Self-Employed (Not Incorporated) | 256 | 9.3% |
| Not-for-profit Organizations | 166 | 6.0% |
| Local Government Employees | 197 | 7.1% |
| State Government Employees | 38 | 1.4% |
| Federal Government Employees | 91 | 3.3% |
| Unpaid Family Workers | 0 | 0.0% |
| Total | 2,760 | 100.0% |
Employment Status by Age in El Rio
According to the labor force statistics for El Rio, out of the total population over 16 years of age (4,854), 66.7% or 3,238 individuals are in the labor force, with 12.7% or 411 of them unemployed. The age group with the highest labor force participation rate is 30 to 34 years, with 88.5% or 501 individuals in the labor force. Within the labor force, the 25 to 29 years age range has the highest percentage of unemployed individuals, with 28.6% or 110 of them being unemployed.
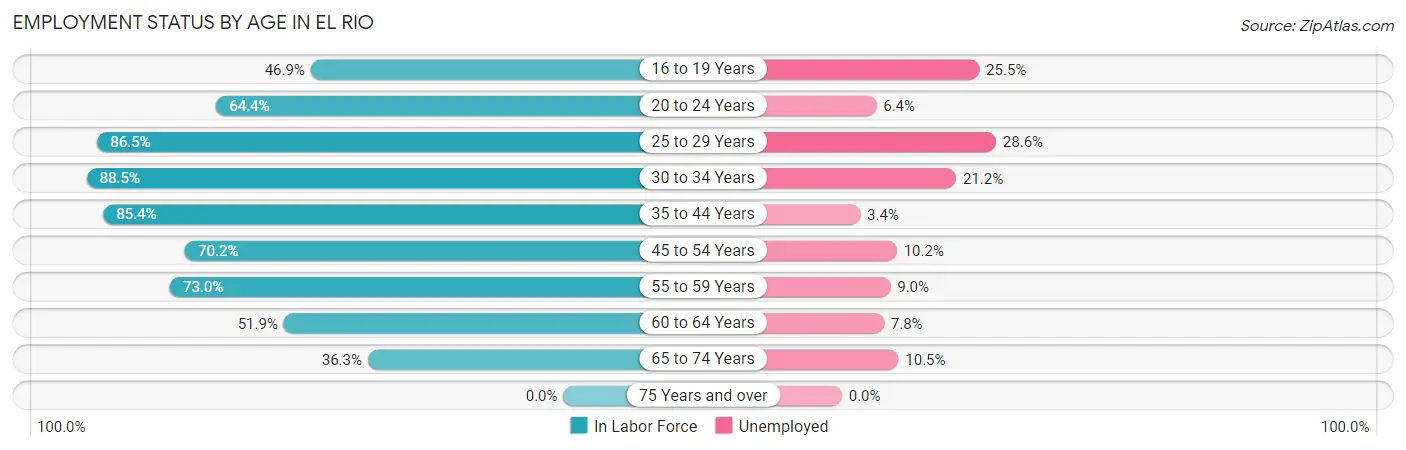
| Age Bracket | In Labor Force | Unemployed |
| 16 to 19 Years | 98 (46.9%) | 25 (25.5%) |
| 20 to 24 Years | 251 (64.4%) | 16 (6.4%) |
| 25 to 29 Years | 384 (86.5%) | 110 (28.6%) |
| 30 to 34 Years | 501 (88.5%) | 106 (21.2%) |
| 35 to 44 Years | 612 (85.4%) | 21 (3.4%) |
| 45 to 54 Years | 629 (70.2%) | 64 (10.2%) |
| 55 to 59 Years | 401 (73.0%) | 36 (9.0%) |
| 60 to 64 Years | 192 (51.9%) | 15 (7.8%) |
| 65 to 74 Years | 171 (36.3%) | 18 (10.5%) |
| 75 Years and over | 0 (0.0%) | 0 (0.0%) |
| Total | 3,238 (66.7%) | 411 (12.7%) |
Employment Status by Educational Attainment in El Rio
According to labor force statistics for El Rio, 76.8% of individuals (2,720) out of the total population between 25 and 64 years of age (3,542) are in the labor force, with 12.9% or 351 of them being unemployed. The group with the highest labor force participation rate are those with the educational attainment of bachelor's degree or higher, with 93.7% or 281 individuals in the labor force. Within the labor force, individuals with less than high school education have the highest percentage of unemployment, with 21.7% or 163 of them being unemployed.
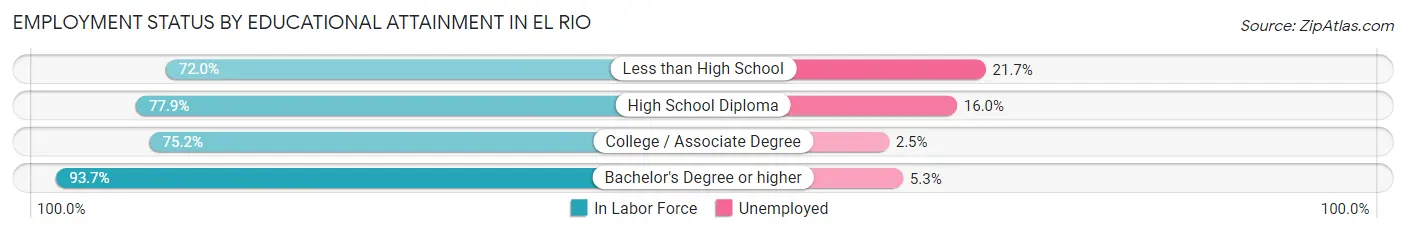
| Educational Attainment | In Labor Force | Unemployed |
| Less than High School | 750 (72.0%) | 226 (21.7%) |
| High School Diploma | 970 (77.9%) | 199 (16.0%) |
| College / Associate Degree | 718 (75.2%) | 24 (2.5%) |
| Bachelor's Degree or higher | 281 (93.7%) | 16 (5.3%) |
| Total | 2,720 (76.8%) | 457 (12.9%) |
Employment Occupations by Sex in El Rio
Management, Business, Science and Arts Occupations
The most common Management, Business, Science and Arts occupations in El Rio are Community & Social Service (190 | 6.7%), Management (148 | 5.2%), Education Instruction & Library (145 | 5.1%), Health Diagnosing & Treating (89 | 3.2%), and Computers, Engineering & Science (82 | 2.9%).
Management, Business, Science and Arts Occupations by Sex
Within the Management, Business, Science and Arts occupations in El Rio, the most male-oriented occupations are Architecture & Engineering (100.0%), Management (85.1%), and Business & Financial (68.8%), while the most female-oriented occupations are Health Technologists (100.0%), Health Diagnosing & Treating (95.5%), and Computers & Mathematics (76.0%).
| Occupation | Male | Female |
| Management | 126 (85.1%) | 22 (14.9%) |
| Business & Financial | 55 (68.8%) | 25 (31.2%) |
| Computers, Engineering & Science | 51 (62.2%) | 31 (37.8%) |
| Computers & Mathematics | 6 (24.0%) | 19 (76.0%) |
| Architecture & Engineering | 24 (100.0%) | 0 (0.0%) |
| Life, Physical & Social Science | 21 (63.6%) | 12 (36.4%) |
| Community & Social Service | 51 (26.8%) | 139 (73.2%) |
| Education, Arts & Media | 13 (28.9%) | 32 (71.1%) |
| Legal Services & Support | 0 (0.0%) | 0 (0.0%) |
| Education Instruction & Library | 38 (26.2%) | 107 (73.8%) |
| Arts, Media & Entertainment | 0 (0.0%) | 0 (0.0%) |
| Health Diagnosing & Treating | 4 (4.5%) | 85 (95.5%) |
| Health Technologists | 0 (0.0%) | 43 (100.0%) |
| Total (Category) | 287 (48.7%) | 302 (51.3%) |
| Total (Overall) | 1,536 (54.4%) | 1,287 (45.6%) |
Services Occupations
The most common Services occupations in El Rio are Healthcare Support (191 | 6.8%), Food Preparation & Serving (101 | 3.6%), Cleaning & Maintenance (86 | 3.0%), Personal Care & Service (63 | 2.2%), and Security & Protection (39 | 1.4%).
Services Occupations by Sex
Within the Services occupations in El Rio, the most male-oriented occupations are Security & Protection (100.0%), Firefighting & Prevention (100.0%), and Law Enforcement (100.0%), while the most female-oriented occupations are Healthcare Support (100.0%), Food Preparation & Serving (59.4%), and Personal Care & Service (49.2%).
| Occupation | Male | Female |
| Healthcare Support | 0 (0.0%) | 191 (100.0%) |
| Security & Protection | 39 (100.0%) | 0 (0.0%) |
| Firefighting & Prevention | 23 (100.0%) | 0 (0.0%) |
| Law Enforcement | 16 (100.0%) | 0 (0.0%) |
| Food Preparation & Serving | 41 (40.6%) | 60 (59.4%) |
| Cleaning & Maintenance | 55 (63.9%) | 31 (36.0%) |
| Personal Care & Service | 32 (50.8%) | 31 (49.2%) |
| Total (Category) | 167 (34.8%) | 313 (65.2%) |
| Total (Overall) | 1,536 (54.4%) | 1,287 (45.6%) |
Sales and Office Occupations
The most common Sales and Office occupations in El Rio are Office & Administration (322 | 11.4%), and Sales & Related (309 | 11.0%).

Sales and Office Occupations by Sex

| Occupation | Male | Female |
| Sales & Related | 118 (38.2%) | 191 (61.8%) |
| Office & Administration | 77 (23.9%) | 245 (76.1%) |
| Total (Category) | 195 (30.9%) | 436 (69.1%) |
| Total (Overall) | 1,536 (54.4%) | 1,287 (45.6%) |
Natural Resources, Construction and Maintenance Occupations
The most common Natural Resources, Construction and Maintenance occupations in El Rio are Installation, Maintenance & Repair (334 | 11.8%), Construction & Extraction (190 | 6.7%), and Farming, Fishing & Forestry (143 | 5.1%).

Natural Resources, Construction and Maintenance Occupations by Sex

| Occupation | Male | Female |
| Farming, Fishing & Forestry | 106 (74.1%) | 37 (25.9%) |
| Construction & Extraction | 190 (100.0%) | 0 (0.0%) |
| Installation, Maintenance & Repair | 334 (100.0%) | 0 (0.0%) |
| Total (Category) | 630 (94.5%) | 37 (5.6%) |
| Total (Overall) | 1,536 (54.4%) | 1,287 (45.6%) |
Production, Transportation and Moving Occupations
The most common Production, Transportation and Moving occupations in El Rio are Production (200 | 7.1%), Material Moving (147 | 5.2%), and Transportation (109 | 3.9%).
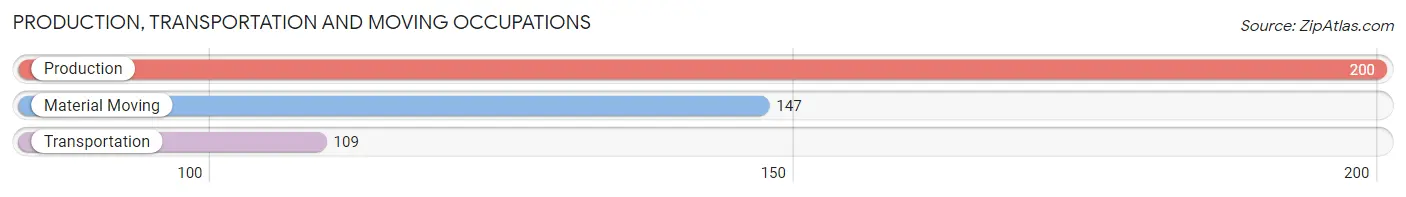
Production, Transportation and Moving Occupations by Sex

| Occupation | Male | Female |
| Production | 66 (33.0%) | 134 (67.0%) |
| Transportation | 66 (60.6%) | 43 (39.5%) |
| Material Moving | 125 (85.0%) | 22 (15.0%) |
| Total (Category) | 257 (56.4%) | 199 (43.6%) |
| Total (Overall) | 1,536 (54.4%) | 1,287 (45.6%) |
Employment Industries by Sex in El Rio
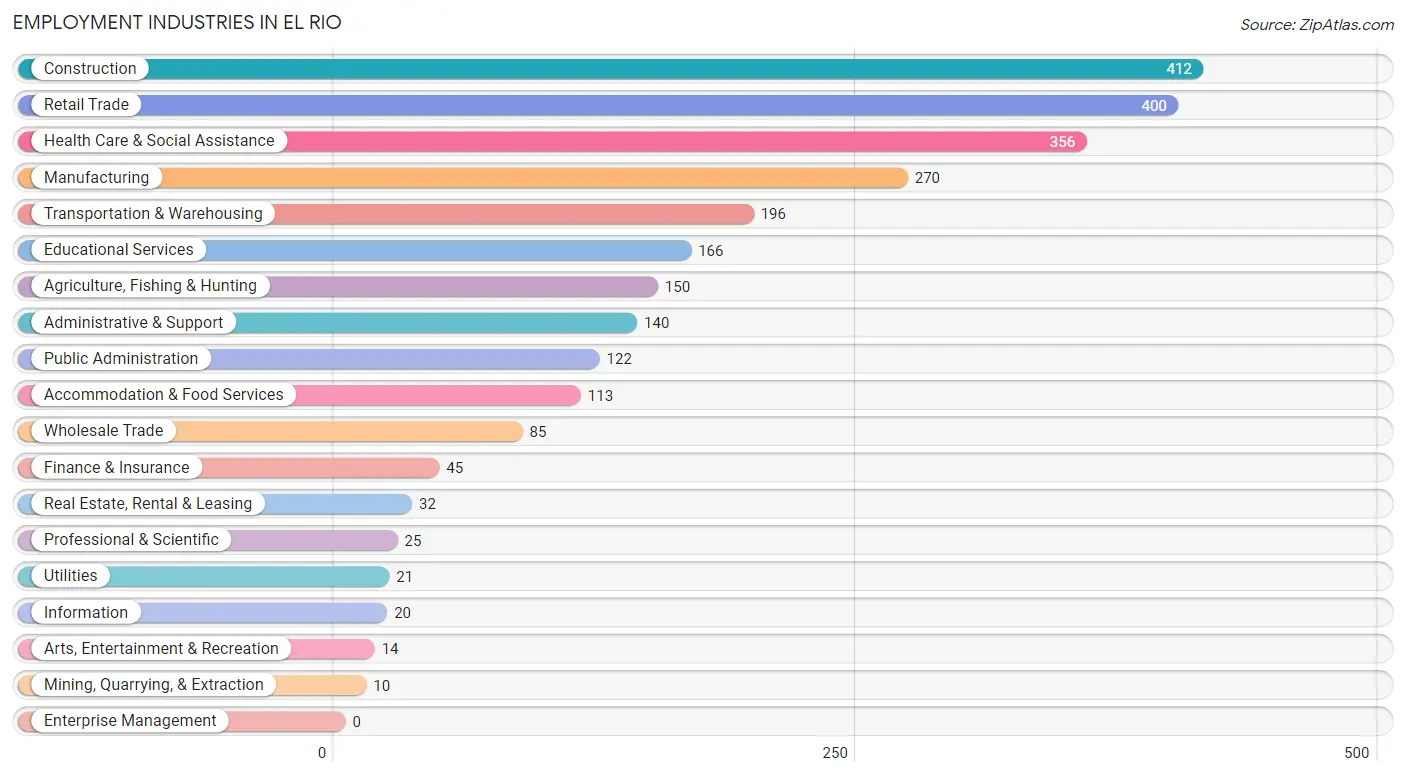
Employment Industries in El Rio
The major employment industries in El Rio include Construction (412 | 14.6%), Retail Trade (400 | 14.2%), Health Care & Social Assistance (356 | 12.6%), Manufacturing (270 | 9.6%), and Transportation & Warehousing (196 | 6.9%).
Employment Industries by Sex in El Rio
The El Rio industries that see more men than women are Mining, Quarrying, & Extraction (100.0%), Utilities (100.0%), and Arts, Entertainment & Recreation (100.0%), whereas the industries that tend to have a higher number of women are Health Care & Social Assistance (94.7%), Educational Services (73.5%), and Wholesale Trade (65.9%).
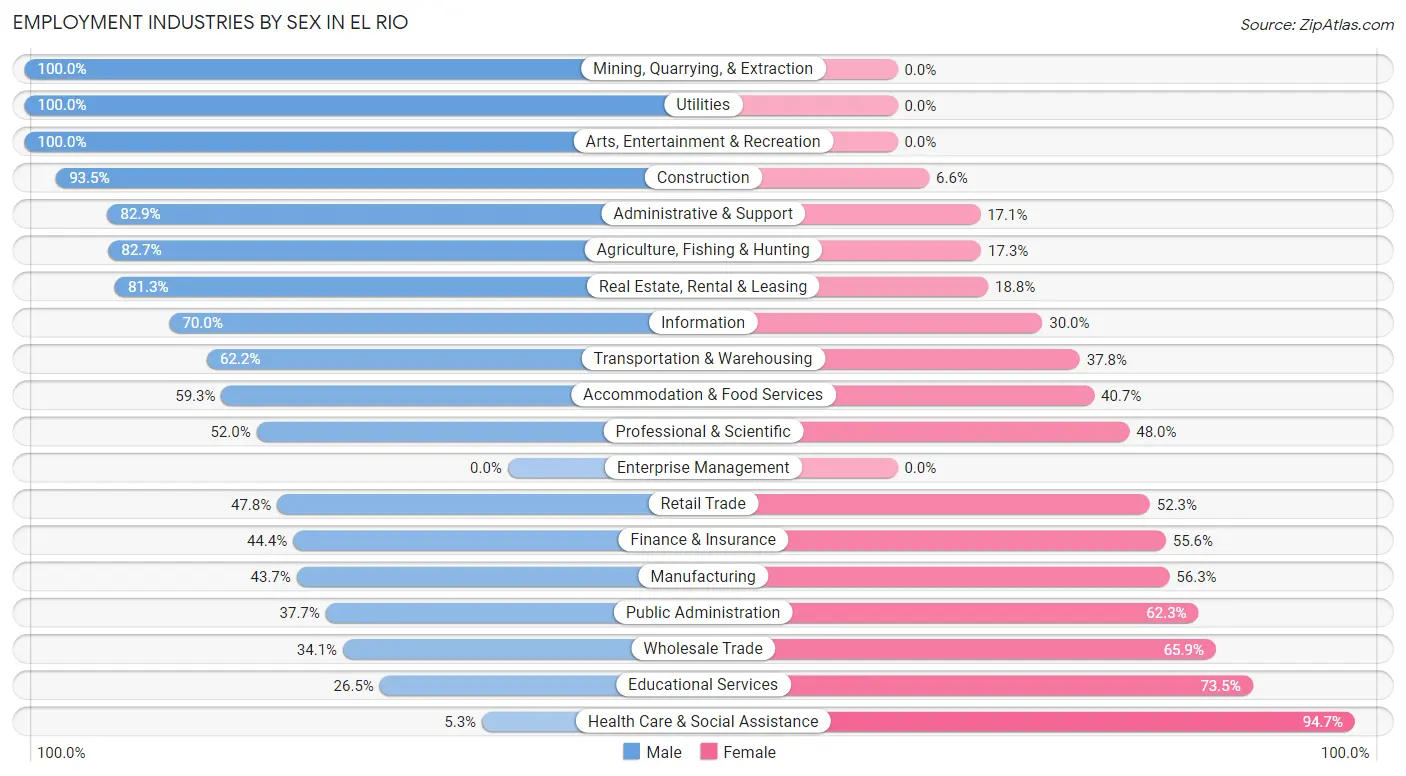
| Industry | Male | Female |
| Agriculture, Fishing & Hunting | 124 (82.7%) | 26 (17.3%) |
| Mining, Quarrying, & Extraction | 10 (100.0%) | 0 (0.0%) |
| Construction | 385 (93.4%) | 27 (6.6%) |
| Manufacturing | 118 (43.7%) | 152 (56.3%) |
| Wholesale Trade | 29 (34.1%) | 56 (65.9%) |
| Retail Trade | 191 (47.7%) | 209 (52.2%) |
| Transportation & Warehousing | 122 (62.2%) | 74 (37.8%) |
| Utilities | 21 (100.0%) | 0 (0.0%) |
| Information | 14 (70.0%) | 6 (30.0%) |
| Finance & Insurance | 20 (44.4%) | 25 (55.6%) |
| Real Estate, Rental & Leasing | 26 (81.2%) | 6 (18.8%) |
| Professional & Scientific | 13 (52.0%) | 12 (48.0%) |
| Enterprise Management | 0 (0.0%) | 0 (0.0%) |
| Administrative & Support | 116 (82.9%) | 24 (17.1%) |
| Educational Services | 44 (26.5%) | 122 (73.5%) |
| Health Care & Social Assistance | 19 (5.3%) | 337 (94.7%) |
| Arts, Entertainment & Recreation | 14 (100.0%) | 0 (0.0%) |
| Accommodation & Food Services | 67 (59.3%) | 46 (40.7%) |
| Public Administration | 46 (37.7%) | 76 (62.3%) |
| Total | 1,536 (54.4%) | 1,287 (45.6%) |
Education in El Rio
School Enrollment in El Rio
The most common levels of schooling among the 1,813 students in El Rio are high school (536 | 29.6%), middle school (448 | 24.7%), and elementary school (427 | 23.5%).
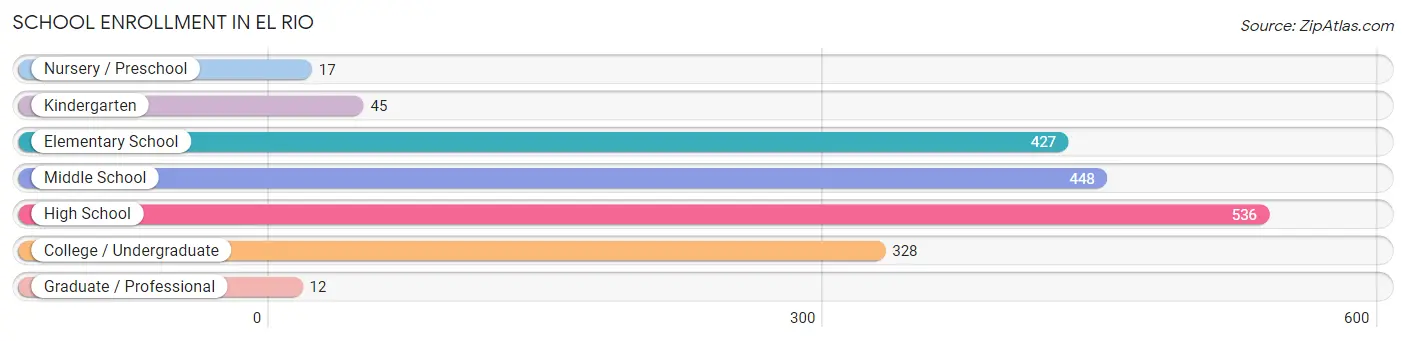
| School Level | # Students | % Students |
| Nursery / Preschool | 17 | 0.9% |
| Kindergarten | 45 | 2.5% |
| Elementary School | 427 | 23.5% |
| Middle School | 448 | 24.7% |
| High School | 536 | 29.6% |
| College / Undergraduate | 328 | 18.1% |
| Graduate / Professional | 12 | 0.7% |
| Total | 1,813 | 100.0% |
School Enrollment by Age by Funding Source in El Rio
Out of a total of 1,813 students who are enrolled in schools in El Rio, 98 (5.4%) attend a private institution, while the remaining 1,715 (94.6%) are enrolled in public schools. The age group of 35 years and over has the highest likelihood of being enrolled in private schools, with 15 (21.1% in the age bracket) enrolled. Conversely, the age group of 3 to 4 year olds has the lowest likelihood of being enrolled in a private school, with 14 (100.0% in the age bracket) attending a public institution.
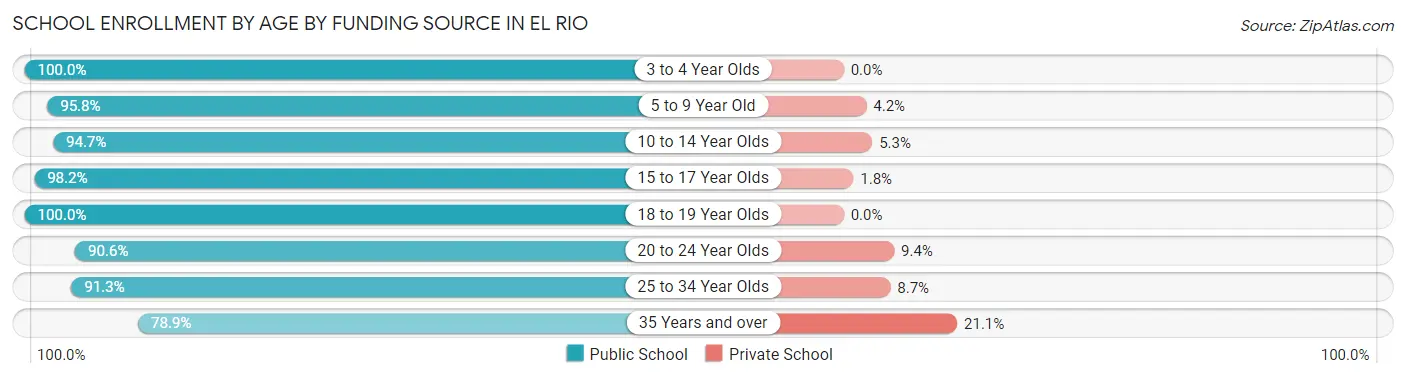
| Age Bracket | Public School | Private School |
| 3 to 4 Year Olds | 14 (100.0%) | 0 (0.0%) |
| 5 to 9 Year Old | 385 (95.8%) | 17 (4.2%) |
| 10 to 14 Year Olds | 587 (94.7%) | 33 (5.3%) |
| 15 to 17 Year Olds | 328 (98.2%) | 6 (1.8%) |
| 18 to 19 Year Olds | 85 (100.0%) | 0 (0.0%) |
| 20 to 24 Year Olds | 135 (90.6%) | 14 (9.4%) |
| 25 to 34 Year Olds | 126 (91.3%) | 12 (8.7%) |
| 35 Years and over | 56 (78.9%) | 15 (21.1%) |
| Total | 1,715 (94.6%) | 98 (5.4%) |
Educational Attainment by Field of Study in El Rio
Science & technology (55 | 15.2%), arts & humanities (52 | 14.4%), psychology (50 | 13.9%), bio, nature & agricultural (38 | 10.5%), and business (35 | 9.7%) are the most common fields of study among 361 individuals in El Rio who have obtained a bachelor's degree or higher.
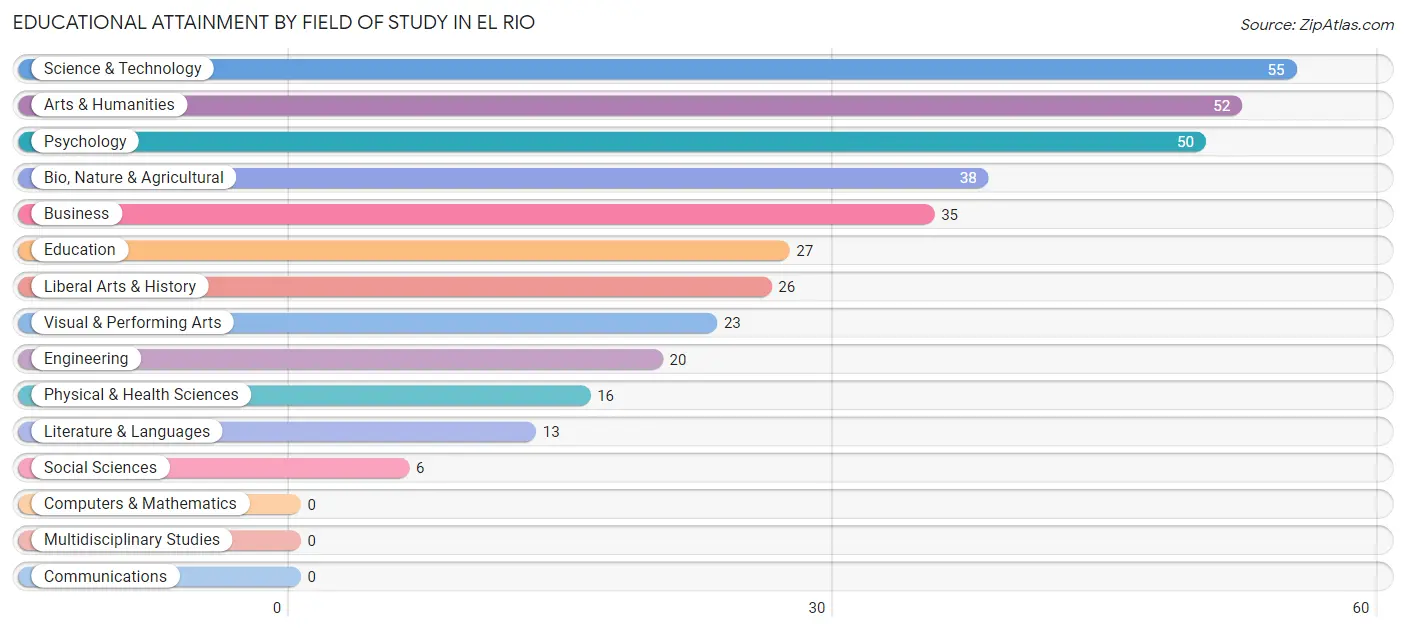
| Field of Study | # Graduates | % Graduates |
| Computers & Mathematics | 0 | 0.0% |
| Bio, Nature & Agricultural | 38 | 10.5% |
| Physical & Health Sciences | 16 | 4.4% |
| Psychology | 50 | 13.9% |
| Social Sciences | 6 | 1.7% |
| Engineering | 20 | 5.5% |
| Multidisciplinary Studies | 0 | 0.0% |
| Science & Technology | 55 | 15.2% |
| Business | 35 | 9.7% |
| Education | 27 | 7.5% |
| Literature & Languages | 13 | 3.6% |
| Liberal Arts & History | 26 | 7.2% |
| Visual & Performing Arts | 23 | 6.4% |
| Communications | 0 | 0.0% |
| Arts & Humanities | 52 | 14.4% |
| Total | 361 | 100.0% |
Transportation & Commute in El Rio
Vehicle Availability by Sex in El Rio
The most prevalent vehicle ownership categories in El Rio are males with 2 vehicles (438, accounting for 29.0%) and females with 2 vehicles (277, making up 35.1%).
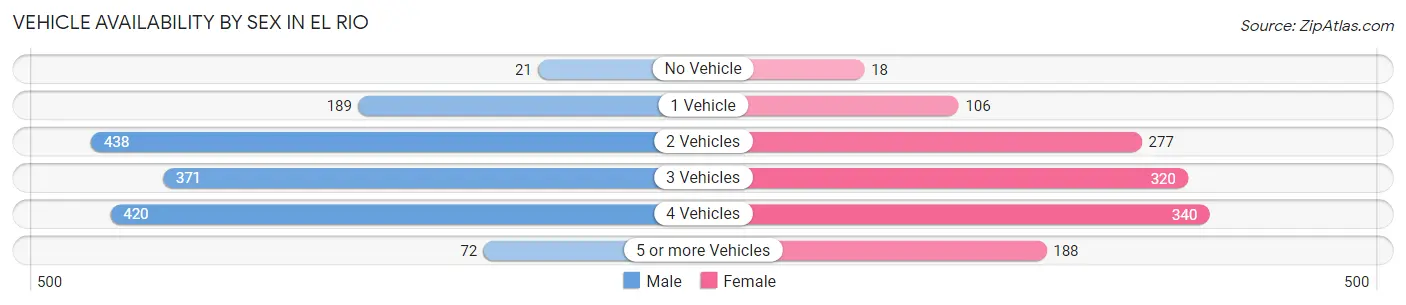
| Vehicles Available | Male | Female |
| No Vehicle | 21 (1.4%) | 18 (1.4%) |
| 1 Vehicle | 189 (12.5%) | 106 (8.5%) |
| 2 Vehicles | 438 (29.0%) | 277 (22.2%) |
| 3 Vehicles | 371 (24.5%) | 320 (25.6%) |
| 4 Vehicles | 420 (27.8%) | 340 (27.2%) |
| 5 or more Vehicles | 72 (4.8%) | 188 (15.0%) |
| Total | 1,511 (100.0%) | 1,249 (100.0%) |
Commute Time in El Rio
The most frequently occuring commute durations in El Rio are 25 to 29 minutes (576 commuters, 22.5%), 15 to 19 minutes (501 commuters, 19.5%), and 10 to 14 minutes (430 commuters, 16.8%).
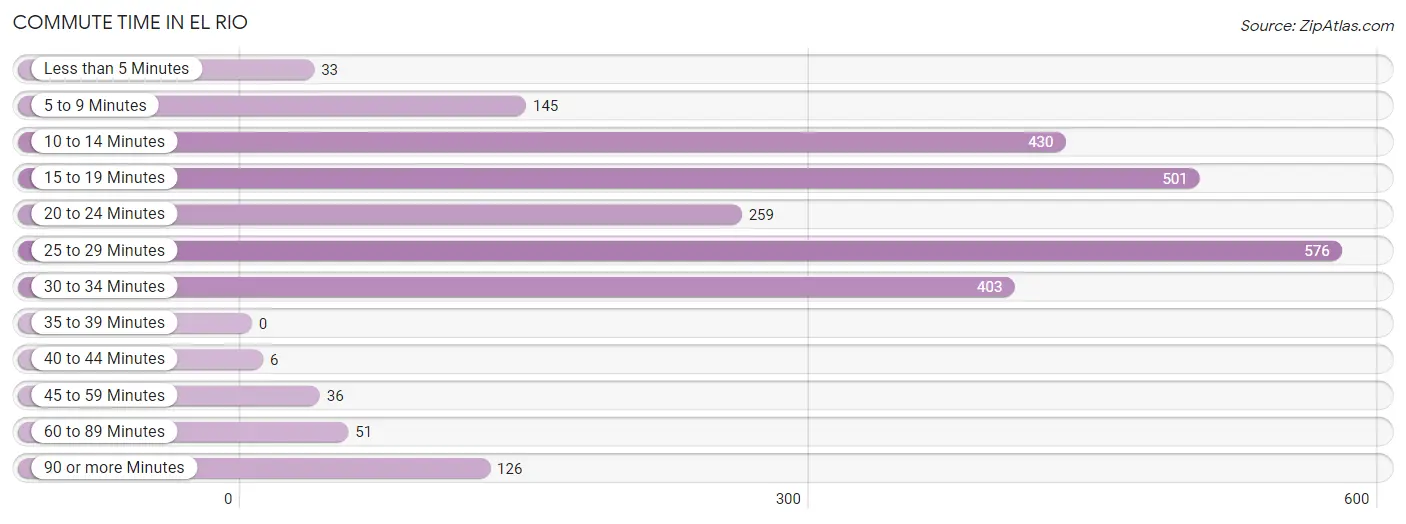
| Commute Time | # Commuters | % Commuters |
| Less than 5 Minutes | 33 | 1.3% |
| 5 to 9 Minutes | 145 | 5.7% |
| 10 to 14 Minutes | 430 | 16.8% |
| 15 to 19 Minutes | 501 | 19.5% |
| 20 to 24 Minutes | 259 | 10.1% |
| 25 to 29 Minutes | 576 | 22.5% |
| 30 to 34 Minutes | 403 | 15.7% |
| 35 to 39 Minutes | 0 | 0.0% |
| 40 to 44 Minutes | 6 | 0.2% |
| 45 to 59 Minutes | 36 | 1.4% |
| 60 to 89 Minutes | 51 | 2.0% |
| 90 or more Minutes | 126 | 4.9% |
Commute Time by Sex in El Rio
The most common commute times in El Rio are 25 to 29 minutes (342 commuters, 24.9%) for males and 15 to 19 minutes (323 commuters, 27.1%) for females.
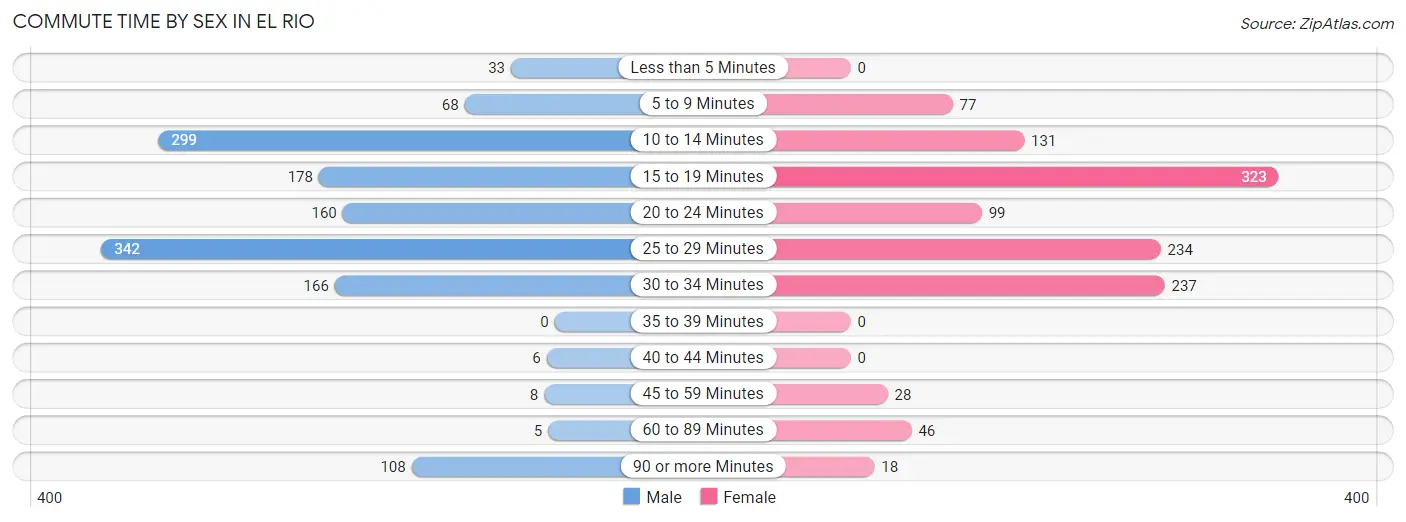
| Commute Time | Male | Female |
| Less than 5 Minutes | 33 (2.4%) | 0 (0.0%) |
| 5 to 9 Minutes | 68 (5.0%) | 77 (6.5%) |
| 10 to 14 Minutes | 299 (21.8%) | 131 (11.0%) |
| 15 to 19 Minutes | 178 (13.0%) | 323 (27.1%) |
| 20 to 24 Minutes | 160 (11.7%) | 99 (8.3%) |
| 25 to 29 Minutes | 342 (24.9%) | 234 (19.6%) |
| 30 to 34 Minutes | 166 (12.1%) | 237 (19.9%) |
| 35 to 39 Minutes | 0 (0.0%) | 0 (0.0%) |
| 40 to 44 Minutes | 6 (0.4%) | 0 (0.0%) |
| 45 to 59 Minutes | 8 (0.6%) | 28 (2.4%) |
| 60 to 89 Minutes | 5 (0.4%) | 46 (3.9%) |
| 90 or more Minutes | 108 (7.9%) | 18 (1.5%) |
Time of Departure to Work by Sex in El Rio
The most frequent times of departure to work in El Rio are 6:00 AM to 6:29 AM (207, 15.1%) for males and 8:30 AM to 8:59 AM (233, 19.5%) for females.
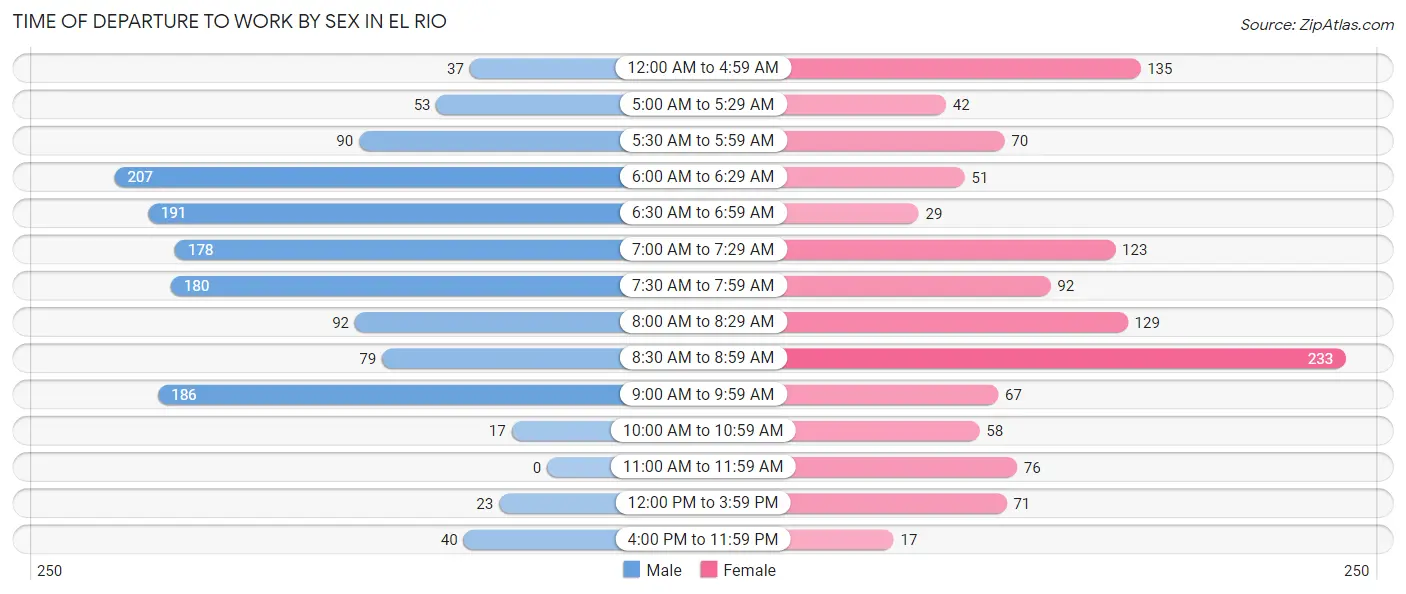
| Time of Departure | Male | Female |
| 12:00 AM to 4:59 AM | 37 (2.7%) | 135 (11.3%) |
| 5:00 AM to 5:29 AM | 53 (3.9%) | 42 (3.5%) |
| 5:30 AM to 5:59 AM | 90 (6.6%) | 70 (5.9%) |
| 6:00 AM to 6:29 AM | 207 (15.1%) | 51 (4.3%) |
| 6:30 AM to 6:59 AM | 191 (13.9%) | 29 (2.4%) |
| 7:00 AM to 7:29 AM | 178 (13.0%) | 123 (10.3%) |
| 7:30 AM to 7:59 AM | 180 (13.1%) | 92 (7.7%) |
| 8:00 AM to 8:29 AM | 92 (6.7%) | 129 (10.8%) |
| 8:30 AM to 8:59 AM | 79 (5.8%) | 233 (19.5%) |
| 9:00 AM to 9:59 AM | 186 (13.6%) | 67 (5.6%) |
| 10:00 AM to 10:59 AM | 17 (1.2%) | 58 (4.9%) |
| 11:00 AM to 11:59 AM | 0 (0.0%) | 76 (6.4%) |
| 12:00 PM to 3:59 PM | 23 (1.7%) | 71 (5.9%) |
| 4:00 PM to 11:59 PM | 40 (2.9%) | 17 (1.4%) |
| Total | 1,373 (100.0%) | 1,193 (100.0%) |
Housing Occupancy in El Rio
Occupancy by Ownership in El Rio
Of the total 1,697 dwellings in El Rio, owner-occupied units account for 988 (58.2%), while renter-occupied units make up 709 (41.8%).
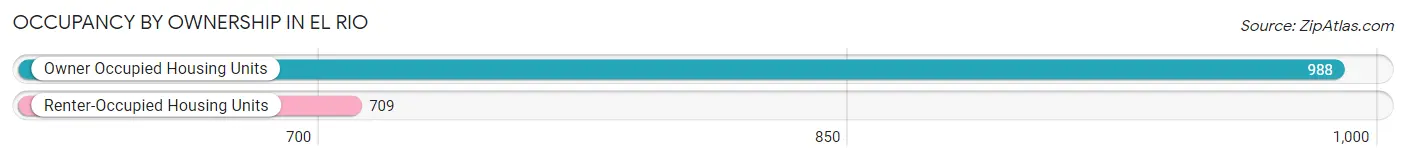
| Occupancy | # Housing Units | % Housing Units |
| Owner Occupied Housing Units | 988 | 58.2% |
| Renter-Occupied Housing Units | 709 | 41.8% |
| Total Occupied Housing Units | 1,697 | 100.0% |
Occupancy by Household Size in El Rio
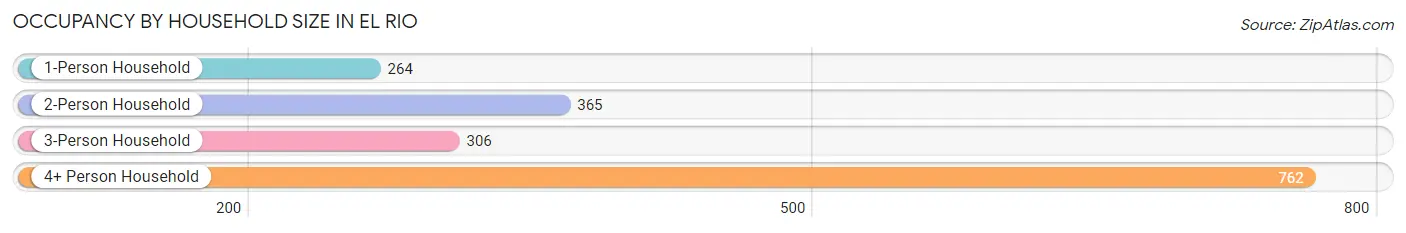
| Household Size | # Housing Units | % Housing Units |
| 1-Person Household | 264 | 15.6% |
| 2-Person Household | 365 | 21.5% |
| 3-Person Household | 306 | 18.0% |
| 4+ Person Household | 762 | 44.9% |
| Total Housing Units | 1,697 | 100.0% |
Occupancy by Ownership by Household Size in El Rio
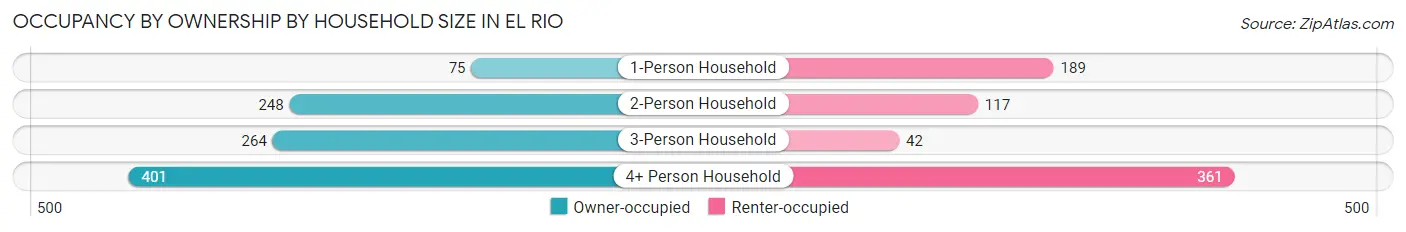
| Household Size | Owner-occupied | Renter-occupied |
| 1-Person Household | 75 (28.4%) | 189 (71.6%) |
| 2-Person Household | 248 (67.9%) | 117 (32.1%) |
| 3-Person Household | 264 (86.3%) | 42 (13.7%) |
| 4+ Person Household | 401 (52.6%) | 361 (47.4%) |
| Total Housing Units | 988 (58.2%) | 709 (41.8%) |
Occupancy by Educational Attainment in El Rio
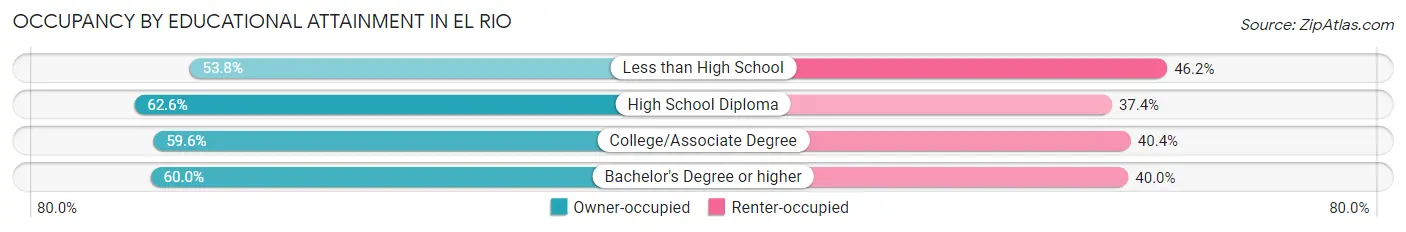
| Household Size | Owner-occupied | Renter-occupied |
| Less than High School | 330 (53.8%) | 283 (46.2%) |
| High School Diploma | 241 (62.6%) | 144 (37.4%) |
| College/Associate Degree | 354 (59.6%) | 240 (40.4%) |
| Bachelor's Degree or higher | 63 (60.0%) | 42 (40.0%) |
Occupancy by Age of Householder in El Rio
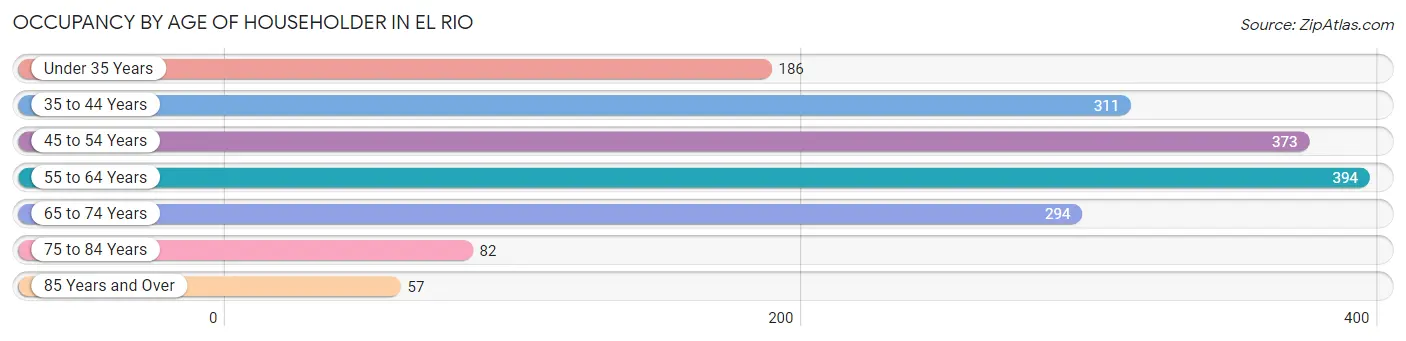
| Age Bracket | # Households | % Households |
| Under 35 Years | 186 | 11.0% |
| 35 to 44 Years | 311 | 18.3% |
| 45 to 54 Years | 373 | 22.0% |
| 55 to 64 Years | 394 | 23.2% |
| 65 to 74 Years | 294 | 17.3% |
| 75 to 84 Years | 82 | 4.8% |
| 85 Years and Over | 57 | 3.4% |
| Total | 1,697 | 100.0% |
Housing Finances in El Rio
Median Income by Occupancy in El Rio
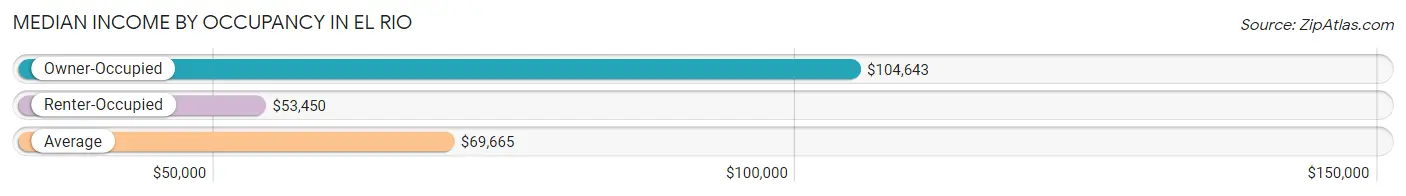
| Occupancy Type | # Households | Median Income |
| Owner-Occupied | 988 (58.2%) | $104,643 |
| Renter-Occupied | 709 (41.8%) | $53,450 |
| Average | 1,697 (100.0%) | $69,665 |
Occupancy by Householder Income Bracket in El Rio
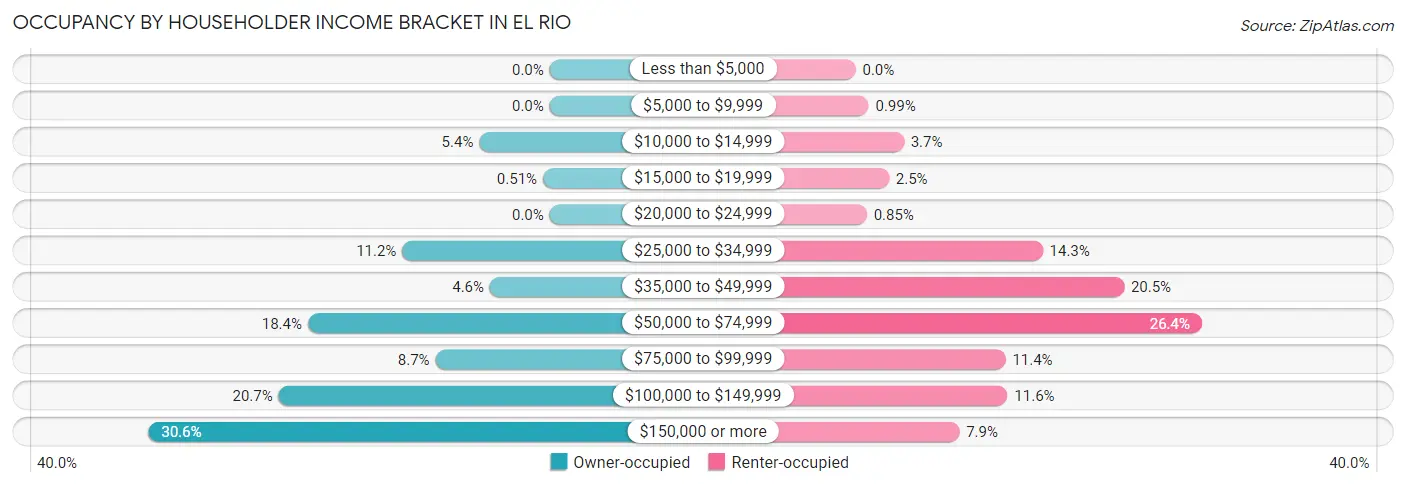
| Income Bracket | Owner-occupied | Renter-occupied |
| Less than $5,000 | 0 (0.0%) | 0 (0.0%) |
| $5,000 to $9,999 | 0 (0.0%) | 7 (1.0%) |
| $10,000 to $14,999 | 53 (5.4%) | 26 (3.7%) |
| $15,000 to $19,999 | 5 (0.5%) | 18 (2.5%) |
| $20,000 to $24,999 | 0 (0.0%) | 6 (0.9%) |
| $25,000 to $34,999 | 111 (11.2%) | 101 (14.2%) |
| $35,000 to $49,999 | 45 (4.5%) | 145 (20.4%) |
| $50,000 to $74,999 | 182 (18.4%) | 187 (26.4%) |
| $75,000 to $99,999 | 86 (8.7%) | 81 (11.4%) |
| $100,000 to $149,999 | 204 (20.6%) | 82 (11.6%) |
| $150,000 or more | 302 (30.6%) | 56 (7.9%) |
| Total | 988 (100.0%) | 709 (100.0%) |
Monthly Housing Cost Tiers in El Rio
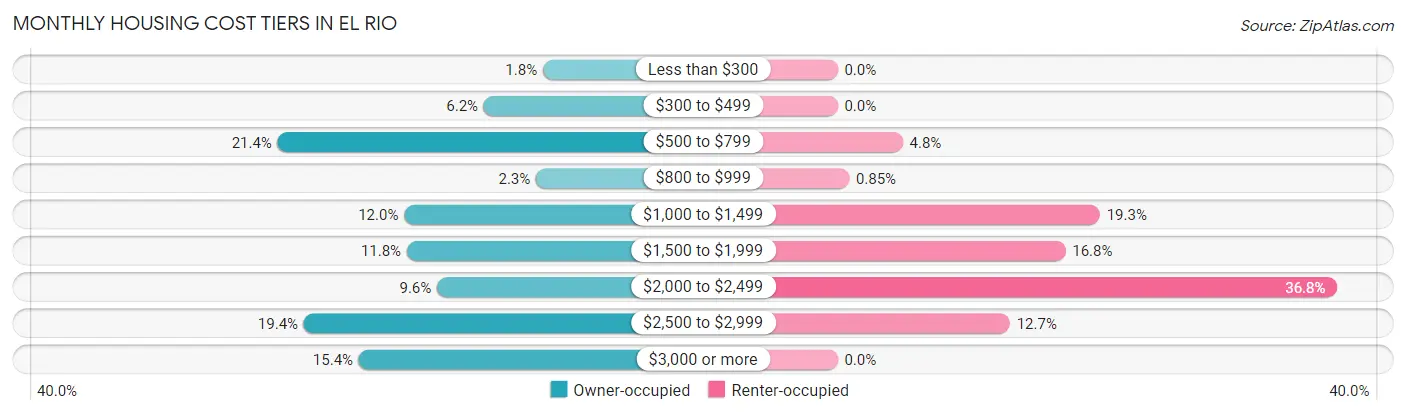
| Monthly Cost | Owner-occupied | Renter-occupied |
| Less than $300 | 18 (1.8%) | 0 (0.0%) |
| $300 to $499 | 61 (6.2%) | 0 (0.0%) |
| $500 to $799 | 211 (21.4%) | 34 (4.8%) |
| $800 to $999 | 23 (2.3%) | 6 (0.9%) |
| $1,000 to $1,499 | 119 (12.0%) | 137 (19.3%) |
| $1,500 to $1,999 | 117 (11.8%) | 119 (16.8%) |
| $2,000 to $2,499 | 95 (9.6%) | 261 (36.8%) |
| $2,500 to $2,999 | 192 (19.4%) | 90 (12.7%) |
| $3,000 or more | 152 (15.4%) | 0 (0.0%) |
| Total | 988 (100.0%) | 709 (100.0%) |
Physical Housing Characteristics in El Rio
Housing Structures in El Rio
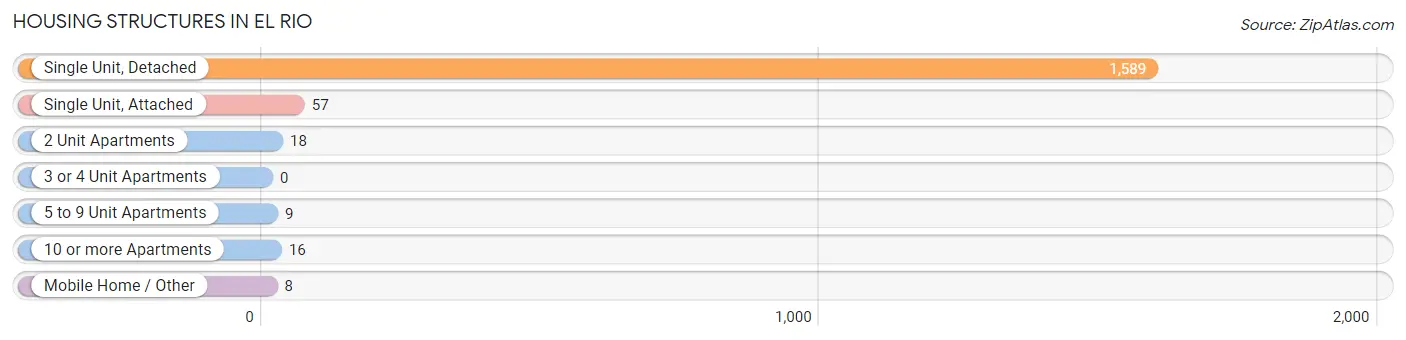
| Structure Type | # Housing Units | % Housing Units |
| Single Unit, Detached | 1,589 | 93.6% |
| Single Unit, Attached | 57 | 3.4% |
| 2 Unit Apartments | 18 | 1.1% |
| 3 or 4 Unit Apartments | 0 | 0.0% |
| 5 to 9 Unit Apartments | 9 | 0.5% |
| 10 or more Apartments | 16 | 0.9% |
| Mobile Home / Other | 8 | 0.5% |
| Total | 1,697 | 100.0% |
Housing Structures by Occupancy in El Rio
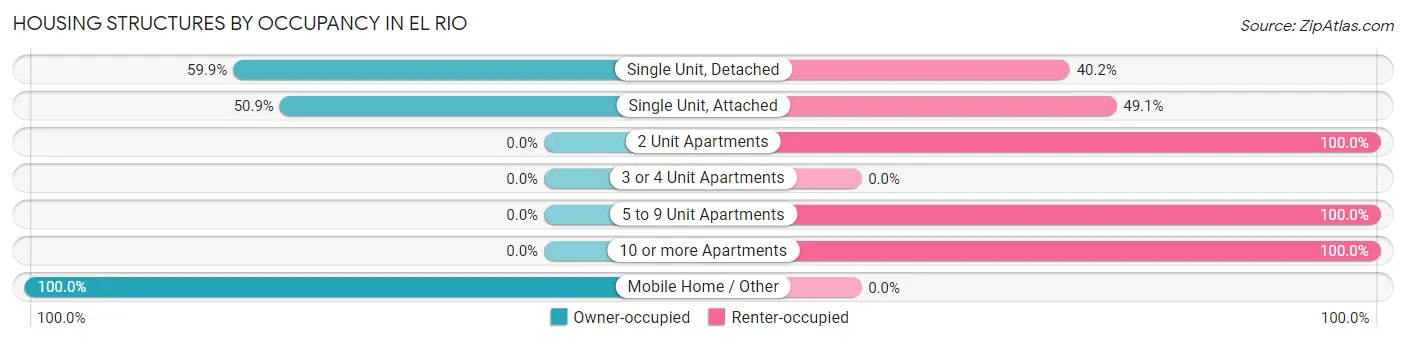
| Structure Type | Owner-occupied | Renter-occupied |
| Single Unit, Detached | 951 (59.9%) | 638 (40.2%) |
| Single Unit, Attached | 29 (50.9%) | 28 (49.1%) |
| 2 Unit Apartments | 0 (0.0%) | 18 (100.0%) |
| 3 or 4 Unit Apartments | 0 (0.0%) | 0 (0.0%) |
| 5 to 9 Unit Apartments | 0 (0.0%) | 9 (100.0%) |
| 10 or more Apartments | 0 (0.0%) | 16 (100.0%) |
| Mobile Home / Other | 8 (100.0%) | 0 (0.0%) |
| Total | 988 (58.2%) | 709 (41.8%) |
Housing Structures by Number of Rooms in El Rio
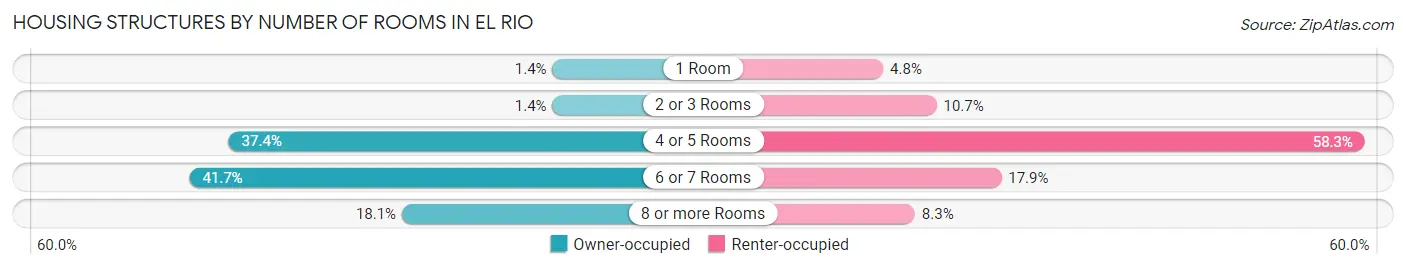
| Number of Rooms | Owner-occupied | Renter-occupied |
| 1 Room | 14 (1.4%) | 34 (4.8%) |
| 2 or 3 Rooms | 14 (1.4%) | 76 (10.7%) |
| 4 or 5 Rooms | 369 (37.3%) | 413 (58.3%) |
| 6 or 7 Rooms | 412 (41.7%) | 127 (17.9%) |
| 8 or more Rooms | 179 (18.1%) | 59 (8.3%) |
| Total | 988 (100.0%) | 709 (100.0%) |
Housing Structure by Heating Type in El Rio
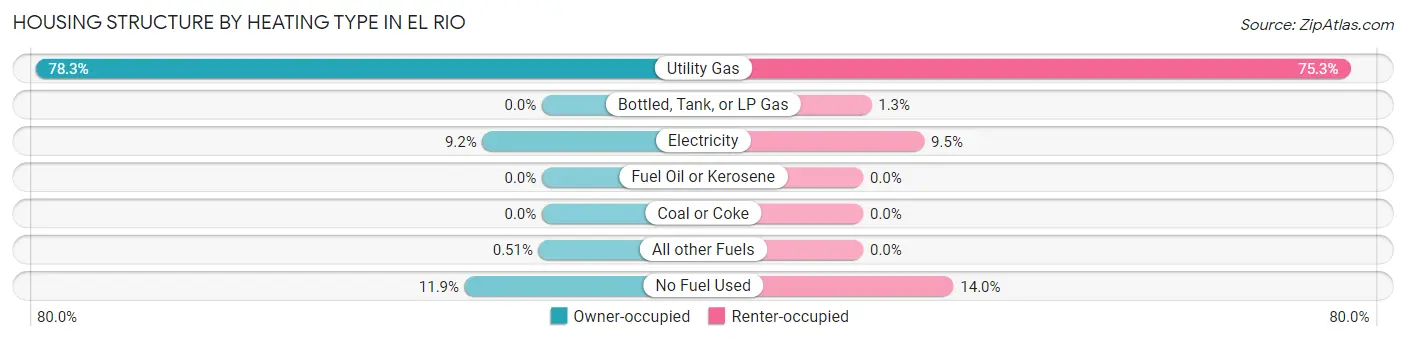
| Heating Type | Owner-occupied | Renter-occupied |
| Utility Gas | 774 (78.3%) | 534 (75.3%) |
| Bottled, Tank, or LP Gas | 0 (0.0%) | 9 (1.3%) |
| Electricity | 91 (9.2%) | 67 (9.5%) |
| Fuel Oil or Kerosene | 0 (0.0%) | 0 (0.0%) |
| Coal or Coke | 0 (0.0%) | 0 (0.0%) |
| All other Fuels | 5 (0.5%) | 0 (0.0%) |
| No Fuel Used | 118 (11.9%) | 99 (14.0%) |
| Total | 988 (100.0%) | 709 (100.0%) |
Household Vehicle Usage in El Rio
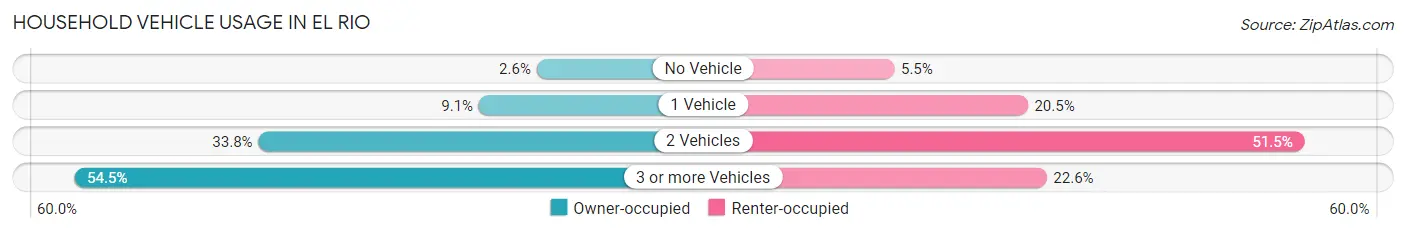
| Vehicles per Household | Owner-occupied | Renter-occupied |
| No Vehicle | 26 (2.6%) | 39 (5.5%) |
| 1 Vehicle | 90 (9.1%) | 145 (20.4%) |
| 2 Vehicles | 334 (33.8%) | 365 (51.5%) |
| 3 or more Vehicles | 538 (54.4%) | 160 (22.6%) |
| Total | 988 (100.0%) | 709 (100.0%) |
Real Estate & Mortgages in El Rio
Real Estate and Mortgage Overview in El Rio
| Characteristic | Without Mortgage | With Mortgage |
| Housing Units | 323 | 665 |
| Median Property Value | $624,500 | $616,800 |
| Median Household Income | $103,661 | $248 |
| Monthly Housing Costs | $574 | $152 |
| Real Estate Taxes | $3,254 | $5 |
Property Value by Mortgage Status in El Rio
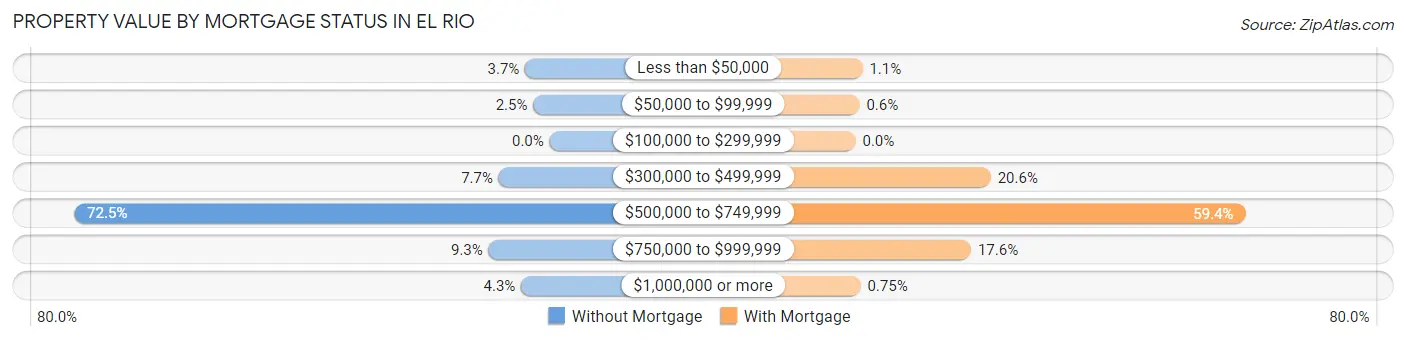
| Property Value | Without Mortgage | With Mortgage |
| Less than $50,000 | 12 (3.7%) | 7 (1.1%) |
| $50,000 to $99,999 | 8 (2.5%) | 4 (0.6%) |
| $100,000 to $299,999 | 0 (0.0%) | 0 (0.0%) |
| $300,000 to $499,999 | 25 (7.7%) | 137 (20.6%) |
| $500,000 to $749,999 | 234 (72.5%) | 395 (59.4%) |
| $750,000 to $999,999 | 30 (9.3%) | 117 (17.6%) |
| $1,000,000 or more | 14 (4.3%) | 5 (0.7%) |
| Total | 323 (100.0%) | 665 (100.0%) |
Household Income by Mortgage Status in El Rio
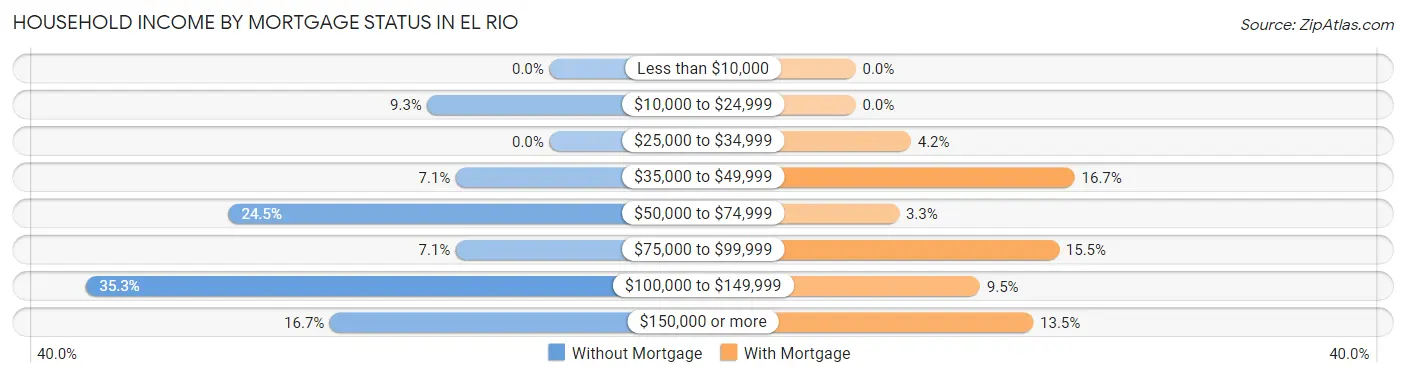
| Household Income | Without Mortgage | With Mortgage |
| Less than $10,000 | 0 (0.0%) | 0 (0.0%) |
| $10,000 to $24,999 | 30 (9.3%) | 0 (0.0%) |
| $25,000 to $34,999 | 0 (0.0%) | 28 (4.2%) |
| $35,000 to $49,999 | 23 (7.1%) | 111 (16.7%) |
| $50,000 to $74,999 | 79 (24.5%) | 22 (3.3%) |
| $75,000 to $99,999 | 23 (7.1%) | 103 (15.5%) |
| $100,000 to $149,999 | 114 (35.3%) | 63 (9.5%) |
| $150,000 or more | 54 (16.7%) | 90 (13.5%) |
| Total | 323 (100.0%) | 665 (100.0%) |
Property Value to Household Income Ratio in El Rio
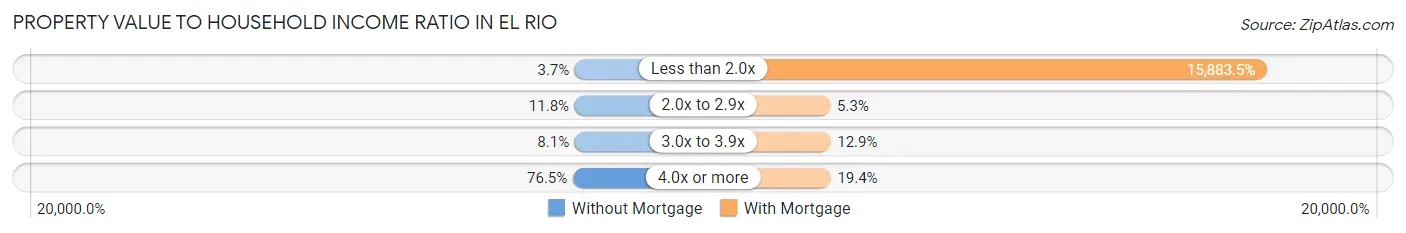
| Value-to-Income Ratio | Without Mortgage | With Mortgage |
| Less than 2.0x | 12 (3.7%) | 105,625 (15,883.5%) |
| 2.0x to 2.9x | 38 (11.8%) | 35 (5.3%) |
| 3.0x to 3.9x | 26 (8.1%) | 86 (12.9%) |
| 4.0x or more | 247 (76.5%) | 129 (19.4%) |
| Total | 323 (100.0%) | 665 (100.0%) |
Real Estate Taxes by Mortgage Status in El Rio

| Property Taxes | Without Mortgage | With Mortgage |
| Less than $800 | 7 (2.2%) | 0 (0.0%) |
| $800 to $1,499 | 16 (5.0%) | 8 (1.2%) |
| $800 to $1,499 | 280 (86.7%) | 105 (15.8%) |
| Total | 323 (100.0%) | 665 (100.0%) |
Health & Disability in El Rio
Health Insurance Coverage by Age in El Rio
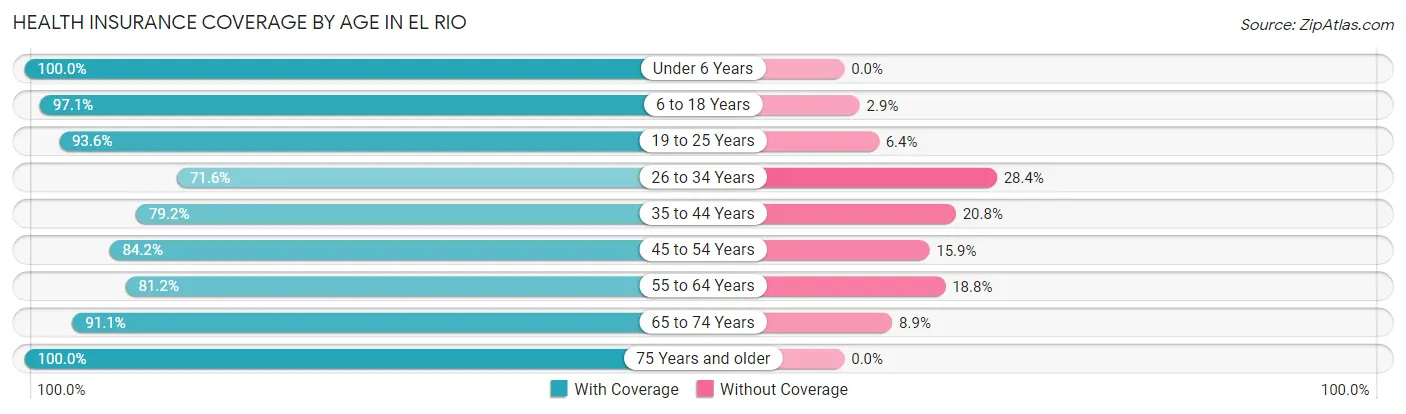
| Age Bracket | With Coverage | Without Coverage |
| Under 6 Years | 355 (100.0%) | 0 (0.0%) |
| 6 to 18 Years | 1,325 (97.1%) | 39 (2.9%) |
| 19 to 25 Years | 496 (93.6%) | 34 (6.4%) |
| 26 to 34 Years | 655 (71.6%) | 260 (28.4%) |
| 35 to 44 Years | 568 (79.2%) | 149 (20.8%) |
| 45 to 54 Years | 754 (84.2%) | 142 (15.9%) |
| 55 to 64 Years | 746 (81.2%) | 173 (18.8%) |
| 65 to 74 Years | 429 (91.1%) | 42 (8.9%) |
| 75 Years and older | 242 (100.0%) | 0 (0.0%) |
| Total | 5,570 (86.9%) | 839 (13.1%) |
Health Insurance Coverage by Citizenship Status in El Rio

| Citizenship Status | With Coverage | Without Coverage |
| Native Born | 355 (100.0%) | 0 (0.0%) |
| Foreign Born, Citizen | 1,325 (97.1%) | 39 (2.9%) |
| Foreign Born, not a Citizen | 496 (93.6%) | 34 (6.4%) |
Health Insurance Coverage by Household Income in El Rio
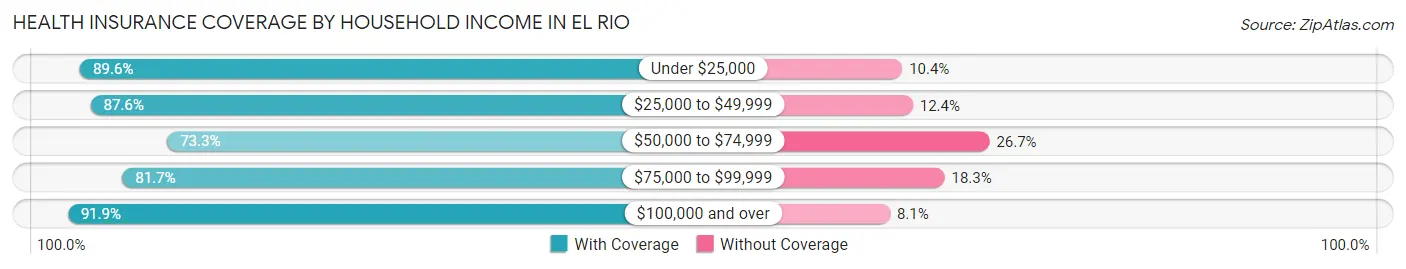
| Household Income | With Coverage | Without Coverage |
| Under $25,000 | 328 (89.6%) | 38 (10.4%) |
| $25,000 to $49,999 | 1,135 (87.6%) | 160 (12.4%) |
| $50,000 to $74,999 | 751 (73.3%) | 274 (26.7%) |
| $75,000 to $99,999 | 540 (81.7%) | 121 (18.3%) |
| $100,000 and over | 2,797 (91.9%) | 246 (8.1%) |
Public vs Private Health Insurance Coverage by Age in El Rio
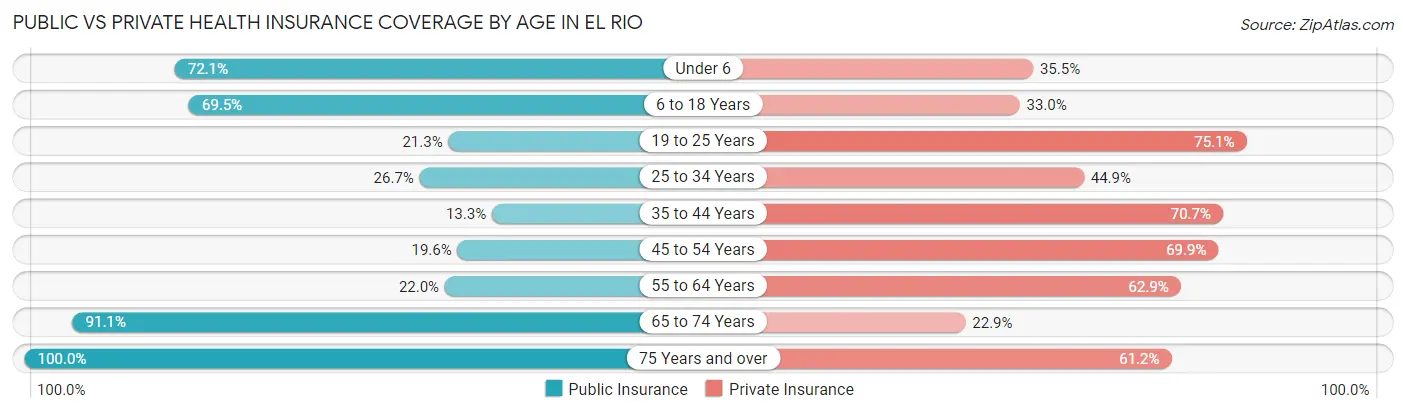
| Age Bracket | Public Insurance | Private Insurance |
| Under 6 | 256 (72.1%) | 126 (35.5%) |
| 6 to 18 Years | 948 (69.5%) | 450 (33.0%) |
| 19 to 25 Years | 113 (21.3%) | 398 (75.1%) |
| 25 to 34 Years | 244 (26.7%) | 411 (44.9%) |
| 35 to 44 Years | 95 (13.3%) | 507 (70.7%) |
| 45 to 54 Years | 176 (19.6%) | 626 (69.9%) |
| 55 to 64 Years | 202 (22.0%) | 578 (62.9%) |
| 65 to 74 Years | 429 (91.1%) | 108 (22.9%) |
| 75 Years and over | 242 (100.0%) | 148 (61.2%) |
| Total | 2,705 (42.2%) | 3,352 (52.3%) |
Disability Status by Sex by Age in El Rio
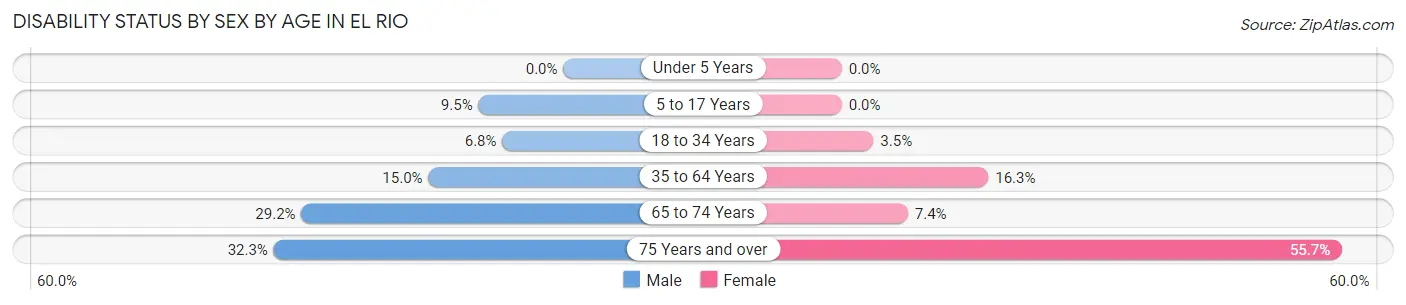
| Age Bracket | Male | Female |
| Under 5 Years | 0 (0.0%) | 0 (0.0%) |
| 5 to 17 Years | 53 (9.5%) | 0 (0.0%) |
| 18 to 34 Years | 53 (6.8%) | 25 (3.5%) |
| 35 to 64 Years | 200 (15.0%) | 196 (16.3%) |
| 65 to 74 Years | 70 (29.2%) | 17 (7.4%) |
| 75 Years and over | 30 (32.3%) | 83 (55.7%) |
Disability Class by Sex by Age in El Rio
Disability Class: Hearing Difficulty
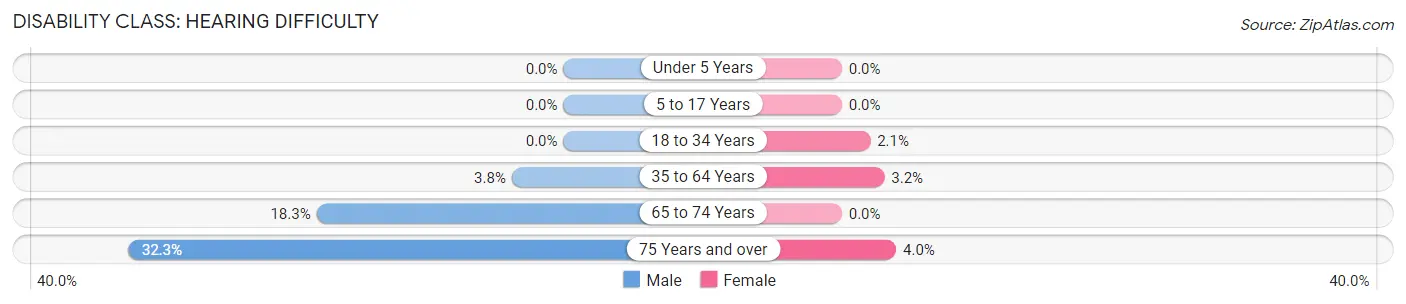
| Age Bracket | Male | Female |
| Under 5 Years | 0 (0.0%) | 0 (0.0%) |
| 5 to 17 Years | 0 (0.0%) | 0 (0.0%) |
| 18 to 34 Years | 0 (0.0%) | 15 (2.1%) |
| 35 to 64 Years | 51 (3.8%) | 38 (3.2%) |
| 65 to 74 Years | 44 (18.3%) | 0 (0.0%) |
| 75 Years and over | 30 (32.3%) | 6 (4.0%) |
Disability Class: Vision Difficulty
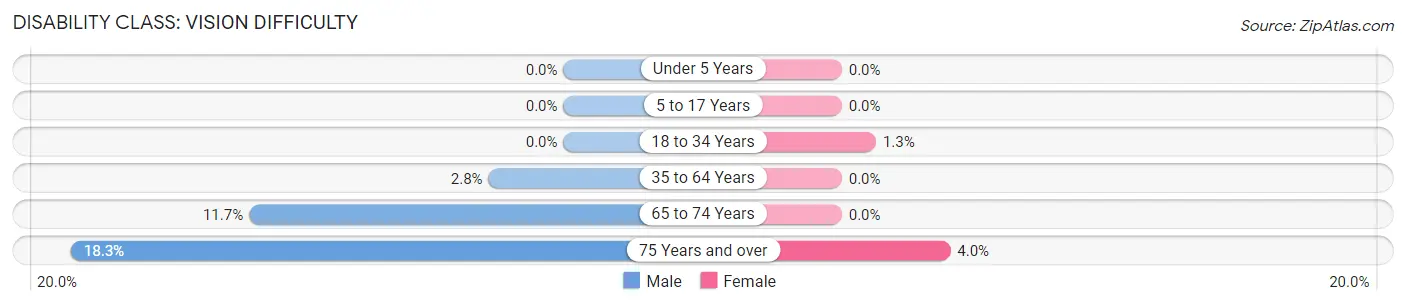
| Age Bracket | Male | Female |
| Under 5 Years | 0 (0.0%) | 0 (0.0%) |
| 5 to 17 Years | 0 (0.0%) | 0 (0.0%) |
| 18 to 34 Years | 0 (0.0%) | 9 (1.3%) |
| 35 to 64 Years | 37 (2.8%) | 0 (0.0%) |
| 65 to 74 Years | 28 (11.7%) | 0 (0.0%) |
| 75 Years and over | 17 (18.3%) | 6 (4.0%) |
Disability Class: Cognitive Difficulty
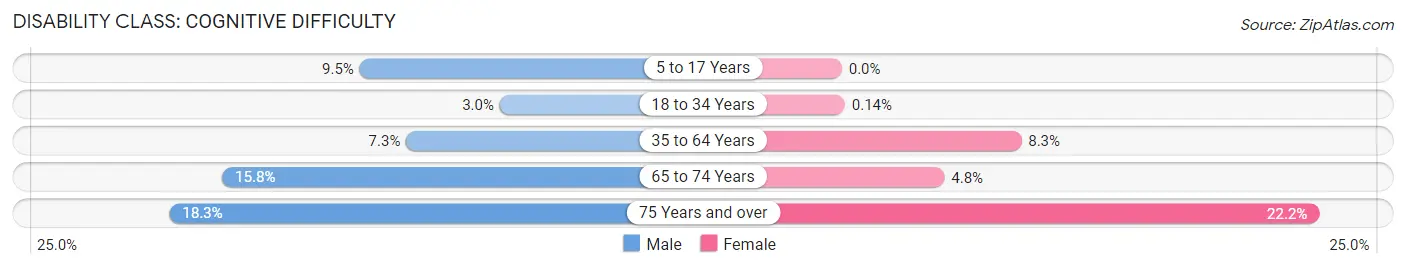
| Age Bracket | Male | Female |
| 5 to 17 Years | 53 (9.5%) | 0 (0.0%) |
| 18 to 34 Years | 23 (2.9%) | 1 (0.1%) |
| 35 to 64 Years | 97 (7.3%) | 100 (8.3%) |
| 65 to 74 Years | 38 (15.8%) | 11 (4.8%) |
| 75 Years and over | 17 (18.3%) | 33 (22.2%) |
Disability Class: Ambulatory Difficulty
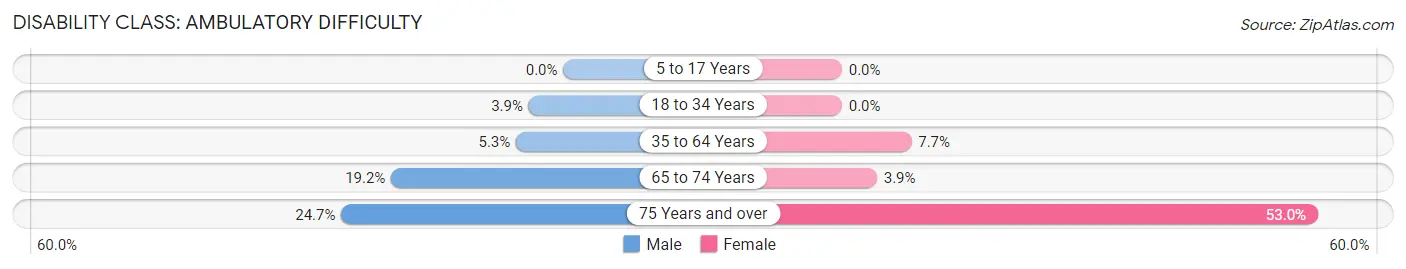
| Age Bracket | Male | Female |
| 5 to 17 Years | 0 (0.0%) | 0 (0.0%) |
| 18 to 34 Years | 30 (3.8%) | 0 (0.0%) |
| 35 to 64 Years | 70 (5.3%) | 93 (7.7%) |
| 65 to 74 Years | 46 (19.2%) | 9 (3.9%) |
| 75 Years and over | 23 (24.7%) | 79 (53.0%) |
Disability Class: Self-Care Difficulty
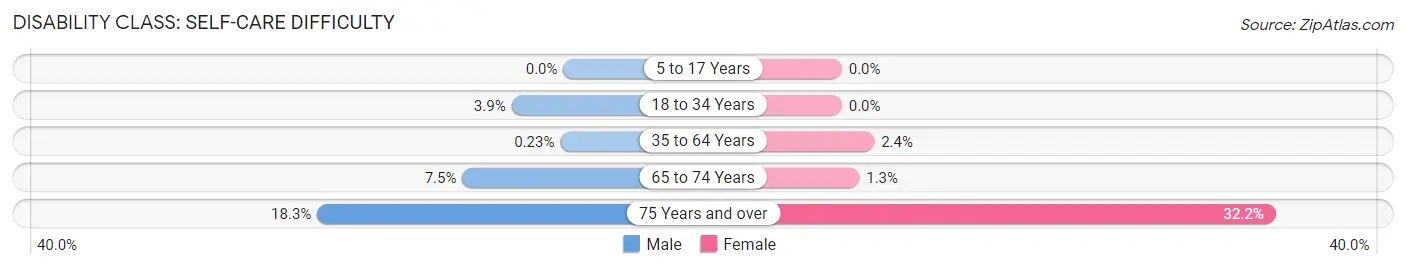
| Age Bracket | Male | Female |
| 5 to 17 Years | 0 (0.0%) | 0 (0.0%) |
| 18 to 34 Years | 30 (3.8%) | 0 (0.0%) |
| 35 to 64 Years | 3 (0.2%) | 29 (2.4%) |
| 65 to 74 Years | 18 (7.5%) | 3 (1.3%) |
| 75 Years and over | 17 (18.3%) | 48 (32.2%) |
Technology Access in El Rio
Computing Device Access in El Rio
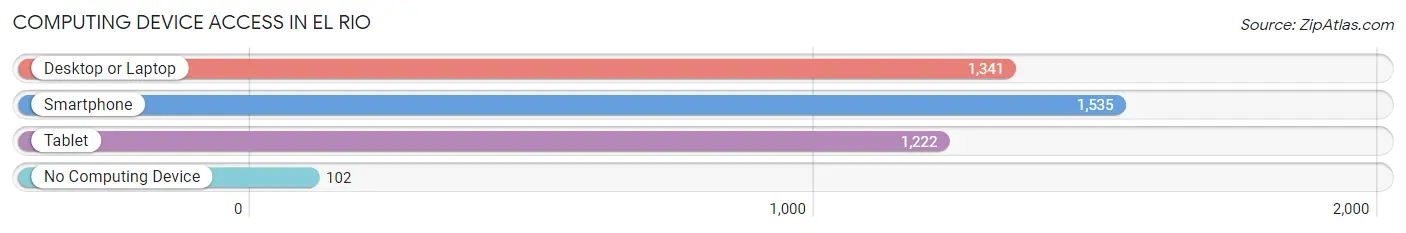
| Device Type | # Households | % Households |
| Desktop or Laptop | 1,341 | 79.0% |
| Smartphone | 1,535 | 90.4% |
| Tablet | 1,222 | 72.0% |
| No Computing Device | 102 | 6.0% |
| Total | 1,697 | 100.0% |
Internet Access in El Rio
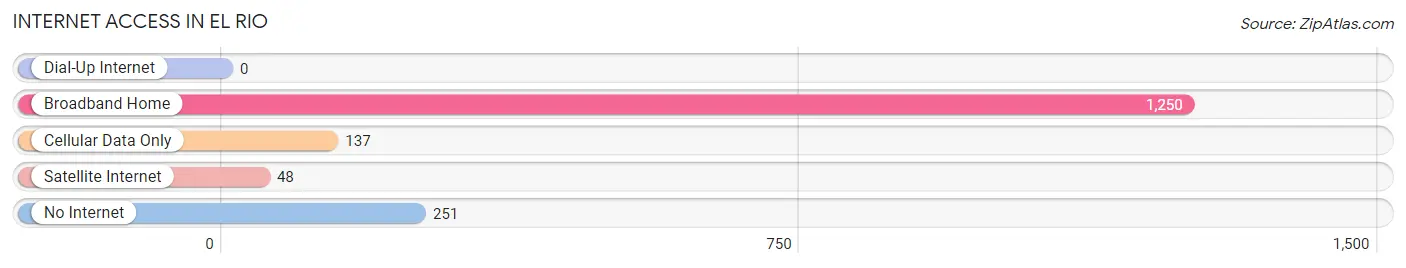
| Internet Type | # Households | % Households |
| Dial-Up Internet | 0 | 0.0% |
| Broadband Home | 1,250 | 73.7% |
| Cellular Data Only | 137 | 8.1% |
| Satellite Internet | 48 | 2.8% |
| No Internet | 251 | 14.8% |
| Total | 1,697 | 100.0% |
El Rio Summary
Rio, California is a small unincorporated community located in the western part of Riverside County, California. It is situated in the foothills of the San Jacinto Mountains, about 25 miles east of the city of Riverside. The population of Rio, California was estimated to be around 1,000 people in 2020.
History
Rio, California was first settled in the late 1800s by a group of Mexican settlers who were looking for a place to call home. The area was originally known as El Rio de San Jacinto, which translates to “The River of San Jacinto”. The settlers were attracted to the area due to its fertile soil and abundant water supply. The first settlers built adobe homes and planted crops such as corn, beans, and squash.
In the early 1900s, the area was annexed by Riverside County and the name was changed to Rio, California. The town was officially incorporated in 1912 and the first post office was established in 1913.
Geography
Rio, California is located in the western part of Riverside County, California. It is situated in the foothills of the San Jacinto Mountains, about 25 miles east of the city of Riverside. The area is characterized by rolling hills and valleys, with the San Jacinto Mountains to the west and the Santa Ana Mountains to the east. The climate is semi-arid, with hot summers and mild winters.
Economy
Rio, California is a small, rural community with a primarily agricultural economy. The main crops grown in the area are citrus fruits, avocados, and olives. Other crops grown in the area include alfalfa, hay, and vegetables. The area is also home to several wineries and vineyards.
The area is also home to several small businesses, including restaurants, shops, and services. The town is also home to a few small manufacturing companies.
Demographics
Rio, California has a population of approximately 1,000 people. The population is primarily Hispanic, with a small percentage of African Americans and other ethnicities. The median household income is around $50,000, and the median home value is around $200,000. The unemployment rate is around 5%, which is slightly higher than the national average.
Conclusion
Rio, California is a small, rural community located in the western part of Riverside County, California. It is situated in the foothills of the San Jacinto Mountains, about 25 miles east of the city of Riverside. The population of Rio, California is estimated to be around 1,000 people. The economy is primarily agricultural, with crops such as citrus fruits, avocados, and olives being grown in the area. The population is primarily Hispanic, with a small percentage of African Americans and other ethnicities. The median household income is around $50,000, and the median home value is around $200,000.
Common Questions
What is Per Capita Income in El Rio?
Per Capita income in El Rio is $27,548.
What is the Median Family Income in El Rio?
Median Family Income in El Rio is $74,688.
What is the Median Household income in El Rio?
Median Household Income in El Rio is $69,665.
What is Income or Wage Gap in El Rio?
Income or Wage Gap in El Rio is 14.8%.
Women in El Rio earn 85.2 cents for every dollar earned by a man.
What is Inequality or Gini Index in El Rio?
Inequality or Gini Index in El Rio is 0.39.
What is the Total Population of El Rio?
Total Population of El Rio is 6,418.
What is the Total Male Population of El Rio?
Total Male Population of El Rio is 3,143.
What is the Total Female Population of El Rio?
Total Female Population of El Rio is 3,275.
What is the Ratio of Males per 100 Females in El Rio?
There are 95.97 Males per 100 Females in El Rio.
What is the Ratio of Females per 100 Males in El Rio?
There are 104.20 Females per 100 Males in El Rio.
What is the Median Population Age in El Rio?
Median Population Age in El Rio is 35.5 Years.
What is the Average Family Size in El Rio
Average Family Size in El Rio is 4.2 People.
What is the Average Household Size in El Rio
Average Household Size in El Rio is 3.8 People.
How Large is the Labor Force in El Rio?
There are 3,238 People in the Labor Forcein in El Rio.
What is the Percentage of People in the Labor Force in El Rio?
66.7% of People are in the Labor Force in El Rio.
What is the Unemployment Rate in El Rio?
Unemployment Rate in El Rio is 12.7%.