Cities with the Highest Percentage of Population Employed in Installation, Maintenance & Repair in Maine
RELATED REPORTS & OPTIONS
Installation, Maintenance & Repair
Maine
Compare Cities
Map of Cities with the Highest Percentage of Population Employed in Installation, Maintenance & Repair in Maine
0.0%
50.0%
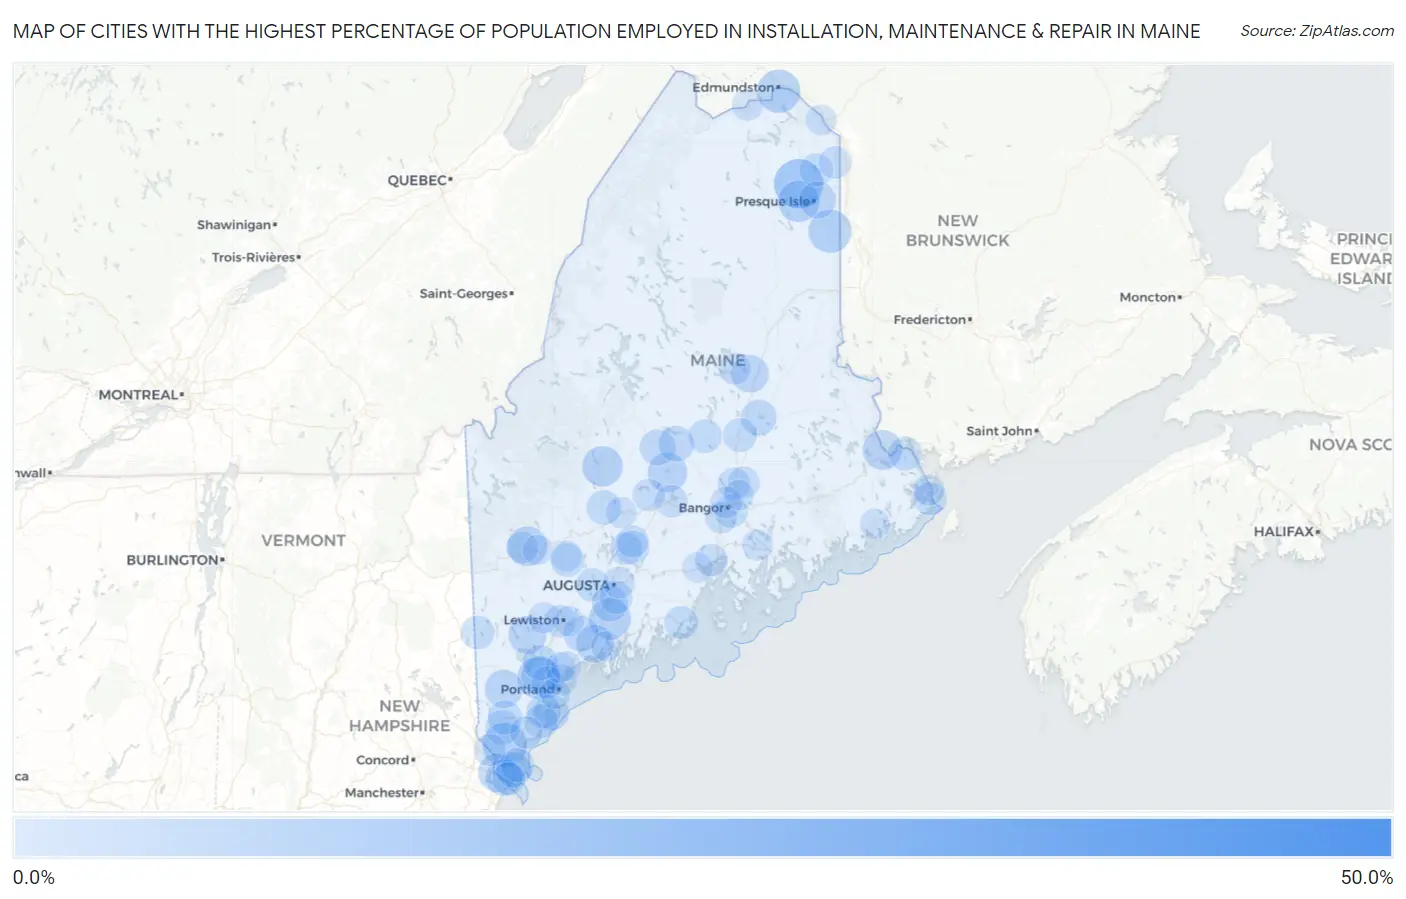
Cities with the Highest Percentage of Population Employed in Installation, Maintenance & Repair in Maine
| City | % Employed | vs State | vs National | |
| 1. | Vanceboro | 44.4% | 3.3%(+41.2)#1 | 3.1%(+41.4)#107 |
| 2. | Rangeley | 21.8% | 3.3%(+18.5)#2 | 3.1%(+18.7)#556 |
| 3. | Turner | 16.7% | 3.3%(+13.4)#3 | 3.1%(+13.6)#928 |
| 4. | Washburn | 13.3% | 3.3%(+10.0)#4 | 3.1%(+10.2)#1,497 |
| 5. | Patten | 10.6% | 3.3%(+7.33)#5 | 3.1%(+7.55)#2,279 |
| 6. | North Berwick | 10.1% | 3.3%(+6.83)#6 | 3.1%(+7.05)#2,501 |
| 7. | Madawaska | 9.5% | 3.3%(+6.19)#7 | 3.1%(+6.41)#2,848 |
| 8. | Blaine | 9.2% | 3.3%(+5.96)#8 | 3.1%(+6.18)#2,975 |
| 9. | Little Falls | 9.0% | 3.3%(+5.69)#9 | 3.1%(+5.91)#3,136 |
| 10. | Richmond | 8.5% | 3.3%(+5.20)#10 | 3.1%(+5.42)#3,514 |
| 11. | Grand Isle | 8.5% | 3.3%(+5.16)#11 | 3.1%(+5.38)#3,546 |
| 12. | Mapleton | 8.3% | 3.3%(+5.00)#12 | 3.1%(+5.22)#3,687 |
| 13. | Mattawamkeag | 7.7% | 3.3%(+4.45)#13 | 3.1%(+4.67)#4,155 |
| 14. | Bingham | 7.6% | 3.3%(+4.32)#14 | 3.1%(+4.54)#4,311 |
| 15. | Mexico | 7.3% | 3.3%(+3.99)#15 | 3.1%(+4.22)#4,661 |
| 16. | Woodland | 7.1% | 3.3%(+3.78)#16 | 3.1%(+4.00)#4,930 |
| 17. | Dexter | 7.1% | 3.3%(+3.77)#17 | 3.1%(+3.99)#4,948 |
| 18. | Bradley | 6.7% | 3.3%(+3.36)#18 | 3.1%(+3.58)#5,475 |
| 19. | South Eliot | 6.6% | 3.3%(+3.27)#19 | 3.1%(+3.49)#5,615 |
| 20. | South Windham | 6.4% | 3.3%(+3.13)#20 | 3.1%(+3.35)#5,810 |
| 21. | Lake Arrowhead | 6.2% | 3.3%(+2.93)#21 | 3.1%(+3.15)#6,120 |
| 22. | Topsham | 6.1% | 3.3%(+2.78)#22 | 3.1%(+3.00)#6,354 |
| 23. | Casco | 6.0% | 3.3%(+2.70)#23 | 3.1%(+2.92)#6,460 |
| 24. | East Millinocket | 5.8% | 3.3%(+2.55)#24 | 3.1%(+2.78)#6,737 |
| 25. | Kezar Falls | 5.7% | 3.3%(+2.45)#25 | 3.1%(+2.67)#6,935 |
| 26. | Presque Isle | 5.3% | 3.3%(+2.03)#26 | 3.1%(+2.25)#7,783 |
| 27. | Kittery | 5.2% | 3.3%(+1.89)#27 | 3.1%(+2.11)#8,055 |
| 28. | Old Orchard Beach | 4.8% | 3.3%(+1.55)#28 | 3.1%(+1.77)#8,848 |
| 29. | Guilford | 4.8% | 3.3%(+1.52)#29 | 3.1%(+1.74)#8,943 |
| 30. | Lincoln | 4.7% | 3.3%(+1.42)#30 | 3.1%(+1.64)#9,180 |
| 31. | Dover Foxcroft | 4.7% | 3.3%(+1.40)#31 | 3.1%(+1.62)#9,219 |
| 32. | Lisbon Falls | 4.7% | 3.3%(+1.39)#32 | 3.1%(+1.61)#9,250 |
| 33. | Veazie | 4.6% | 3.3%(+1.36)#33 | 3.1%(+1.58)#9,344 |
| 34. | Gardiner | 4.6% | 3.3%(+1.33)#34 | 3.1%(+1.55)#9,417 |
| 35. | Oakfield | 4.5% | 3.3%(+1.17)#35 | 3.1%(+1.39)#9,868 |
| 36. | York Harbor | 4.4% | 3.3%(+1.13)#36 | 3.1%(+1.35)#9,961 |
| 37. | North Windham | 4.3% | 3.3%(+0.995)#37 | 3.1%(+1.22)#10,358 |
| 38. | Kingfield | 4.1% | 3.3%(+0.807)#38 | 3.1%(+1.03)#10,906 |
| 39. | Sanford | 4.0% | 3.3%(+0.671)#39 | 3.1%(+0.891)#11,306 |
| 40. | Madison | 4.0% | 3.3%(+0.670)#40 | 3.1%(+0.891)#11,308 |
| 41. | Calais | 3.8% | 3.3%(+0.526)#41 | 3.1%(+0.747)#11,787 |
| 42. | Alfred | 3.7% | 3.3%(+0.462)#42 | 3.1%(+0.682)#12,006 |
| 43. | Saco | 3.7% | 3.3%(+0.460)#43 | 3.1%(+0.681)#12,016 |
| 44. | Lisbon | 3.7% | 3.3%(+0.432)#44 | 3.1%(+0.653)#12,109 |
| 45. | Biddeford | 3.6% | 3.3%(+0.308)#45 | 3.1%(+0.529)#12,539 |
| 46. | Northeast Harbor | 3.5% | 3.3%(+0.233)#46 | 3.1%(+0.454)#12,790 |
| 47. | Howland | 3.5% | 3.3%(+0.229)#47 | 3.1%(+0.450)#12,803 |
| 48. | Milo | 3.5% | 3.3%(+0.221)#48 | 3.1%(+0.441)#12,828 |
| 49. | Cape Neddick | 3.5% | 3.3%(+0.203)#49 | 3.1%(+0.423)#12,893 |
| 50. | Fryeburg | 3.4% | 3.3%(+0.115)#50 | 3.1%(+0.336)#13,217 |
| 51. | Livermore Falls | 3.3% | 3.3%(+0.033)#51 | 3.1%(+0.253)#13,549 |
| 52. | Winslow | 3.3% | 3.3%(-0.018)#52 | 3.1%(+0.203)#13,718 |
| 53. | Bethel | 3.3% | 3.3%(-0.032)#53 | 3.1%(+0.188)#13,775 |
| 54. | South Berwick | 3.2% | 3.3%(-0.069)#54 | 3.1%(+0.152)#13,893 |
| 55. | Winthrop | 3.2% | 3.3%(-0.077)#55 | 3.1%(+0.143)#13,923 |
| 56. | Caribou | 3.2% | 3.3%(-0.114)#56 | 3.1%(+0.107)#14,073 |
| 57. | Thomaston | 3.1% | 3.3%(-0.207)#57 | 3.1%(+0.014)#14,420 |
| 58. | Kittery Point | 3.0% | 3.3%(-0.253)#58 | 3.1%(-0.032)#14,594 |
| 59. | Lubec | 3.0% | 3.3%(-0.258)#59 | 3.1%(-0.037)#14,618 |
| 60. | Brewer | 3.0% | 3.3%(-0.267)#60 | 3.1%(-0.046)#14,652 |
| 61. | Randolph | 3.0% | 3.3%(-0.318)#61 | 3.1%(-0.097)#14,855 |
| 62. | Waterville | 2.8% | 3.3%(-0.514)#62 | 3.1%(-0.294)#15,626 |
| 63. | Greene | 2.8% | 3.3%(-0.516)#63 | 3.1%(-0.296)#15,636 |
| 64. | Limestone | 2.7% | 3.3%(-0.552)#64 | 3.1%(-0.331)#15,779 |
| 65. | Auburn | 2.7% | 3.3%(-0.571)#65 | 3.1%(-0.350)#15,857 |
| 66. | Milbridge | 2.7% | 3.3%(-0.622)#66 | 3.1%(-0.401)#16,057 |
| 67. | Newport | 2.7% | 3.3%(-0.626)#67 | 3.1%(-0.405)#16,078 |
| 68. | Searsport | 2.7% | 3.3%(-0.627)#68 | 3.1%(-0.407)#16,087 |
| 69. | Westbrook | 2.6% | 3.3%(-0.645)#69 | 3.1%(-0.424)#16,158 |
| 70. | Hartland | 2.6% | 3.3%(-0.647)#70 | 3.1%(-0.426)#16,166 |
| 71. | Old Town | 2.5% | 3.3%(-0.743)#71 | 3.1%(-0.522)#16,588 |
| 72. | Fairfield | 2.5% | 3.3%(-0.748)#72 | 3.1%(-0.528)#16,618 |
| 73. | Kennebunk | 2.5% | 3.3%(-0.762)#73 | 3.1%(-0.541)#16,674 |
| 74. | Berwick | 2.4% | 3.3%(-0.937)#74 | 3.1%(-0.716)#17,404 |
| 75. | Milford | 2.3% | 3.3%(-0.951)#75 | 3.1%(-0.730)#17,467 |
| 76. | Rumford | 2.3% | 3.3%(-0.963)#76 | 3.1%(-0.742)#17,528 |
| 77. | Corinna | 2.3% | 3.3%(-0.981)#77 | 3.1%(-0.760)#17,600 |
| 78. | Hampden | 2.3% | 3.3%(-1.04)#78 | 3.1%(-0.815)#17,826 |
| 79. | Millinocket | 2.2% | 3.3%(-1.04)#79 | 3.1%(-0.819)#17,841 |
| 80. | Bangor | 2.2% | 3.3%(-1.11)#80 | 3.1%(-0.888)#18,096 |
| 81. | Augusta | 2.2% | 3.3%(-1.13)#81 | 3.1%(-0.913)#18,198 |
| 82. | Fort Kent | 1.9% | 3.3%(-1.34)#82 | 3.1%(-1.12)#18,985 |
| 83. | Mechanic Falls | 1.8% | 3.3%(-1.49)#83 | 3.1%(-1.27)#19,576 |
| 84. | Chisholm | 1.8% | 3.3%(-1.53)#84 | 3.1%(-1.31)#19,724 |
| 85. | Eastport | 1.8% | 3.3%(-1.54)#85 | 3.1%(-1.32)#19,756 |
| 86. | Skowhegan | 1.7% | 3.3%(-1.59)#86 | 3.1%(-1.37)#19,952 |
| 87. | Ellsworth | 1.7% | 3.3%(-1.59)#87 | 3.1%(-1.37)#19,956 |
| 88. | Jonesport | 1.7% | 3.3%(-1.60)#88 | 3.1%(-1.38)#19,993 |
| 89. | Oak Hill | 1.7% | 3.3%(-1.60)#89 | 3.1%(-1.38)#20,002 |
| 90. | Van Buren | 1.6% | 3.3%(-1.65)#90 | 3.1%(-1.43)#20,179 |
| 91. | Falmouth | 1.6% | 3.3%(-1.68)#91 | 3.1%(-1.46)#20,271 |
| 92. | Belfast | 1.5% | 3.3%(-1.80)#92 | 3.1%(-1.57)#20,656 |
| 93. | South Portland | 1.5% | 3.3%(-1.83)#93 | 3.1%(-1.61)#20,785 |
| 94. | Cumberland Center | 1.4% | 3.3%(-1.88)#94 | 3.1%(-1.66)#20,986 |
| 95. | Yarmouth | 1.3% | 3.3%(-2.02)#95 | 3.1%(-1.80)#21,419 |
| 96. | Orono | 1.3% | 3.3%(-2.03)#96 | 3.1%(-1.81)#21,453 |
| 97. | Lewiston | 1.3% | 3.3%(-2.03)#97 | 3.1%(-1.81)#21,455 |
| 98. | Bath | 1.2% | 3.3%(-2.04)#98 | 3.1%(-1.82)#21,500 |
| 99. | Dixfield | 1.2% | 3.3%(-2.09)#99 | 3.1%(-1.87)#21,631 |
| 100. | Machias | 1.2% | 3.3%(-2.13)#100 | 3.1%(-1.91)#21,782 |
1
2Common Questions
What are the Top 10 Cities with the Highest Percentage of Population Employed in Installation, Maintenance & Repair in Maine?
Top 10 Cities with the Highest Percentage of Population Employed in Installation, Maintenance & Repair in Maine are:
#1
13.3%
#2
10.1%
#3
9.5%
#4
9.2%
#5
9.0%
#6
8.5%
#7
8.3%
#8
7.6%
#9
7.3%
#10
7.1%
What city has the Highest Percentage of Population Employed in Installation, Maintenance & Repair in Maine?
Washburn has the Highest Percentage of Population Employed in Installation, Maintenance & Repair in Maine with 13.3%.
What is the Percentage of Population Employed in Installation, Maintenance & Repair in the State of Maine?
Percentage of Population Employed in Installation, Maintenance & Repair in Maine is 3.3%.
What is the Percentage of Population Employed in Installation, Maintenance & Repair in the United States?
Percentage of Population Employed in Installation, Maintenance & Repair in the United States is 3.1%.