Cities with the Highest Percentage of Guamanian / Chamorro Population in California
RELATED REPORTS & OPTIONS
Guamanian / Chamorro
California
Compare Cities
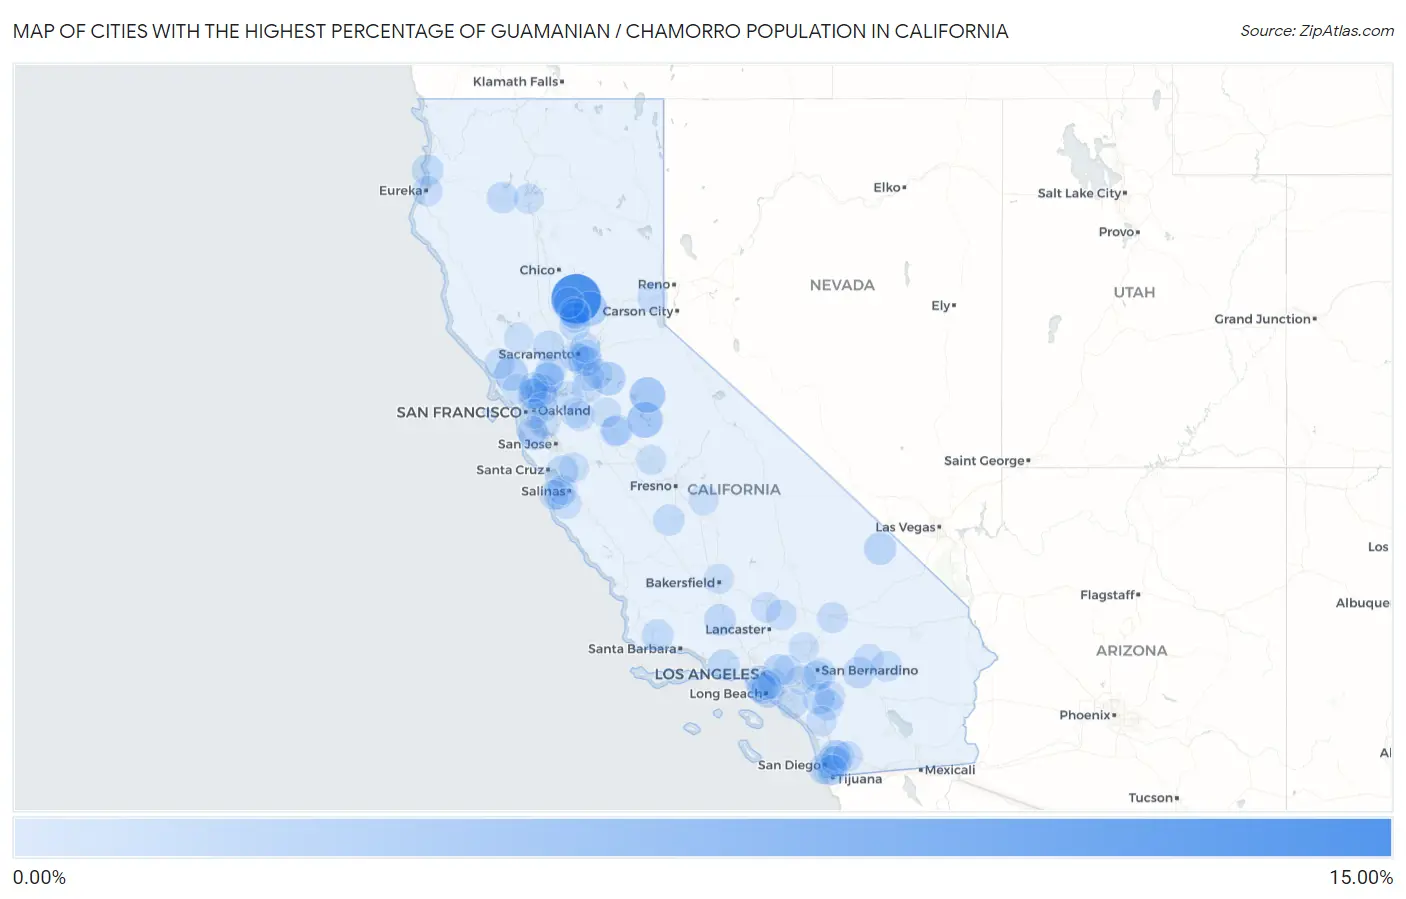
Map of Cities with the Highest Percentage of Guamanian / Chamorro Population in California
0.00%
15.00%
Cities with the Highest Percentage of Guamanian / Chamorro Population in California
| City | Guamanian / Chamorro | vs State | vs National | |
| 1. | Honcut | 12.46% | 0.12%(+12.3)#1 | 0.047%(+12.4)#3 |
| 2. | Jones Valley | 4.44% | 0.12%(+4.32)#2 | 0.047%(+4.39)#25 |
| 3. | Lake Don Pedro | 3.62% | 0.12%(+3.50)#3 | 0.047%(+3.57)#31 |
| 4. | Mono Vista | 3.56% | 0.12%(+3.45)#4 | 0.047%(+3.52)#32 |
| 5. | Smartsville | 2.90% | 0.12%(+2.79)#5 | 0.047%(+2.86)#49 |
| 6. | Penngrove | 2.43% | 0.12%(+2.31)#6 | 0.047%(+2.38)#64 |
| 7. | Camanche North Shore | 2.26% | 0.12%(+2.14)#7 | 0.047%(+2.21)#71 |
| 8. | Signal Hill | 1.94% | 0.12%(+1.82)#8 | 0.047%(+1.89)#84 |
| 9. | El Centro Naval Air Facility | 1.67% | 0.12%(+1.55)#9 | 0.047%(+1.62)#104 |
| 10. | Tecopa | 1.60% | 0.12%(+1.49)#10 | 0.047%(+1.56)#111 |
| 11. | Benicia | 1.55% | 0.12%(+1.43)#11 | 0.047%(+1.50)#117 |
| 12. | Green Valley Cdp Solano County | 1.45% | 0.12%(+1.33)#12 | 0.047%(+1.40)#126 |
| 13. | Lake Of The Woods | 1.37% | 0.12%(+1.26)#13 | 0.047%(+1.33)#131 |
| 14. | Morongo Valley | 1.30% | 0.12%(+1.18)#14 | 0.047%(+1.25)#138 |
| 15. | Amesti | 1.28% | 0.12%(+1.16)#15 | 0.047%(+1.23)#139 |
| 16. | Irwindale | 1.27% | 0.12%(+1.15)#16 | 0.047%(+1.22)#141 |
| 17. | Santa Ynez | 1.17% | 0.12%(+1.05)#17 | 0.047%(+1.12)#150 |
| 18. | Esparto | 1.14% | 0.12%(+1.02)#18 | 0.047%(+1.09)#155 |
| 19. | Trinidad | 1.11% | 0.12%(+0.997)#19 | 0.047%(+1.07)#160 |
| 20. | Fairfield | 1.11% | 0.12%(+0.990)#20 | 0.047%(+1.06)#161 |
| 21. | Loma Linda | 1.09% | 0.12%(+0.969)#21 | 0.047%(+1.04)#167 |
| 22. | Lewiston | 1.08% | 0.12%(+0.966)#22 | 0.047%(+1.04)#168 |
| 23. | Casa Conejo | 1.07% | 0.12%(+0.953)#23 | 0.047%(+1.02)#171 |
| 24. | Canyon Lake | 1.03% | 0.12%(+0.910)#24 | 0.047%(+0.980)#174 |
| 25. | Seaside | 1.01% | 0.12%(+0.890)#25 | 0.047%(+0.960)#185 |
| 26. | Lemoore Station | 1.00% | 0.12%(+0.883)#26 | 0.047%(+0.953)#189 |
| 27. | Rodeo | 0.99% | 0.12%(+0.869)#27 | 0.047%(+0.939)#192 |
| 28. | Westmont | 0.92% | 0.12%(+0.803)#28 | 0.047%(+0.873)#207 |
| 29. | Spring Valley Cdp San Diego County | 0.90% | 0.12%(+0.782)#29 | 0.047%(+0.852)#214 |
| 30. | Winter Gardens | 0.90% | 0.12%(+0.779)#30 | 0.047%(+0.849)#216 |
| 31. | Plumas Lake | 0.87% | 0.12%(+0.751)#31 | 0.047%(+0.821)#220 |
| 32. | La Mesa | 0.85% | 0.12%(+0.737)#32 | 0.047%(+0.807)#223 |
| 33. | National City | 0.85% | 0.12%(+0.730)#33 | 0.047%(+0.800)#225 |
| 34. | Coronado | 0.80% | 0.12%(+0.684)#34 | 0.047%(+0.754)#238 |
| 35. | Highgrove | 0.79% | 0.12%(+0.676)#35 | 0.047%(+0.746)#241 |
| 36. | Barstow | 0.79% | 0.12%(+0.672)#36 | 0.047%(+0.742)#242 |
| 37. | Suisun City | 0.75% | 0.12%(+0.633)#37 | 0.047%(+0.703)#255 |
| 38. | Old Stine | 0.75% | 0.12%(+0.631)#38 | 0.047%(+0.701)#258 |
| 39. | Denair | 0.75% | 0.12%(+0.630)#39 | 0.047%(+0.700)#259 |
| 40. | Twentynine Palms | 0.74% | 0.12%(+0.626)#40 | 0.047%(+0.696)#261 |
| 41. | Florin | 0.72% | 0.12%(+0.604)#41 | 0.047%(+0.674)#272 |
| 42. | Olivehurst | 0.67% | 0.12%(+0.550)#42 | 0.047%(+0.620)#295 |
| 43. | Graton | 0.66% | 0.12%(+0.542)#43 | 0.047%(+0.612)#301 |
| 44. | French Valley | 0.65% | 0.12%(+0.528)#44 | 0.047%(+0.598)#304 |
| 45. | Edwards Afb | 0.63% | 0.12%(+0.514)#45 | 0.047%(+0.585)#312 |
| 46. | Pinon Hills | 0.63% | 0.12%(+0.512)#46 | 0.047%(+0.582)#313 |
| 47. | Santee | 0.63% | 0.12%(+0.512)#47 | 0.047%(+0.582)#314 |
| 48. | Martinez | 0.60% | 0.12%(+0.485)#48 | 0.047%(+0.555)#325 |
| 49. | La Riviera | 0.59% | 0.12%(+0.476)#49 | 0.047%(+0.546)#331 |
| 50. | Laguna Woods | 0.59% | 0.12%(+0.474)#50 | 0.047%(+0.544)#332 |
| 51. | Truckee | 0.58% | 0.12%(+0.467)#51 | 0.047%(+0.537)#336 |
| 52. | Green Acres | 0.56% | 0.12%(+0.446)#52 | 0.047%(+0.516)#346 |
| 53. | Carson | 0.56% | 0.12%(+0.442)#53 | 0.047%(+0.512)#350 |
| 54. | Eureka | 0.52% | 0.12%(+0.408)#54 | 0.047%(+0.478)#368 |
| 55. | Emerald Lake Hills | 0.52% | 0.12%(+0.403)#55 | 0.047%(+0.473)#369 |
| 56. | Fallbrook | 0.52% | 0.12%(+0.403)#56 | 0.047%(+0.473)#371 |
| 57. | Casa De Oro Mount Helix | 0.52% | 0.12%(+0.402)#57 | 0.047%(+0.472)#372 |
| 58. | Carmel Valley Village | 0.52% | 0.12%(+0.400)#58 | 0.047%(+0.470)#374 |
| 59. | Marysville | 0.50% | 0.12%(+0.388)#59 | 0.047%(+0.458)#381 |
| 60. | Turlock | 0.50% | 0.12%(+0.379)#60 | 0.047%(+0.449)#385 |
| 61. | Mojave | 0.49% | 0.12%(+0.375)#61 | 0.047%(+0.445)#388 |
| 62. | Linda | 0.48% | 0.12%(+0.365)#62 | 0.047%(+0.435)#396 |
| 63. | Vacaville | 0.48% | 0.12%(+0.363)#63 | 0.047%(+0.433)#400 |
| 64. | Lodi | 0.47% | 0.12%(+0.351)#64 | 0.047%(+0.421)#407 |
| 65. | Alpine | 0.47% | 0.12%(+0.349)#65 | 0.047%(+0.419)#412 |
| 66. | Norwalk | 0.46% | 0.12%(+0.346)#66 | 0.047%(+0.416)#417 |
| 67. | Chowchilla | 0.44% | 0.12%(+0.326)#67 | 0.047%(+0.396)#430 |
| 68. | Galt | 0.44% | 0.12%(+0.321)#68 | 0.047%(+0.391)#431 |
| 69. | Camp Pendleton Mainside | 0.44% | 0.12%(+0.321)#69 | 0.047%(+0.391)#432 |
| 70. | Live Oak | 0.43% | 0.12%(+0.317)#70 | 0.047%(+0.387)#435 |
| 71. | Lemon Hill | 0.40% | 0.12%(+0.288)#71 | 0.047%(+0.358)#452 |
| 72. | Hercules | 0.40% | 0.12%(+0.287)#72 | 0.047%(+0.357)#455 |
| 73. | Phelan | 0.40% | 0.12%(+0.283)#73 | 0.047%(+0.353)#458 |
| 74. | Moraga | 0.40% | 0.12%(+0.281)#74 | 0.047%(+0.351)#459 |
| 75. | West Sacramento | 0.39% | 0.12%(+0.269)#75 | 0.047%(+0.339)#474 |
| 76. | Chula Vista | 0.38% | 0.12%(+0.267)#76 | 0.047%(+0.337)#476 |
| 77. | Novato | 0.38% | 0.12%(+0.266)#77 | 0.047%(+0.336)#478 |
| 78. | Hayward | 0.38% | 0.12%(+0.262)#78 | 0.047%(+0.332)#481 |
| 79. | Oakley | 0.38% | 0.12%(+0.260)#79 | 0.047%(+0.330)#483 |
| 80. | Shasta Lake | 0.38% | 0.12%(+0.260)#80 | 0.047%(+0.330)#484 |
| 81. | Vallejo | 0.37% | 0.12%(+0.257)#81 | 0.047%(+0.327)#487 |
| 82. | Vineyard | 0.37% | 0.12%(+0.254)#82 | 0.047%(+0.324)#494 |
| 83. | Mountain House | 0.36% | 0.12%(+0.248)#83 | 0.047%(+0.318)#499 |
| 84. | Clay | 0.36% | 0.12%(+0.240)#84 | 0.047%(+0.310)#505 |
| 85. | Marina | 0.35% | 0.12%(+0.234)#85 | 0.047%(+0.304)#509 |
| 86. | Gilroy | 0.34% | 0.12%(+0.228)#86 | 0.047%(+0.298)#513 |
| 87. | Oildale | 0.34% | 0.12%(+0.223)#87 | 0.047%(+0.293)#518 |
| 88. | El Sobrante Cdp Contra Costa County | 0.34% | 0.12%(+0.219)#88 | 0.047%(+0.289)#522 |
| 89. | Eastvale | 0.33% | 0.12%(+0.215)#89 | 0.047%(+0.285)#524 |
| 90. | San Dimas | 0.33% | 0.12%(+0.214)#90 | 0.047%(+0.284)#525 |
| 91. | Orosi | 0.33% | 0.12%(+0.213)#91 | 0.047%(+0.283)#526 |
| 92. | North Highlands | 0.33% | 0.12%(+0.212)#92 | 0.047%(+0.282)#528 |
| 93. | Hidden Valley Lake | 0.32% | 0.12%(+0.208)#93 | 0.047%(+0.278)#531 |
| 94. | Escalon | 0.32% | 0.12%(+0.205)#94 | 0.047%(+0.275)#537 |
| 95. | East Rancho Dominguez | 0.32% | 0.12%(+0.205)#95 | 0.047%(+0.275)#538 |
| 96. | Homestead Valley | 0.31% | 0.12%(+0.198)#96 | 0.047%(+0.268)#548 |
| 97. | Alameda | 0.31% | 0.12%(+0.197)#97 | 0.047%(+0.267)#550 |
| 98. | Pacific Grove | 0.31% | 0.12%(+0.195)#98 | 0.047%(+0.265)#552 |
| 99. | Tracy | 0.31% | 0.12%(+0.194)#99 | 0.047%(+0.264)#553 |
| 100. | Belmont | 0.31% | 0.12%(+0.193)#100 | 0.047%(+0.263)#554 |
Common Questions
What are the Top 10 Cities with the Highest Percentage of Guamanian / Chamorro Population in California?
Top 10 Cities with the Highest Percentage of Guamanian / Chamorro Population in California are:
#1
12.46%
#2
3.62%
#3
3.56%
#4
2.90%
#5
2.43%
#6
2.26%
#7
1.94%
#8
1.60%
#9
1.55%
#10
1.37%
What city has the Highest Percentage of Guamanian / Chamorro Population in California?
Honcut has the Highest Percentage of Guamanian / Chamorro Population in California with 12.46%.
What is the Percentage of Guamanian / Chamorro Population in the State of California?
Percentage of Guamanian / Chamorro Population in California is 0.12%.
What is the Percentage of Guamanian / Chamorro Population in the United States?
Percentage of Guamanian / Chamorro Population in the United States is 0.047%.