Cities with the Highest Percentage of Danish Population in California
RELATED REPORTS & OPTIONS
Danish
California
Compare Cities
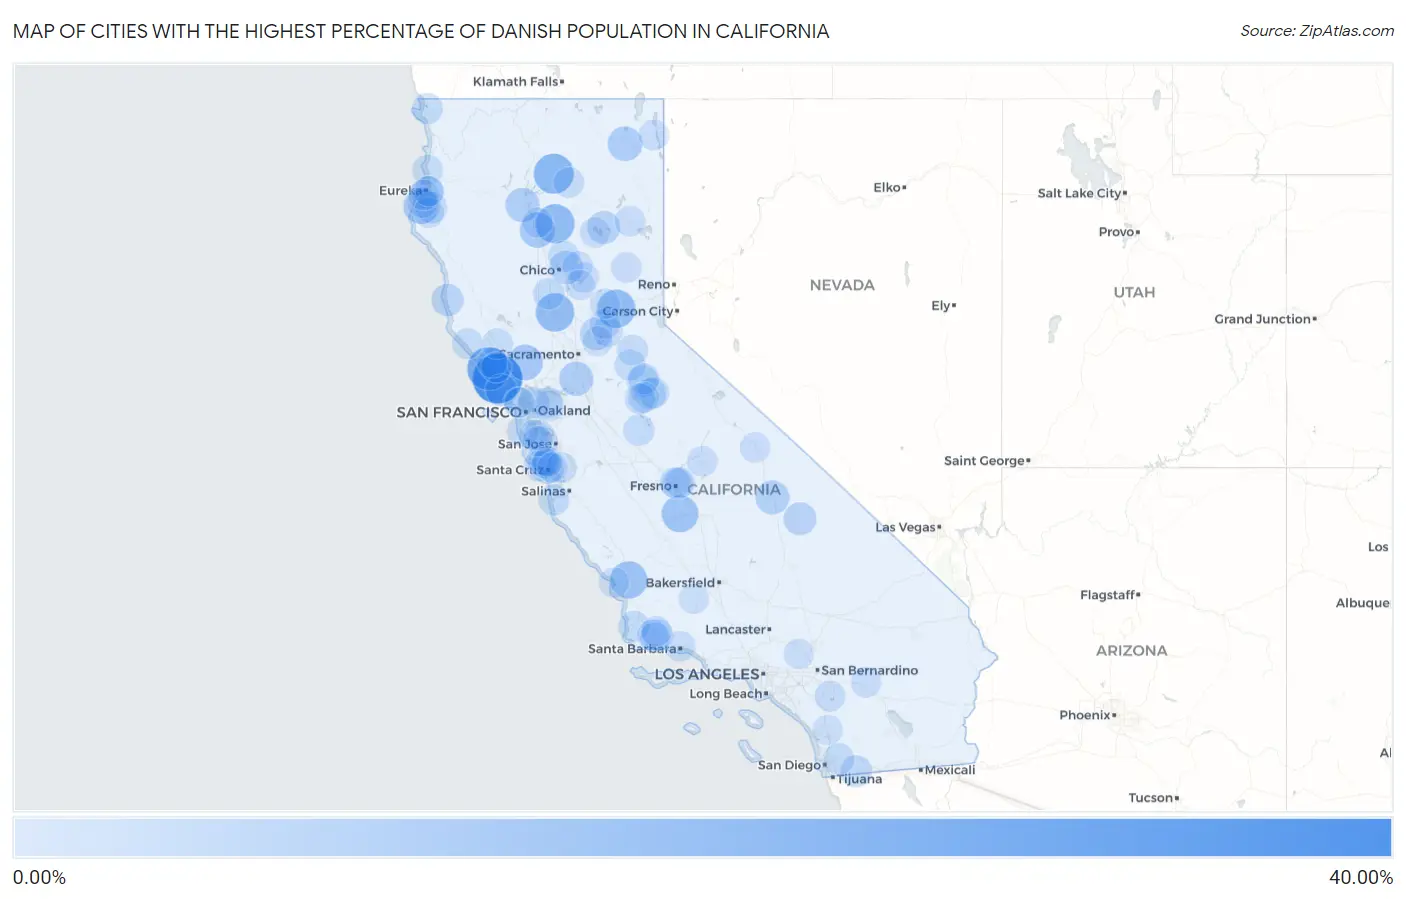
Map of Cities with the Highest Percentage of Danish Population in California
0.00%
40.00%
Cities with the Highest Percentage of Danish Population in California
| City | Danish | vs State | vs National | |
| 1. | Tomales | 39.33% | 0.37%(+39.0)#1 | 0.36%(+39.0)#15 |
| 2. | Sereno Del Mar | 26.53% | 0.37%(+26.2)#2 | 0.36%(+26.2)#35 |
| 3. | Big Bend | 20.45% | 0.37%(+20.1)#3 | 0.36%(+20.1)#51 |
| 4. | Paynes Creek | 18.92% | 0.37%(+18.6)#4 | 0.36%(+18.6)#65 |
| 5. | Meridian | 17.55% | 0.37%(+17.2)#5 | 0.36%(+17.2)#81 |
| 6. | Dutch Flat | 17.31% | 0.37%(+16.9)#6 | 0.36%(+17.0)#85 |
| 7. | Garden Farms | 15.14% | 0.37%(+14.8)#7 | 0.36%(+14.8)#108 |
| 8. | Grangeville | 14.34% | 0.37%(+14.0)#8 | 0.36%(+14.0)#119 |
| 9. | Rutherford | 12.17% | 0.37%(+11.8)#9 | 0.36%(+11.8)#151 |
| 10. | Ferndale | 11.92% | 0.37%(+11.6)#10 | 0.36%(+11.6)#157 |
| 11. | Bend | 11.84% | 0.37%(+11.5)#11 | 0.36%(+11.5)#160 |
| 12. | California Pines | 10.29% | 0.37%(+9.93)#12 | 0.36%(+9.94)#195 |
| 13. | Walnut Grove | 9.34% | 0.37%(+8.97)#13 | 0.36%(+8.98)#216 |
| 14. | Shasta | 9.30% | 0.37%(+8.94)#14 | 0.36%(+8.95)#217 |
| 15. | Lone Pine | 8.92% | 0.37%(+8.55)#15 | 0.36%(+8.56)#233 |
| 16. | La Grange | 8.39% | 0.37%(+8.02)#16 | 0.36%(+8.03)#255 |
| 17. | Butte Creek Canyon | 7.83% | 0.37%(+7.46)#17 | 0.36%(+7.47)#289 |
| 18. | Clear Creek | 7.17% | 0.37%(+6.80)#18 | 0.36%(+6.81)#324 |
| 19. | Darwin | 6.98% | 0.37%(+6.61)#19 | 0.36%(+6.62)#346 |
| 20. | Penryn | 6.74% | 0.37%(+6.38)#20 | 0.36%(+6.39)#369 |
| 21. | Cutten | 6.17% | 0.37%(+5.80)#21 | 0.36%(+5.81)#416 |
| 22. | Mendocino | 6.02% | 0.37%(+5.65)#22 | 0.36%(+5.66)#431 |
| 23. | Pasatiempo | 5.93% | 0.37%(+5.57)#23 | 0.36%(+5.58)#440 |
| 24. | Inverness | 4.97% | 0.37%(+4.60)#24 | 0.36%(+4.61)#572 |
| 25. | Potrero | 4.91% | 0.37%(+4.54)#25 | 0.36%(+4.55)#581 |
| 26. | Avery | 4.74% | 0.37%(+4.37)#26 | 0.36%(+4.38)#613 |
| 27. | Hydesville | 4.72% | 0.37%(+4.35)#27 | 0.36%(+4.36)#620 |
| 28. | Brookdale | 4.61% | 0.37%(+4.24)#28 | 0.36%(+4.25)#633 |
| 29. | Twain Harte | 4.41% | 0.37%(+4.04)#29 | 0.36%(+4.05)#668 |
| 30. | Princeton | 4.20% | 0.37%(+3.83)#30 | 0.36%(+3.84)#718 |
| 31. | Granite Hills | 4.09% | 0.37%(+3.72)#31 | 0.36%(+3.73)#753 |
| 32. | Snelling | 3.93% | 0.37%(+3.57)#32 | 0.36%(+3.58)#794 |
| 33. | Santa Ynez | 3.90% | 0.37%(+3.53)#33 | 0.36%(+3.54)#810 |
| 34. | El Granada | 3.86% | 0.37%(+3.49)#34 | 0.36%(+3.50)#822 |
| 35. | Cohasset | 3.83% | 0.37%(+3.46)#35 | 0.36%(+3.47)#828 |
| 36. | Carmel By The Sea | 3.80% | 0.37%(+3.43)#36 | 0.36%(+3.44)#838 |
| 37. | Kensington | 3.79% | 0.37%(+3.42)#37 | 0.36%(+3.43)#844 |
| 38. | Pioneer | 3.78% | 0.37%(+3.42)#38 | 0.36%(+3.42)#847 |
| 39. | Vandenberg Afb | 3.69% | 0.37%(+3.33)#39 | 0.36%(+3.34)#874 |
| 40. | Mayfair | 3.67% | 0.37%(+3.30)#40 | 0.36%(+3.31)#888 |
| 41. | Mi Wuk Village | 3.66% | 0.37%(+3.30)#41 | 0.36%(+3.31)#889 |
| 42. | Fort Dick | 3.63% | 0.37%(+3.26)#42 | 0.36%(+3.27)#898 |
| 43. | Arnold | 3.59% | 0.37%(+3.22)#43 | 0.36%(+3.23)#907 |
| 44. | Grizzly Flats | 3.42% | 0.37%(+3.05)#44 | 0.36%(+3.06)#960 |
| 45. | Ridgecrest Heights | 3.41% | 0.37%(+3.04)#45 | 0.36%(+3.05)#964 |
| 46. | Sea Ranch | 3.35% | 0.37%(+2.98)#46 | 0.36%(+2.99)#981 |
| 47. | Davenport | 3.23% | 0.37%(+2.86)#47 | 0.36%(+2.87)#1,030 |
| 48. | Geyserville | 3.23% | 0.37%(+2.86)#48 | 0.36%(+2.87)#1,032 |
| 49. | Fort Hunter Liggett | 3.20% | 0.37%(+2.84)#49 | 0.36%(+2.85)#1,044 |
| 50. | Auburn Lake Trails | 3.04% | 0.37%(+2.68)#50 | 0.36%(+2.68)#1,114 |
| 51. | Loleta | 3.01% | 0.37%(+2.64)#51 | 0.36%(+2.65)#1,127 |
| 52. | Green Valley Cdp Los Angeles County | 3.00% | 0.37%(+2.64)#52 | 0.36%(+2.65)#1,129 |
| 53. | Buellton | 2.99% | 0.37%(+2.62)#53 | 0.36%(+2.63)#1,136 |
| 54. | East Sonora | 2.93% | 0.37%(+2.56)#54 | 0.36%(+2.57)#1,157 |
| 55. | Jamestown | 2.91% | 0.37%(+2.55)#55 | 0.36%(+2.56)#1,166 |
| 56. | Trinidad | 2.90% | 0.37%(+2.53)#56 | 0.36%(+2.54)#1,171 |
| 57. | Old Fig Garden | 2.89% | 0.37%(+2.52)#57 | 0.36%(+2.53)#1,173 |
| 58. | Burney | 2.89% | 0.37%(+2.52)#58 | 0.36%(+2.53)#1,175 |
| 59. | Mission Canyon | 2.88% | 0.37%(+2.51)#59 | 0.36%(+2.52)#1,180 |
| 60. | Winchester | 2.88% | 0.37%(+2.51)#60 | 0.36%(+2.52)#1,181 |
| 61. | Alamo | 2.85% | 0.37%(+2.48)#61 | 0.36%(+2.49)#1,194 |
| 62. | Solvang | 2.80% | 0.37%(+2.43)#62 | 0.36%(+2.44)#1,221 |
| 63. | Berry Creek | 2.78% | 0.37%(+2.42)#63 | 0.36%(+2.43)#1,230 |
| 64. | Los Altos Hills | 2.76% | 0.37%(+2.39)#64 | 0.36%(+2.40)#1,245 |
| 65. | Johnstonville | 2.75% | 0.37%(+2.39)#65 | 0.36%(+2.40)#1,249 |
| 66. | Tarpey Village | 2.72% | 0.37%(+2.36)#66 | 0.36%(+2.37)#1,262 |
| 67. | Desert Edge | 2.64% | 0.37%(+2.27)#67 | 0.36%(+2.28)#1,304 |
| 68. | Shaver Lake | 2.61% | 0.37%(+2.25)#68 | 0.36%(+2.26)#1,320 |
| 69. | Shell Ridge | 2.59% | 0.37%(+2.23)#69 | 0.36%(+2.24)#1,332 |
| 70. | Meadow Vista | 2.59% | 0.37%(+2.22)#70 | 0.36%(+2.23)#1,334 |
| 71. | Bayview Cdp Humboldt County | 2.57% | 0.37%(+2.21)#71 | 0.36%(+2.22)#1,340 |
| 72. | Cedarville | 2.55% | 0.37%(+2.19)#72 | 0.36%(+2.20)#1,350 |
| 73. | Corralitos | 2.55% | 0.37%(+2.19)#73 | 0.36%(+2.20)#1,351 |
| 74. | Graeagle | 2.49% | 0.37%(+2.13)#74 | 0.36%(+2.14)#1,386 |
| 75. | Lake Almanor West | 2.48% | 0.37%(+2.12)#75 | 0.36%(+2.13)#1,392 |
| 76. | Concow | 2.46% | 0.37%(+2.09)#76 | 0.36%(+2.10)#1,404 |
| 77. | Ben Lomond | 2.46% | 0.37%(+2.09)#77 | 0.36%(+2.10)#1,407 |
| 78. | Los Olivos | 2.45% | 0.37%(+2.08)#78 | 0.36%(+2.09)#1,411 |
| 79. | Lake California | 2.45% | 0.37%(+2.08)#79 | 0.36%(+2.09)#1,417 |
| 80. | Rio Dell | 2.39% | 0.37%(+2.03)#80 | 0.36%(+2.03)#1,458 |
| 81. | Fields Landing | 2.38% | 0.37%(+2.02)#81 | 0.36%(+2.03)#1,463 |
| 82. | Wilkerson | 2.37% | 0.37%(+2.01)#82 | 0.36%(+2.02)#1,476 |
| 83. | Nevada City | 2.36% | 0.37%(+1.99)#83 | 0.36%(+2.00)#1,487 |
| 84. | Kelly Ridge | 2.34% | 0.37%(+1.97)#84 | 0.36%(+1.98)#1,502 |
| 85. | Atherton | 2.30% | 0.37%(+1.94)#85 | 0.36%(+1.94)#1,528 |
| 86. | Monte Rio | 2.20% | 0.37%(+1.84)#86 | 0.36%(+1.85)#1,589 |
| 87. | Hidden Meadows | 2.19% | 0.37%(+1.82)#87 | 0.36%(+1.83)#1,598 |
| 88. | Emerald Lake Hills | 2.17% | 0.37%(+1.80)#88 | 0.36%(+1.81)#1,614 |
| 89. | Portola Valley | 2.16% | 0.37%(+1.79)#89 | 0.36%(+1.80)#1,624 |
| 90. | Myrtletown | 2.14% | 0.37%(+1.78)#90 | 0.36%(+1.79)#1,634 |
| 91. | Alto | 2.12% | 0.37%(+1.76)#91 | 0.36%(+1.77)#1,654 |
| 92. | Occidental | 2.07% | 0.37%(+1.71)#92 | 0.36%(+1.72)#1,697 |
| 93. | Morro Bay | 2.07% | 0.37%(+1.70)#93 | 0.36%(+1.71)#1,700 |
| 94. | Mount Hermon | 2.04% | 0.37%(+1.68)#94 | 0.36%(+1.69)#1,724 |
| 95. | Wrightwood | 2.04% | 0.37%(+1.67)#95 | 0.36%(+1.68)#1,731 |
| 96. | Zayante | 2.00% | 0.37%(+1.63)#96 | 0.36%(+1.64)#1,776 |
| 97. | Granite Bay | 1.98% | 0.37%(+1.61)#97 | 0.36%(+1.62)#1,788 |
| 98. | Mill Valley | 1.96% | 0.37%(+1.59)#98 | 0.36%(+1.60)#1,807 |
| 99. | Soquel | 1.94% | 0.37%(+1.58)#99 | 0.36%(+1.58)#1,821 |
| 100. | South Taft | 1.94% | 0.37%(+1.57)#100 | 0.36%(+1.58)#1,824 |
Common Questions
What are the Top 10 Cities with the Highest Percentage of Danish Population in California?
Top 10 Cities with the Highest Percentage of Danish Population in California are:
#1
39.33%
#2
26.53%
#3
20.45%
#4
18.92%
#5
17.55%
#6
17.31%
#7
15.14%
#8
14.34%
#9
12.17%
#10
11.92%
What city has the Highest Percentage of Danish Population in California?
Tomales has the Highest Percentage of Danish Population in California with 39.33%.
What is the Percentage of Danish Population in the State of California?
Percentage of Danish Population in California is 0.37%.
What is the Percentage of Danish Population in the United States?
Percentage of Danish Population in the United States is 0.36%.