Cities with the Highest Poverty Level Among Families in California
RELATED REPORTS & OPTIONS
Highest Family Poverty
California
Compare Cities
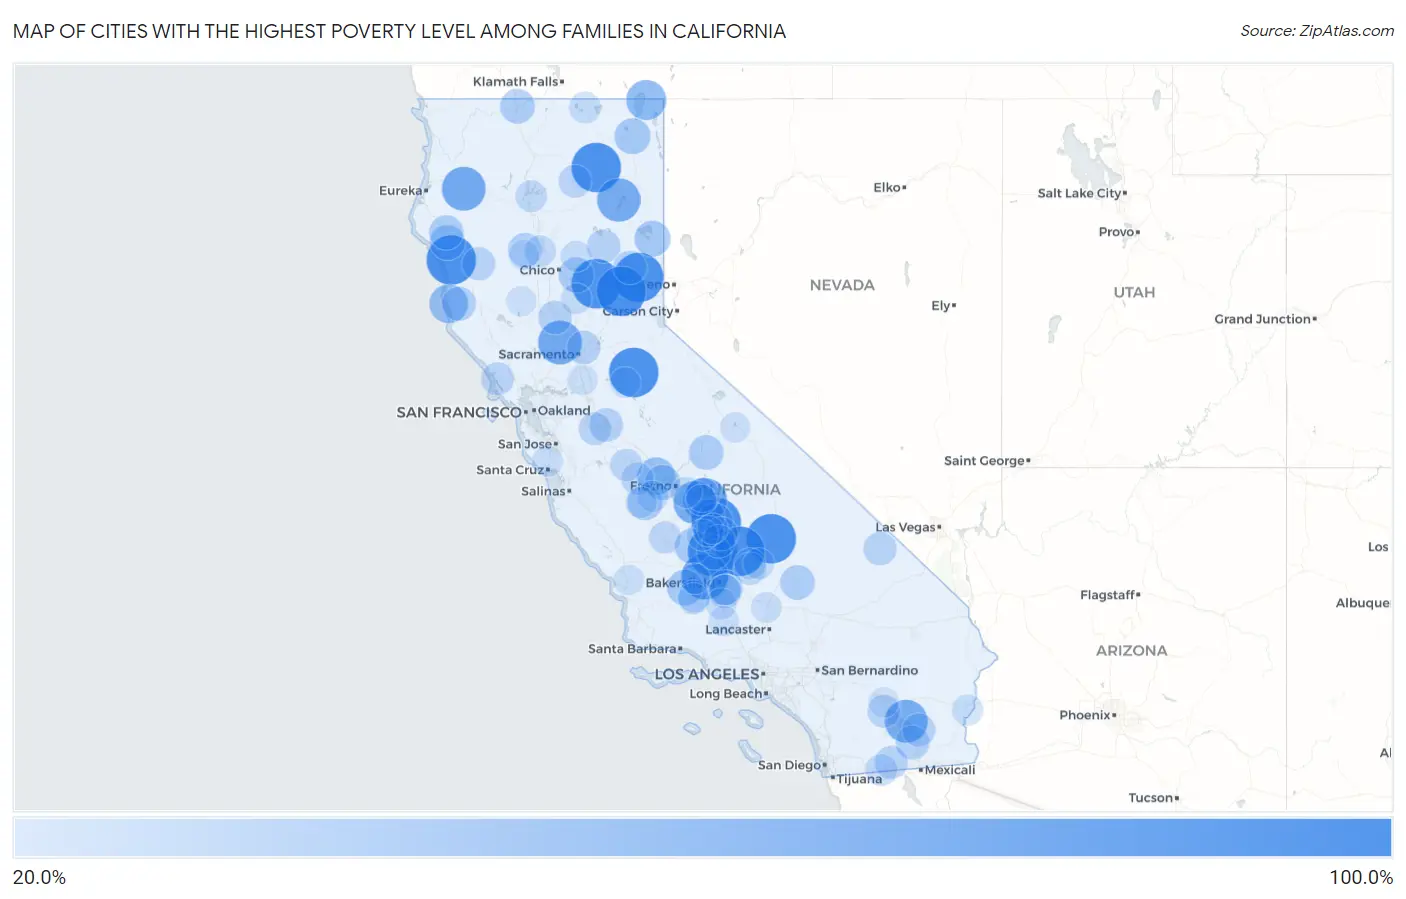
Map of Cities with the Highest Poverty Level Among Families in California
0.0%
100.0%
Cities with the Highest Poverty Level Among Families in California
| City | Family Poverty | vs State | vs National | |
| 1. | Clipper Mills | 100.0% | 8.5%(+91.5)#1 | 8.8%(+91.2)#11 |
| 2. | Kennedy Meadows | 100.0% | 8.5%(+91.5)#2 | 8.8%(+91.2)#54 |
| 3. | Dales | 100.0% | 8.5%(+91.5)#3 | 8.8%(+91.2)#59 |
| 4. | Rail Road Flat | 100.0% | 8.5%(+91.5)#4 | 8.8%(+91.2)#60 |
| 5. | El Rancho | 100.0% | 8.5%(+91.5)#5 | 8.8%(+91.2)#71 |
| 6. | Rodriguez Camp | 100.0% | 8.5%(+91.5)#6 | 8.8%(+91.2)#81 |
| 7. | Leggett | 100.0% | 8.5%(+91.5)#7 | 8.8%(+91.2)#86 |
| 8. | Nubieber | 100.0% | 8.5%(+91.5)#8 | 8.8%(+91.2)#91 |
| 9. | Sattley | 100.0% | 8.5%(+91.5)#9 | 8.8%(+91.2)#108 |
| 10. | Mcclenney Tract | 100.0% | 8.5%(+91.5)#10 | 8.8%(+91.2)#113 |
| 11. | Graniteville | 100.0% | 8.5%(+91.5)#11 | 8.8%(+91.2)#117 |
| 12. | Cherokee Strip | 88.6% | 8.5%(+80.1)#12 | 8.8%(+79.9)#138 |
| 13. | East Orosi | 80.0% | 8.5%(+71.5)#13 | 8.8%(+71.2)#167 |
| 14. | Burnt Ranch | 78.8% | 8.5%(+70.3)#14 | 8.8%(+70.0)#176 |
| 15. | Yolo | 78.6% | 8.5%(+70.0)#15 | 8.8%(+69.8)#177 |
| 16. | Spaulding | 77.1% | 8.5%(+68.5)#16 | 8.8%(+68.3)#185 |
| 17. | Bombay Beach | 75.9% | 8.5%(+67.4)#17 | 8.8%(+67.1)#192 |
| 18. | Delft Colony | 75.6% | 8.5%(+67.1)#18 | 8.8%(+66.8)#197 |
| 19. | New Pine Creek | 64.7% | 8.5%(+56.2)#19 | 8.8%(+55.9)#303 |
| 20. | Oak Run | 64.6% | 8.5%(+56.1)#20 | 8.8%(+55.8)#308 |
| 21. | Weitchpec | 63.6% | 8.5%(+55.1)#21 | 8.8%(+54.9)#332 |
| 22. | La Grange | 60.7% | 8.5%(+52.2)#22 | 8.8%(+51.9)#374 |
| 23. | Little River | 60.3% | 8.5%(+51.8)#23 | 8.8%(+51.6)#377 |
| 24. | Wautec | 60.0% | 8.5%(+51.5)#24 | 8.8%(+51.2)#385 |
| 25. | La Vina | 56.7% | 8.5%(+48.2)#25 | 8.8%(+47.9)#455 |
| 26. | Patton Village | 50.3% | 8.5%(+41.8)#26 | 8.8%(+41.5)#634 |
| 27. | Daphnedale Park | 50.0% | 8.5%(+41.5)#27 | 8.8%(+41.2)#648 |
| 28. | Mckittrick | 50.0% | 8.5%(+41.5)#28 | 8.8%(+41.2)#659 |
| 29. | Tonyville | 49.2% | 8.5%(+40.7)#29 | 8.8%(+40.4)#705 |
| 30. | Alpaugh | 48.5% | 8.5%(+40.0)#30 | 8.8%(+39.7)#725 |
| 31. | Biola | 48.0% | 8.5%(+39.5)#31 | 8.8%(+39.2)#749 |
| 32. | Garberville | 47.9% | 8.5%(+39.4)#32 | 8.8%(+39.1)#754 |
| 33. | Cantua Creek | 47.8% | 8.5%(+39.3)#33 | 8.8%(+39.0)#758 |
| 34. | Cherokee | 47.7% | 8.5%(+39.2)#34 | 8.8%(+38.9)#766 |
| 35. | Fuller Acres | 46.7% | 8.5%(+38.1)#35 | 8.8%(+37.9)#806 |
| 36. | Hornbrook | 46.1% | 8.5%(+37.5)#36 | 8.8%(+37.3)#829 |
| 37. | Big Creek | 45.8% | 8.5%(+37.3)#37 | 8.8%(+37.1)#837 |
| 38. | Miranda | 45.5% | 8.5%(+36.9)#38 | 8.8%(+36.7)#847 |
| 39. | Johannesburg | 45.5% | 8.5%(+36.9)#39 | 8.8%(+36.7)#853 |
| 40. | Richgrove | 44.6% | 8.5%(+36.1)#40 | 8.8%(+35.8)#892 |
| 41. | Linnell Camp | 43.9% | 8.5%(+35.4)#41 | 8.8%(+35.2)#930 |
| 42. | Orange Cove | 43.6% | 8.5%(+35.1)#42 | 8.8%(+34.9)#948 |
| 43. | Rancho Tehama Reserve | 43.6% | 8.5%(+35.1)#43 | 8.8%(+34.8)#951 |
| 44. | Comptche | 43.5% | 8.5%(+34.9)#44 | 8.8%(+34.7)#960 |
| 45. | Westmorland | 43.3% | 8.5%(+34.8)#45 | 8.8%(+34.5)#975 |
| 46. | Grimes | 42.0% | 8.5%(+33.4)#46 | 8.8%(+33.2)#1,055 |
| 47. | Weedpatch | 41.8% | 8.5%(+33.3)#47 | 8.8%(+33.0)#1,066 |
| 48. | Bret Harte | 41.8% | 8.5%(+33.3)#48 | 8.8%(+33.0)#1,067 |
| 49. | East Porterville | 41.4% | 8.5%(+32.9)#49 | 8.8%(+32.7)#1,103 |
| 50. | Twain | 41.3% | 8.5%(+32.8)#50 | 8.8%(+32.5)#1,113 |
| 51. | Clio | 41.2% | 8.5%(+32.6)#51 | 8.8%(+32.4)#1,126 |
| 52. | Mcclellan Park | 41.1% | 8.5%(+32.6)#52 | 8.8%(+32.3)#1,134 |
| 53. | Covelo | 41.0% | 8.5%(+32.4)#53 | 8.8%(+32.2)#1,144 |
| 54. | Tecopa | 40.4% | 8.5%(+31.9)#54 | 8.8%(+31.6)#1,181 |
| 55. | East Bakersfield | 40.4% | 8.5%(+31.8)#55 | 8.8%(+31.6)#1,183 |
| 56. | Niland | 40.3% | 8.5%(+31.7)#56 | 8.8%(+31.5)#1,186 |
| 57. | Ocotillo | 40.3% | 8.5%(+31.7)#57 | 8.8%(+31.5)#1,187 |
| 58. | Terra Bella | 39.7% | 8.5%(+31.2)#58 | 8.8%(+30.9)#1,232 |
| 59. | Tomales | 39.6% | 8.5%(+31.1)#59 | 8.8%(+30.8)#1,236 |
| 60. | Cassel | 39.2% | 8.5%(+30.7)#60 | 8.8%(+30.4)#1,271 |
| 61. | Oasis | 39.0% | 8.5%(+30.4)#61 | 8.8%(+30.2)#1,293 |
| 62. | Westley | 38.9% | 8.5%(+30.3)#62 | 8.8%(+30.1)#1,300 |
| 63. | Edison | 38.1% | 8.5%(+29.6)#63 | 8.8%(+29.3)#1,343 |
| 64. | Firebaugh | 37.8% | 8.5%(+29.2)#64 | 8.8%(+29.0)#1,367 |
| 65. | Bodfish | 37.5% | 8.5%(+28.9)#65 | 8.8%(+28.7)#1,392 |
| 66. | Dos Palos Y | 37.3% | 8.5%(+28.8)#66 | 8.8%(+28.5)#1,406 |
| 67. | Kettleman City | 36.8% | 8.5%(+28.2)#67 | 8.8%(+28.0)#1,447 |
| 68. | Ford City | 36.3% | 8.5%(+27.7)#68 | 8.8%(+27.5)#1,489 |
| 69. | Jacumba | 36.2% | 8.5%(+27.6)#69 | 8.8%(+27.4)#1,494 |
| 70. | Mountain Gate | 35.3% | 8.5%(+26.8)#70 | 8.8%(+26.5)#1,574 |
| 71. | Richfield | 35.3% | 8.5%(+26.8)#71 | 8.8%(+26.5)#1,582 |
| 72. | Newell | 35.1% | 8.5%(+26.5)#72 | 8.8%(+26.3)#1,601 |
| 73. | South Taft | 34.5% | 8.5%(+26.0)#73 | 8.8%(+25.8)#1,651 |
| 74. | Tipton | 34.4% | 8.5%(+25.9)#74 | 8.8%(+25.7)#1,663 |
| 75. | Casa Loma | 34.0% | 8.5%(+25.4)#75 | 8.8%(+25.2)#1,717 |
| 76. | Lake Isabella | 33.8% | 8.5%(+25.2)#76 | 8.8%(+25.0)#1,741 |
| 77. | Del Rey | 33.6% | 8.5%(+25.1)#77 | 8.8%(+24.8)#1,754 |
| 78. | Weldon | 33.6% | 8.5%(+25.0)#78 | 8.8%(+24.8)#1,755 |
| 79. | Ripley | 33.5% | 8.5%(+25.0)#79 | 8.8%(+24.8)#1,756 |
| 80. | San Joaquin | 33.5% | 8.5%(+25.0)#80 | 8.8%(+24.7)#1,757 |
| 81. | Three Rocks | 33.3% | 8.5%(+24.8)#81 | 8.8%(+24.6)#1,792 |
| 82. | Stirling City | 33.1% | 8.5%(+24.6)#82 | 8.8%(+24.3)#1,844 |
| 83. | Mettler | 32.4% | 8.5%(+23.8)#83 | 8.8%(+23.6)#1,901 |
| 84. | Zayante | 32.3% | 8.5%(+23.8)#84 | 8.8%(+23.5)#1,903 |
| 85. | Honcut | 32.3% | 8.5%(+23.8)#85 | 8.8%(+23.5)#1,904 |
| 86. | Lamont | 32.3% | 8.5%(+23.7)#86 | 8.8%(+23.5)#1,909 |
| 87. | Buttonwillow | 32.2% | 8.5%(+23.7)#87 | 8.8%(+23.5)#1,911 |
| 88. | Mojave | 31.8% | 8.5%(+23.3)#88 | 8.8%(+23.1)#1,950 |
| 89. | San Andreas | 31.7% | 8.5%(+23.2)#89 | 8.8%(+22.9)#1,972 |
| 90. | Sultana | 31.4% | 8.5%(+22.9)#90 | 8.8%(+22.6)#2,008 |
| 91. | Woodville | 31.3% | 8.5%(+22.8)#91 | 8.8%(+22.5)#2,027 |
| 92. | Frazier Park | 31.2% | 8.5%(+22.7)#92 | 8.8%(+22.5)#2,039 |
| 93. | Garden Farms | 30.9% | 8.5%(+22.4)#93 | 8.8%(+22.1)#2,080 |
| 94. | Plainview | 30.9% | 8.5%(+22.3)#94 | 8.8%(+22.1)#2,087 |
| 95. | Thermal | 30.5% | 8.5%(+22.0)#95 | 8.8%(+21.7)#2,145 |
| 96. | Lodoga | 30.2% | 8.5%(+21.7)#96 | 8.8%(+21.5)#2,189 |
| 97. | Crowley Lake | 30.2% | 8.5%(+21.7)#97 | 8.8%(+21.4)#2,191 |
| 98. | Rexland Acres | 30.2% | 8.5%(+21.6)#98 | 8.8%(+21.4)#2,197 |
| 99. | Thornton | 30.1% | 8.5%(+21.6)#99 | 8.8%(+21.4)#2,201 |
| 100. | Flournoy | 30.0% | 8.5%(+21.5)#100 | 8.8%(+21.2)#2,233 |
Common Questions
What are the Top 10 Cities with the Highest Poverty Level Among Families in California?
Top 10 Cities with the Highest Poverty Level Among Families in California are:
#1
100.0%
#2
100.0%
#3
100.0%
#4
100.0%
#5
100.0%
#6
100.0%
#7
100.0%
#8
100.0%
#9
100.0%
#10
100.0%
What city has the Highest Poverty Level Among Families in California?
Clipper Mills has the Highest Poverty Level Among Families in California with 100.0%.
What is the Poverty Level Among Families in the State of California?
Poverty Level Among Families in California is 8.5%.
What is the Poverty Level Among Families in the United States?
Poverty Level Among Families in the United States is 8.8%.