Zip Codes with the Highest Percentage of Population Employed in Installation, Maintenance & Repair in Covina, CA
RELATED REPORTS & OPTIONS
Installation, Maintenance & Repair
Covina
Compare Zip Codes
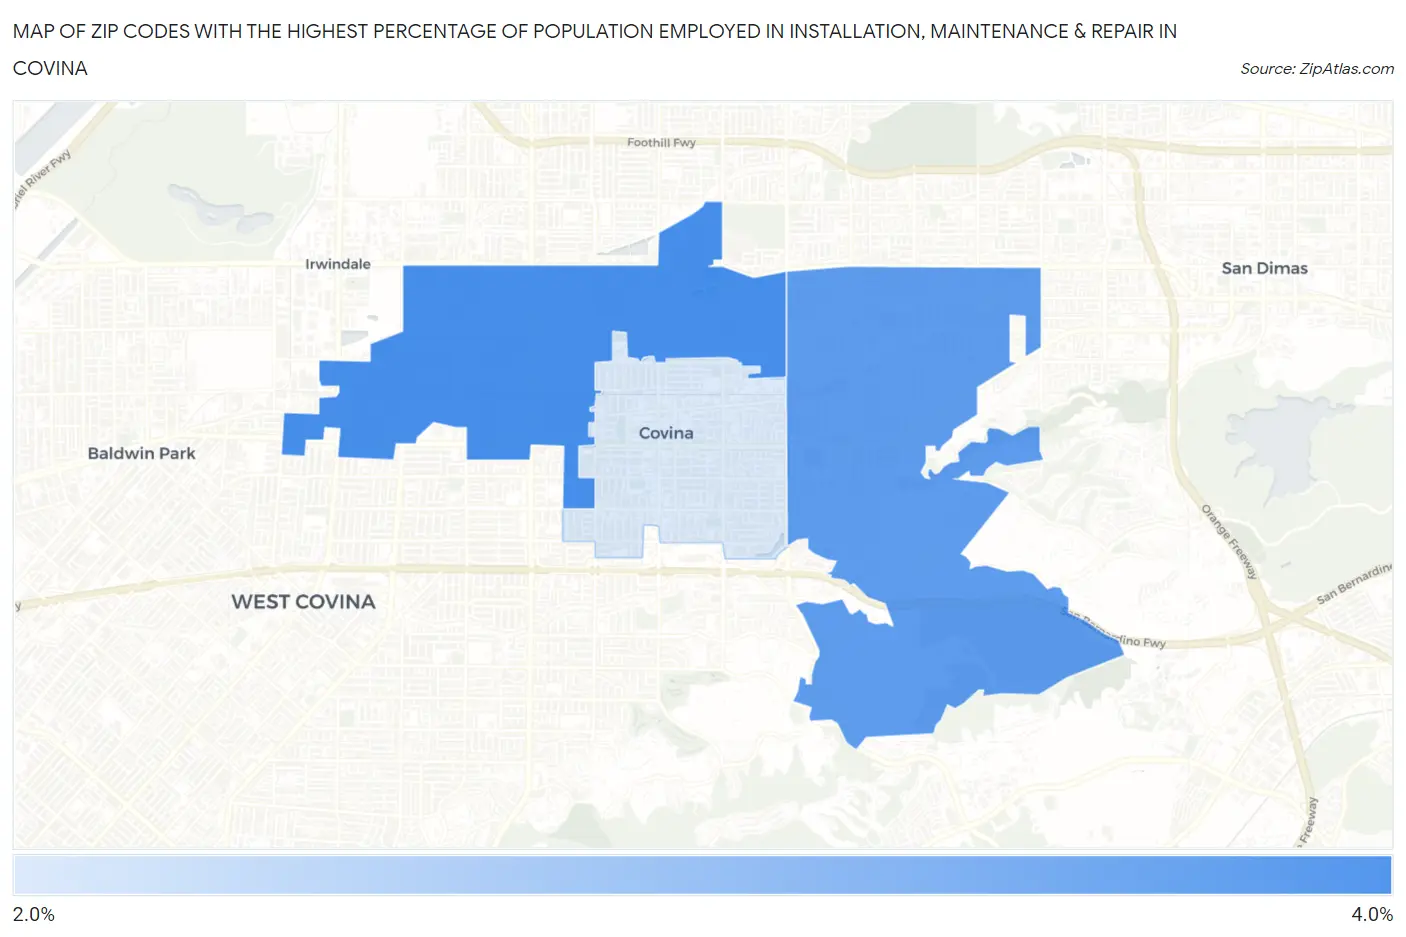
Map of Zip Codes with the Highest Percentage of Population Employed in Installation, Maintenance & Repair in Covina
2.2%
3.7%
Zip Codes with the Highest Percentage of Population Employed in Installation, Maintenance & Repair in Covina, CA
| Zip Code | % Employed | vs State | vs National | |
| 1. | 91722 | 3.7% | 2.6%(+1.17)#394 | 3.1%(+0.658)#13,570 |
| 2. | 91724 | 3.5% | 2.6%(+0.920)#462 | 3.1%(+0.408)#14,733 |
| 3. | 91723 | 2.2% | 2.6%(-0.406)#924 | 3.1%(-0.918)#21,309 |
1
Common Questions
What are the Top Zip Codes with the Highest Percentage of Population Employed in Installation, Maintenance & Repair in Covina, CA?
Top Zip Codes with the Highest Percentage of Population Employed in Installation, Maintenance & Repair in Covina, CA are:
What zip code has the Highest Percentage of Population Employed in Installation, Maintenance & Repair in Covina, CA?
91722 has the Highest Percentage of Population Employed in Installation, Maintenance & Repair in Covina, CA with 3.7%.
What is the Percentage of Population Employed in Installation, Maintenance & Repair in Covina, CA?
Percentage of Population Employed in Installation, Maintenance & Repair in Covina is 2.5%.
What is the Percentage of Population Employed in Installation, Maintenance & Repair in California?
Percentage of Population Employed in Installation, Maintenance & Repair in California is 2.6%.
What is the Percentage of Population Employed in Installation, Maintenance & Repair in the United States?
Percentage of Population Employed in Installation, Maintenance & Repair in the United States is 3.1%.