Cities with the Highest Percentage of Immigrants from Lebanon in California
RELATED REPORTS & OPTIONS
Lebanon
California
Compare Cities
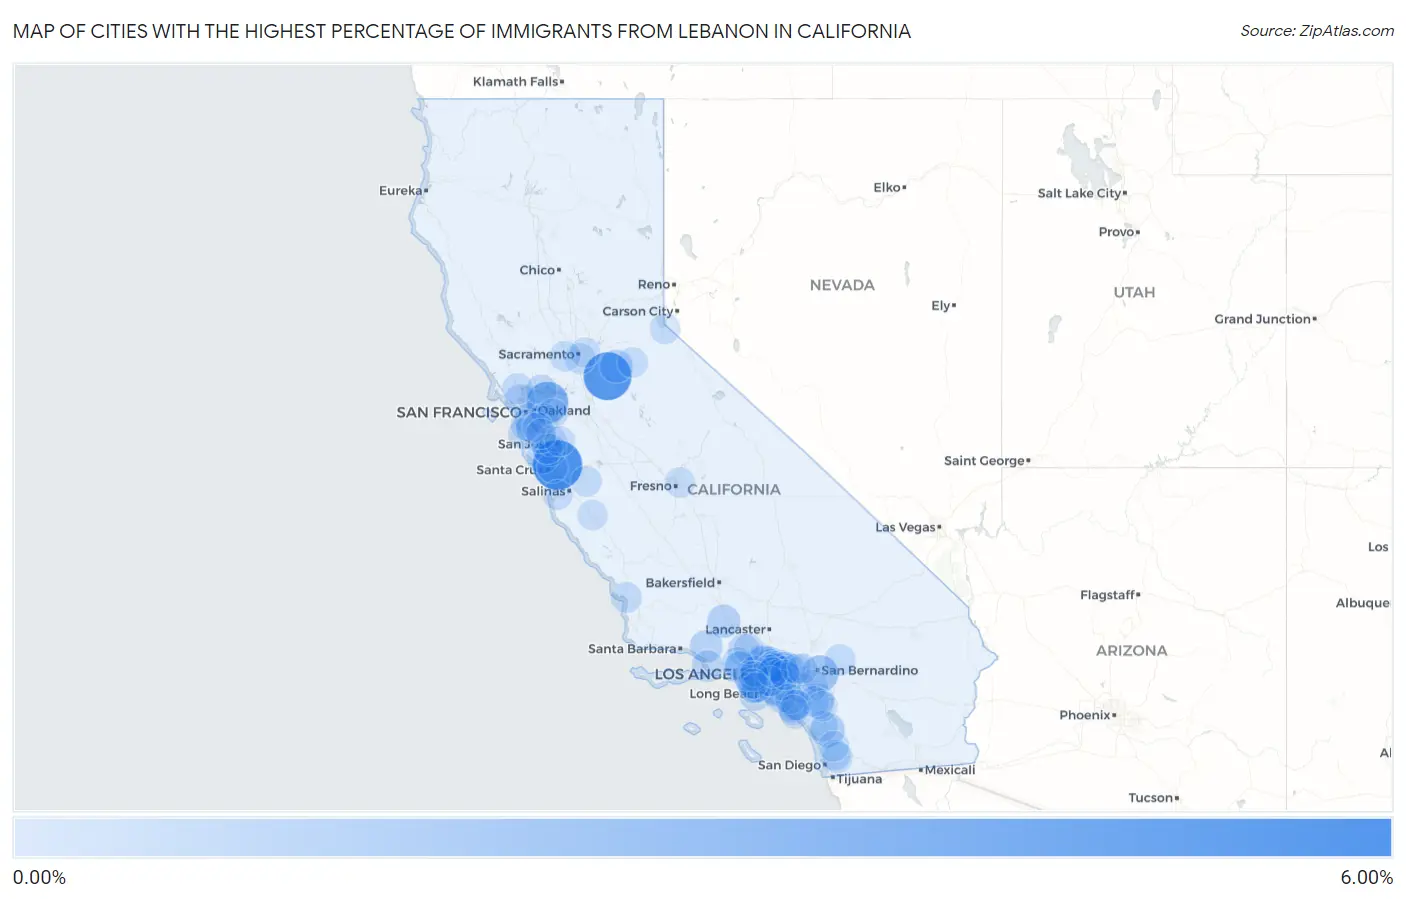
Map of Cities with the Highest Percentage of Immigrants from Lebanon in California
0.00%
6.00%
Cities with the Highest Percentage of Immigrants from Lebanon in California
| City | Lebanon | vs State | vs National | |
| 1. | Day Valley | 5.54% | 0.081%(+5.45)#-1 | 0.040%(+5.49)#0 |
| 2. | Camanche Village | 5.04% | 0.081%(+4.96)#0 | 0.040%(+5.00)#1 |
| 3. | Shell Ridge | 3.27% | 0.081%(+3.19)#1 | 0.040%(+3.23)#2 |
| 4. | Loma Linda | 1.93% | 0.081%(+1.85)#2 | 0.040%(+1.89)#3 |
| 5. | Baywood Park | 1.54% | 0.081%(+1.46)#3 | 0.040%(+1.50)#4 |
| 6. | Bayview Cdp Contra Costa County | 1.42% | 0.081%(+1.34)#4 | 0.040%(+1.38)#5 |
| 7. | Bell | 1.38% | 0.081%(+1.30)#5 | 0.040%(+1.34)#6 |
| 8. | El Sobrante Cdp Riverside County | 1.32% | 0.081%(+1.24)#39 | 0.040%(+1.28)#290 |
| 9. | Hidden Meadows | 1.30% | 0.081%(+1.22)#40 | 0.040%(+1.26)#291 |
| 10. | Glendale | 1.26% | 0.081%(+1.18)#137 | 0.040%(+1.22)#913 |
| 11. | Marina Del Rey | 1.04% | 0.081%(+0.961)#138 | 0.040%(+1.00)#914 |
| 12. | Altadena | 1.03% | 0.081%(+0.945)#180 | 0.040%(+0.985)#1,139 |
| 13. | Amador City | 0.93% | 0.081%(+0.850)#181 | 0.040%(+0.890)#1,140 |
| 14. | Frazier Park | 0.92% | 0.081%(+0.839)#182 | 0.040%(+0.879)#1,141 |
| 15. | La Crescenta Montrose | 0.86% | 0.081%(+0.780)#183 | 0.040%(+0.821)#1,142 |
| 16. | Ojai | 0.83% | 0.081%(+0.747)#184 | 0.040%(+0.788)#1,143 |
| 17. | Duarte | 0.76% | 0.081%(+0.676)#185 | 0.040%(+0.716)#1,144 |
| 18. | Highlands | 0.70% | 0.081%(+0.615)#186 | 0.040%(+0.656)#1,145 |
| 19. | Monte Sereno | 0.67% | 0.081%(+0.587)#187 | 0.040%(+0.628)#1,146 |
| 20. | Aliso Viejo | 0.66% | 0.081%(+0.574)#188 | 0.040%(+0.615)#1,147 |
| 21. | Boulder Creek | 0.62% | 0.081%(+0.538)#189 | 0.040%(+0.579)#1,148 |
| 22. | Pasadena | 0.60% | 0.081%(+0.524)#190 | 0.040%(+0.565)#1,149 |
| 23. | Mayflower Village | 0.60% | 0.081%(+0.514)#191 | 0.040%(+0.555)#1,150 |
| 24. | Channel Islands Beach | 0.59% | 0.081%(+0.510)#192 | 0.040%(+0.551)#1,151 |
| 25. | Stevenson Ranch | 0.59% | 0.081%(+0.510)#193 | 0.040%(+0.551)#1,152 |
| 26. | Stanton | 0.57% | 0.081%(+0.489)#194 | 0.040%(+0.529)#1,153 |
| 27. | Rancho Palos Verdes | 0.55% | 0.081%(+0.474)#195 | 0.040%(+0.515)#1,154 |
| 28. | Stanford | 0.50% | 0.081%(+0.418)#196 | 0.040%(+0.458)#1,155 |
| 29. | East Pasadena | 0.49% | 0.081%(+0.413)#197 | 0.040%(+0.453)#1,156 |
| 30. | Glendora | 0.49% | 0.081%(+0.411)#198 | 0.040%(+0.451)#1,157 |
| 31. | Brisbane | 0.48% | 0.081%(+0.403)#199 | 0.040%(+0.443)#1,158 |
| 32. | Half Moon Bay | 0.45% | 0.081%(+0.366)#200 | 0.040%(+0.407)#1,159 |
| 33. | Rose Hills | 0.44% | 0.081%(+0.361)#201 | 0.040%(+0.401)#1,160 |
| 34. | Larkspur | 0.44% | 0.081%(+0.359)#202 | 0.040%(+0.399)#1,161 |
| 35. | Big Bear Lake | 0.42% | 0.081%(+0.334)#203 | 0.040%(+0.375)#1,162 |
| 36. | Millbrae | 0.40% | 0.081%(+0.322)#225 | 0.040%(+0.363)#1,342 |
| 37. | Calabasas | 0.40% | 0.081%(+0.322)#226 | 0.040%(+0.362)#1,343 |
| 38. | Bell Canyon | 0.40% | 0.081%(+0.315)#227 | 0.040%(+0.356)#1,344 |
| 39. | Canyon Lake | 0.36% | 0.081%(+0.279)#228 | 0.040%(+0.320)#1,345 |
| 40. | Novato | 0.34% | 0.081%(+0.260)#229 | 0.040%(+0.301)#1,346 |
| 41. | Placentia | 0.34% | 0.081%(+0.259)#230 | 0.040%(+0.300)#1,347 |
| 42. | Bonsall | 0.34% | 0.081%(+0.258)#231 | 0.040%(+0.299)#1,348 |
| 43. | Pismo Beach | 0.34% | 0.081%(+0.255)#232 | 0.040%(+0.295)#1,349 |
| 44. | Ridgemark | 0.33% | 0.081%(+0.250)#233 | 0.040%(+0.291)#1,350 |
| 45. | Benicia | 0.33% | 0.081%(+0.248)#234 | 0.040%(+0.289)#1,351 |
| 46. | Cypress | 0.33% | 0.081%(+0.248)#235 | 0.040%(+0.288)#1,352 |
| 47. | Azusa | 0.33% | 0.081%(+0.247)#236 | 0.040%(+0.288)#1,353 |
| 48. | Santee | 0.32% | 0.081%(+0.244)#237 | 0.040%(+0.284)#1,354 |
| 49. | Sierra Madre | 0.32% | 0.081%(+0.242)#238 | 0.040%(+0.283)#1,355 |
| 50. | Lemon Hill | 0.32% | 0.081%(+0.236)#239 | 0.040%(+0.277)#1,356 |
| 51. | Diamond Bar | 0.32% | 0.081%(+0.235)#240 | 0.040%(+0.275)#1,357 |
| 52. | La Verne | 0.31% | 0.081%(+0.227)#241 | 0.040%(+0.267)#1,358 |
| 53. | Laguna Hills | 0.30% | 0.081%(+0.221)#242 | 0.040%(+0.261)#1,359 |
| 54. | Bostonia | 0.29% | 0.081%(+0.210)#243 | 0.040%(+0.251)#1,360 |
| 55. | Hidden Hills | 0.28% | 0.081%(+0.204)#244 | 0.040%(+0.245)#1,361 |
| 56. | Torrance | 0.28% | 0.081%(+0.196)#245 | 0.040%(+0.237)#1,362 |
| 57. | Soquel | 0.28% | 0.081%(+0.195)#246 | 0.040%(+0.236)#1,363 |
| 58. | Poway | 0.27% | 0.081%(+0.192)#247 | 0.040%(+0.233)#1,364 |
| 59. | Woodcrest | 0.26% | 0.081%(+0.178)#248 | 0.040%(+0.219)#1,365 |
| 60. | Wildomar | 0.26% | 0.081%(+0.177)#249 | 0.040%(+0.218)#1,366 |
| 61. | Buckhorn | 0.25% | 0.081%(+0.170)#250 | 0.040%(+0.210)#1,367 |
| 62. | Davis | 0.25% | 0.081%(+0.168)#251 | 0.040%(+0.208)#1,368 |
| 63. | South Lake Tahoe | 0.24% | 0.081%(+0.163)#252 | 0.040%(+0.203)#1,369 |
| 64. | Arcadia | 0.24% | 0.081%(+0.158)#253 | 0.040%(+0.198)#1,370 |
| 65. | Lakeland Village | 0.24% | 0.081%(+0.156)#254 | 0.040%(+0.196)#1,371 |
| 66. | Hermosa Beach | 0.23% | 0.081%(+0.149)#255 | 0.040%(+0.190)#1,372 |
| 67. | Greenfield | 0.23% | 0.081%(+0.146)#256 | 0.040%(+0.186)#1,373 |
| 68. | Cherryland | 0.23% | 0.081%(+0.145)#257 | 0.040%(+0.186)#1,374 |
| 69. | Avocado Heights | 0.22% | 0.081%(+0.135)#258 | 0.040%(+0.175)#1,375 |
| 70. | Santa Clara | 0.21% | 0.081%(+0.132)#259 | 0.040%(+0.172)#1,376 |
| 71. | Fullerton | 0.21% | 0.081%(+0.126)#281 | 0.040%(+0.166)#1,562 |
| 72. | San Mateo | 0.21% | 0.081%(+0.125)#282 | 0.040%(+0.165)#1,563 |
| 73. | Dana Point | 0.20% | 0.081%(+0.119)#283 | 0.040%(+0.160)#1,564 |
| 74. | Fountain Valley | 0.20% | 0.081%(+0.118)#284 | 0.040%(+0.159)#1,565 |
| 75. | Corona | 0.20% | 0.081%(+0.118)#285 | 0.040%(+0.159)#1,566 |
| 76. | Santa Monica | 0.20% | 0.081%(+0.115)#286 | 0.040%(+0.155)#1,567 |
| 77. | Beverly Hills | 0.19% | 0.081%(+0.114)#287 | 0.040%(+0.154)#1,568 |
| 78. | Covina | 0.19% | 0.081%(+0.107)#288 | 0.040%(+0.147)#1,569 |
| 79. | South Pasadena | 0.18% | 0.081%(+0.104)#289 | 0.040%(+0.144)#1,570 |
| 80. | San Ramon | 0.17% | 0.081%(+0.091)#290 | 0.040%(+0.132)#1,571 |
| 81. | Irvine | 0.17% | 0.081%(+0.086)#291 | 0.040%(+0.127)#1,572 |
| 82. | Downey | 0.17% | 0.081%(+0.085)#292 | 0.040%(+0.125)#1,573 |
| 83. | Mission Viejo | 0.16% | 0.081%(+0.082)#293 | 0.040%(+0.123)#1,574 |
| 84. | Santa Clarita | 0.16% | 0.081%(+0.081)#294 | 0.040%(+0.122)#1,575 |
| 85. | Tarpey Village | 0.16% | 0.081%(+0.079)#295 | 0.040%(+0.120)#1,576 |
| 86. | Saratoga | 0.16% | 0.081%(+0.079)#296 | 0.040%(+0.119)#1,577 |
| 87. | Los Angeles | 0.16% | 0.081%(+0.079)#297 | 0.040%(+0.119)#1,578 |
| 88. | Foster City | 0.16% | 0.081%(+0.076)#298 | 0.040%(+0.116)#1,579 |
| 89. | Rosemead | 0.15% | 0.081%(+0.072)#299 | 0.040%(+0.113)#1,580 |
| 90. | Alum Rock | 0.15% | 0.081%(+0.071)#300 | 0.040%(+0.112)#1,581 |
| 91. | Monterey | 0.15% | 0.081%(+0.069)#301 | 0.040%(+0.110)#1,582 |
| 92. | Laguna Niguel | 0.15% | 0.081%(+0.069)#302 | 0.040%(+0.109)#1,583 |
| 93. | Walnut | 0.15% | 0.081%(+0.068)#303 | 0.040%(+0.109)#1,584 |
| 94. | Redondo Beach | 0.15% | 0.081%(+0.067)#304 | 0.040%(+0.107)#1,585 |
| 95. | El Segundo | 0.15% | 0.081%(+0.066)#305 | 0.040%(+0.106)#1,586 |
| 96. | Menlo Park | 0.14% | 0.081%(+0.060)#306 | 0.040%(+0.101)#1,587 |
| 97. | Arden Arcade | 0.14% | 0.081%(+0.059)#307 | 0.040%(+0.099)#1,588 |
| 98. | Upland | 0.14% | 0.081%(+0.056)#308 | 0.040%(+0.097)#1,589 |
| 99. | Murrieta | 0.14% | 0.081%(+0.056)#309 | 0.040%(+0.097)#1,590 |
| 100. | Rancho Cucamonga | 0.14% | 0.081%(+0.055)#310 | 0.040%(+0.095)#1,591 |
Common Questions
What are the Top 10 Cities with the Highest Percentage of Immigrants from Lebanon in California?
Top 10 Cities with the Highest Percentage of Immigrants from Lebanon in California are:
#1
5.54%
#2
5.04%
#3
3.27%
#4
1.93%
#5
1.38%
#6
1.30%
#7
1.26%
#8
1.04%
#9
1.03%
#10
0.93%
What city has the Highest Percentage of Immigrants from Lebanon in California?
Day Valley has the Highest Percentage of Immigrants from Lebanon in California with 5.54%.
What is the Percentage of Immigrants from Lebanon in the State of California?
Percentage of Immigrants from Lebanon in California is 0.081%.
What is the Percentage of Immigrants from Lebanon in the United States?
Percentage of Immigrants from Lebanon in the United States is 0.040%.