Cities with the Highest Percentage of Population Driving Alone to Work in California
RELATED REPORTS & OPTIONS
Drive | Alone
California
Compare Cities
Map of Cities with the Highest Percentage of Population Driving Alone to Work in California
0.0%
100.0%
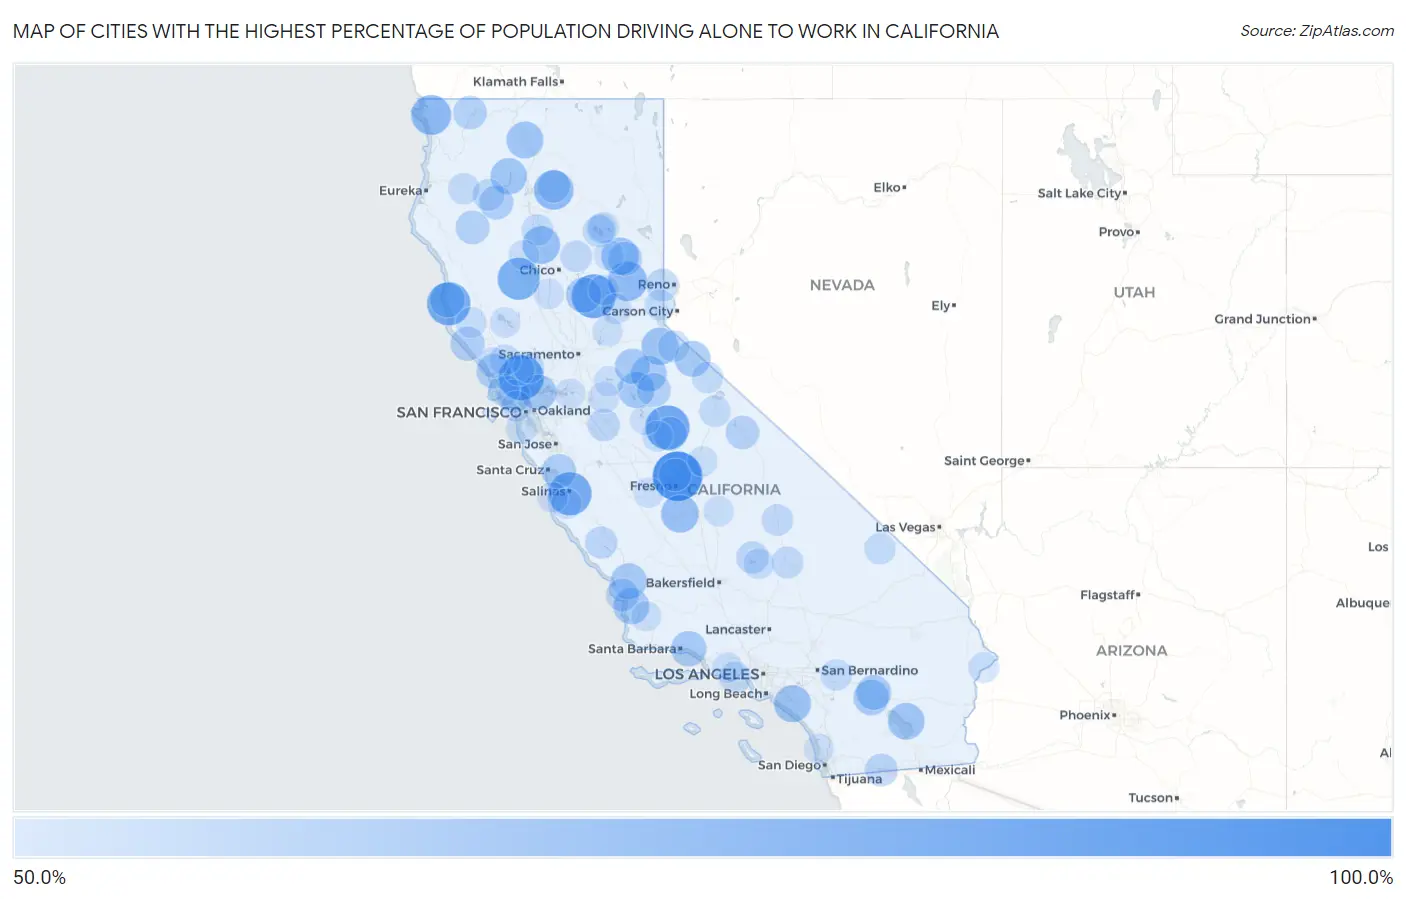
Cities with the Highest Percentage of Population Driving Alone to Work in California
| City | % Drive Alone | vs State | vs National | |
| 1. | Fort Washington | 80.2% | 41.3%(+38.9)#1 | 42.1%(+38.1)#2 |
| 2. | Temelec | 74.4% | 41.3%(+33.1)#2 | 42.1%(+32.3)#11 |
| 3. | Midpines | 73.3% | 41.3%(+32.0)#3 | 42.1%(+31.2)#15 |
| 4. | Dobbins | 73.1% | 41.3%(+31.8)#4 | 42.1%(+31.0)#16 |
| 5. | Little River | 72.2% | 41.3%(+30.9)#5 | 42.1%(+30.1)#23 |
| 6. | Spreckels | 72.0% | 41.3%(+30.7)#6 | 42.1%(+29.9)#26 |
| 7. | Elk Creek | 70.7% | 41.3%(+29.4)#7 | 42.1%(+28.6)#31 |
| 8. | Hiouchi | 67.7% | 41.3%(+26.4)#8 | 42.1%(+25.6)#73 |
| 9. | Round Mountain | 67.3% | 41.3%(+26.0)#9 | 42.1%(+25.2)#81 |
| 10. | Sierra City | 67.1% | 41.3%(+25.8)#10 | 42.1%(+25.0)#89 |
| 11. | Grangeville | 65.2% | 41.3%(+23.9)#11 | 42.1%(+23.1)#146 |
| 12. | Gerber | 65.1% | 41.3%(+23.8)#12 | 42.1%(+23.0)#147 |
| 13. | Greenhorn | 64.9% | 41.3%(+23.6)#13 | 42.1%(+22.8)#157 |
| 14. | Kirkwood | 64.5% | 41.3%(+23.2)#14 | 42.1%(+22.4)#174 |
| 15. | Laguna Woods | 64.4% | 41.3%(+23.1)#15 | 42.1%(+22.3)#183 |
| 16. | Edgewood | 64.1% | 41.3%(+22.8)#16 | 42.1%(+22.0)#210 |
| 17. | Bombay Beach | 63.9% | 41.3%(+22.6)#17 | 42.1%(+21.8)#220 |
| 18. | Del Dios | 63.8% | 41.3%(+22.5)#18 | 42.1%(+21.7)#224 |
| 19. | Trinity Center | 63.5% | 41.3%(+22.2)#19 | 42.1%(+21.4)#236 |
| 20. | Vallecito | 63.1% | 41.3%(+21.8)#20 | 42.1%(+21.0)#275 |
| 21. | Woodlands | 62.9% | 41.3%(+21.6)#21 | 42.1%(+20.8)#289 |
| 22. | Santa Margarita | 62.9% | 41.3%(+21.6)#22 | 42.1%(+20.8)#290 |
| 23. | Walker | 62.8% | 41.3%(+21.5)#23 | 42.1%(+20.7)#294 |
| 24. | Dorrington | 62.8% | 41.3%(+21.5)#24 | 42.1%(+20.7)#295 |
| 25. | Port Costa | 62.6% | 41.3%(+21.3)#25 | 42.1%(+20.5)#304 |
| 26. | Indian Wells | 62.5% | 41.3%(+21.2)#26 | 42.1%(+20.4)#305 |
| 27. | Toro Canyon | 62.3% | 41.3%(+21.0)#27 | 42.1%(+20.2)#330 |
| 28. | Bangor | 62.2% | 41.3%(+20.9)#28 | 42.1%(+20.1)#349 |
| 29. | West Point | 62.0% | 41.3%(+20.7)#29 | 42.1%(+19.9)#370 |
| 30. | Desert Palms | 61.7% | 41.3%(+20.4)#30 | 42.1%(+19.6)#392 |
| 31. | Mendocino | 61.7% | 41.3%(+20.4)#31 | 42.1%(+19.6)#393 |
| 32. | Elfin Forest | 61.2% | 41.3%(+19.9)#32 | 42.1%(+19.1)#453 |
| 33. | Aptos Hills Larkin Valley | 61.1% | 41.3%(+19.8)#33 | 42.1%(+19.0)#471 |
| 34. | Bodega | 61.1% | 41.3%(+19.8)#34 | 42.1%(+19.0)#476 |
| 35. | Douglas City | 60.7% | 41.3%(+19.4)#35 | 42.1%(+18.6)#519 |
| 36. | Sea Ranch | 60.6% | 41.3%(+19.3)#36 | 42.1%(+18.5)#524 |
| 37. | Cromberg | 60.6% | 41.3%(+19.3)#37 | 42.1%(+18.5)#527 |
| 38. | Bootjack | 60.4% | 41.3%(+19.1)#38 | 42.1%(+18.3)#565 |
| 39. | Sierra Village | 60.4% | 41.3%(+19.1)#39 | 42.1%(+18.3)#578 |
| 40. | Ruth | 60.3% | 41.3%(+19.0)#40 | 42.1%(+18.2)#591 |
| 41. | Happy Camp | 60.2% | 41.3%(+18.9)#41 | 42.1%(+18.1)#603 |
| 42. | Paradise | 60.0% | 41.3%(+18.7)#42 | 42.1%(+17.9)#642 |
| 43. | Woodacre | 59.8% | 41.3%(+18.5)#43 | 42.1%(+17.7)#660 |
| 44. | Avila Beach | 59.4% | 41.3%(+18.1)#44 | 42.1%(+17.3)#716 |
| 45. | Montgomery Creek | 59.1% | 41.3%(+17.8)#45 | 42.1%(+17.0)#808 |
| 46. | Knights Ferry | 59.1% | 41.3%(+17.8)#46 | 42.1%(+17.0)#814 |
| 47. | Jacumba | 59.0% | 41.3%(+17.7)#47 | 42.1%(+16.9)#819 |
| 48. | Kernville | 58.8% | 41.3%(+17.5)#48 | 42.1%(+16.7)#852 |
| 49. | Rolling Hills | 58.8% | 41.3%(+17.5)#49 | 42.1%(+16.7)#853 |
| 50. | Riverdale Park | 58.6% | 41.3%(+17.3)#50 | 42.1%(+16.5)#881 |
| 51. | Verdi | 58.6% | 41.3%(+17.3)#51 | 42.1%(+16.5)#889 |
| 52. | Lockwood | 58.3% | 41.3%(+17.0)#52 | 42.1%(+16.2)#967 |
| 53. | Junction City | 58.1% | 41.3%(+16.8)#53 | 42.1%(+16.0)#1,013 |
| 54. | Inyokern | 58.0% | 41.3%(+16.7)#54 | 42.1%(+15.9)#1,034 |
| 55. | Lake Almanor Country Club | 58.0% | 41.3%(+16.7)#55 | 42.1%(+15.9)#1,040 |
| 56. | Malibu | 57.9% | 41.3%(+16.6)#56 | 42.1%(+15.8)#1,053 |
| 57. | Stirling City | 57.7% | 41.3%(+16.4)#57 | 42.1%(+15.6)#1,088 |
| 58. | Point Reyes Station | 57.7% | 41.3%(+16.4)#58 | 42.1%(+15.6)#1,091 |
| 59. | Olancha | 57.7% | 41.3%(+16.4)#59 | 42.1%(+15.6)#1,098 |
| 60. | Bend | 57.6% | 41.3%(+16.3)#60 | 42.1%(+15.5)#1,115 |
| 61. | June Lake | 57.6% | 41.3%(+16.3)#61 | 42.1%(+15.5)#1,118 |
| 62. | Burnt Ranch | 57.6% | 41.3%(+16.3)#62 | 42.1%(+15.5)#1,119 |
| 63. | Markleeville | 57.6% | 41.3%(+16.3)#63 | 42.1%(+15.5)#1,120 |
| 64. | Yountville | 57.5% | 41.3%(+16.2)#64 | 42.1%(+15.4)#1,131 |
| 65. | Glen Ellen | 57.4% | 41.3%(+16.1)#65 | 42.1%(+15.3)#1,175 |
| 66. | Bridgeport | 57.4% | 41.3%(+16.1)#66 | 42.1%(+15.3)#1,183 |
| 67. | Oak Glen | 57.4% | 41.3%(+16.1)#67 | 42.1%(+15.3)#1,186 |
| 68. | Tecopa | 57.3% | 41.3%(+16.0)#68 | 42.1%(+15.2)#1,221 |
| 69. | Fulton | 57.1% | 41.3%(+15.8)#69 | 42.1%(+15.0)#1,264 |
| 70. | Clear Creek | 57.1% | 41.3%(+15.8)#70 | 42.1%(+15.0)#1,273 |
| 71. | Tahoe Vista | 57.0% | 41.3%(+15.7)#71 | 42.1%(+14.9)#1,295 |
| 72. | Catheys Valley | 56.8% | 41.3%(+15.5)#72 | 42.1%(+14.7)#1,329 |
| 73. | Peters | 56.8% | 41.3%(+15.5)#73 | 42.1%(+14.7)#1,336 |
| 74. | Montara | 56.7% | 41.3%(+15.4)#74 | 42.1%(+14.6)#1,355 |
| 75. | Olde Stockdale | 56.7% | 41.3%(+15.4)#75 | 42.1%(+14.6)#1,359 |
| 76. | Muir Beach | 56.7% | 41.3%(+15.4)#76 | 42.1%(+14.6)#1,361 |
| 77. | Weldon | 56.6% | 41.3%(+15.3)#77 | 42.1%(+14.5)#1,372 |
| 78. | Camptonville | 56.6% | 41.3%(+15.3)#78 | 42.1%(+14.5)#1,384 |
| 79. | Big River | 56.5% | 41.3%(+15.2)#79 | 42.1%(+14.4)#1,400 |
| 80. | Boonville | 56.5% | 41.3%(+15.2)#80 | 42.1%(+14.4)#1,401 |
| 81. | Dutch Flat | 56.5% | 41.3%(+15.2)#81 | 42.1%(+14.4)#1,435 |
| 82. | Del Monte Forest | 56.4% | 41.3%(+15.1)#82 | 42.1%(+14.3)#1,448 |
| 83. | Monte Rio | 56.4% | 41.3%(+15.1)#83 | 42.1%(+14.3)#1,459 |
| 84. | Soda Bay | 56.4% | 41.3%(+15.1)#84 | 42.1%(+14.3)#1,460 |
| 85. | Carmel Valley Village | 56.3% | 41.3%(+15.0)#85 | 42.1%(+14.2)#1,491 |
| 86. | Lake Sherwood | 56.3% | 41.3%(+15.0)#86 | 42.1%(+14.2)#1,495 |
| 87. | Princeton | 56.3% | 41.3%(+15.0)#87 | 42.1%(+14.2)#1,502 |
| 88. | Flournoy | 56.3% | 41.3%(+15.0)#88 | 42.1%(+14.2)#1,520 |
| 89. | Auburn Lake Trails | 56.2% | 41.3%(+14.9)#89 | 42.1%(+14.1)#1,534 |
| 90. | Bethel Island | 56.2% | 41.3%(+14.9)#90 | 42.1%(+14.1)#1,537 |
| 91. | Wallace | 56.2% | 41.3%(+14.9)#91 | 42.1%(+14.1)#1,550 |
| 92. | Tranquillity | 56.1% | 41.3%(+14.8)#92 | 42.1%(+14.0)#1,573 |
| 93. | Lemon Cove | 56.1% | 41.3%(+14.8)#93 | 42.1%(+14.0)#1,580 |
| 94. | Shaver Lake | 56.1% | 41.3%(+14.8)#94 | 42.1%(+14.0)#1,582 |
| 95. | Garey | 56.1% | 41.3%(+14.8)#95 | 42.1%(+14.0)#1,593 |
| 96. | Quincy | 56.0% | 41.3%(+14.7)#96 | 42.1%(+13.9)#1,600 |
| 97. | Lake Don Pedro | 56.0% | 41.3%(+14.7)#97 | 42.1%(+13.9)#1,601 |
| 98. | Del Mar | 55.9% | 41.3%(+14.6)#98 | 42.1%(+13.8)#1,624 |
| 99. | Hamilton Branch | 55.9% | 41.3%(+14.6)#99 | 42.1%(+13.8)#1,630 |
| 100. | North Fork | 55.8% | 41.3%(+14.5)#100 | 42.1%(+13.7)#1,639 |
Common Questions
What are the Top 10 Cities with the Highest Percentage of Population Driving Alone to Work in California?
Top 10 Cities with the Highest Percentage of Population Driving Alone to Work in California are:
#1
80.2%
#2
74.4%
#3
73.3%
#4
73.1%
#5
72.2%
#6
72.0%
#7
70.7%
#8
67.7%
#9
67.3%
#10
67.1%
What city has the Highest Percentage of Population Driving Alone to Work in California?
Fort Washington has the Highest Percentage of Population Driving Alone to Work in California with 80.2%.
What is the Percentage of Population Driving Alone to Work in the State of California?
Percentage of Population Driving Alone to Work in California is 41.3%.
What is the Percentage of Population Driving Alone to Work in the United States?
Percentage of Population Driving Alone to Work in the United States is 42.1%.