Cities with the Most Immigrants from Sri Lanka in California
RELATED REPORTS & OPTIONS
Sri Lanka
California
Compare Cities
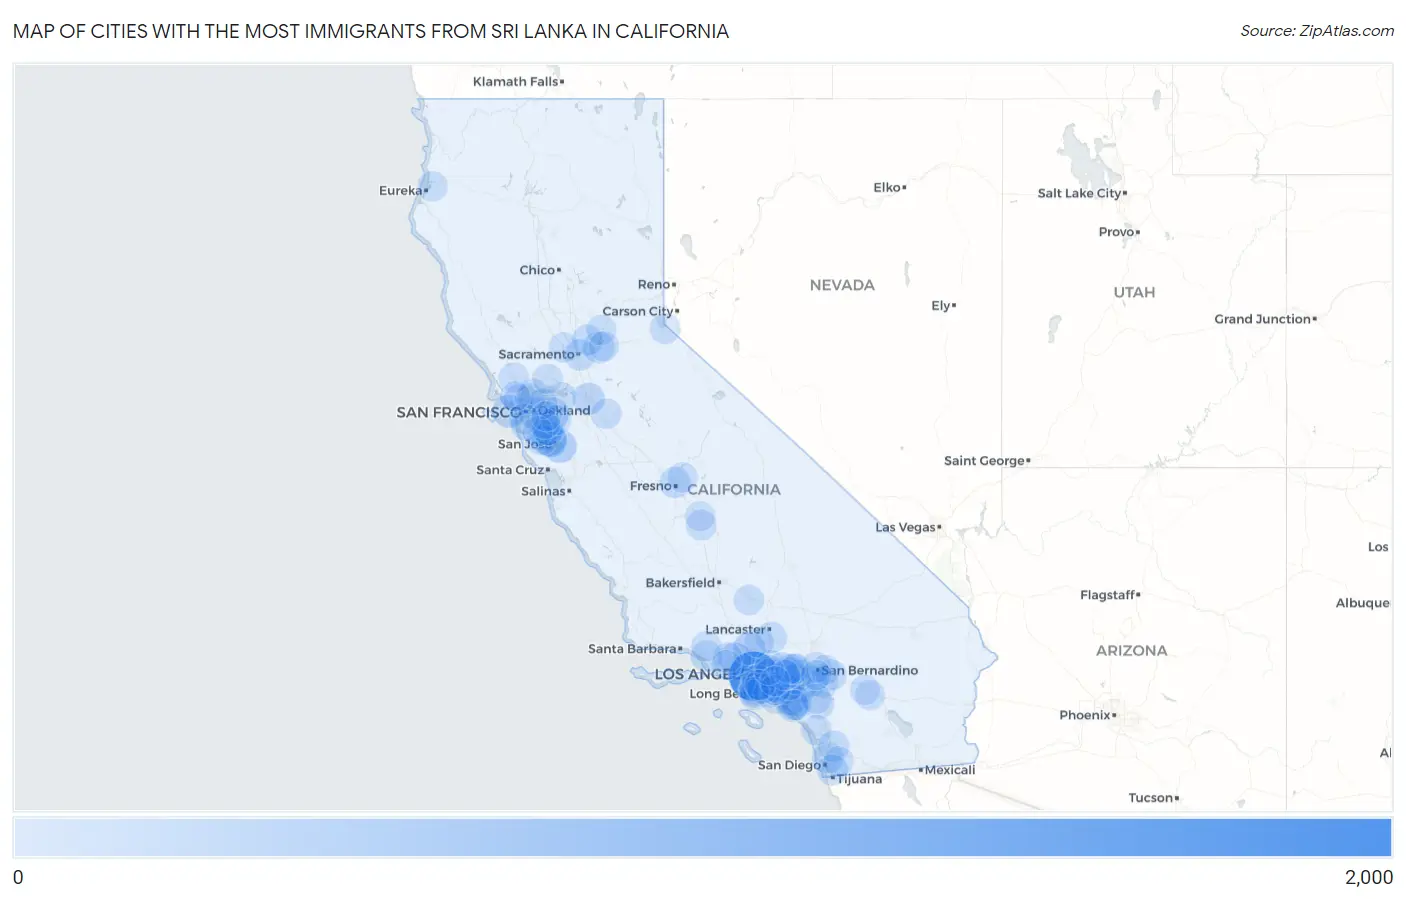
Map of Cities with the Most Immigrants from Sri Lanka in California
0
2,000
Cities with the Most Immigrants from Sri Lanka in California
| City | Sri Lanka | vs State | vs National | |
| 1. | Los Angeles | 1,939 | 11,287(17.18%)#1 | 56,619(3.42%)#2 |
| 2. | Sunnyvale | 429 | 11,287(3.80%)#2 | 56,619(0.76%)#6 |
| 3. | San Jose | 337 | 11,287(2.99%)#3 | 56,619(0.60%)#11 |
| 4. | Oakland | 301 | 11,287(2.67%)#4 | 56,619(0.53%)#15 |
| 5. | Irvine | 291 | 11,287(2.58%)#5 | 56,619(0.51%)#16 |
| 6. | San Francisco | 277 | 11,287(2.45%)#6 | 56,619(0.49%)#19 |
| 7. | Simi Valley | 268 | 11,287(2.37%)#7 | 56,619(0.47%)#20 |
| 8. | San Ramon | 267 | 11,287(2.37%)#8 | 56,619(0.47%)#21 |
| 9. | Santa Clarita | 251 | 11,287(2.22%)#9 | 56,619(0.44%)#23 |
| 10. | Santa Clara | 216 | 11,287(1.91%)#10 | 56,619(0.38%)#28 |
| 11. | Stockton | 200 | 11,287(1.77%)#11 | 56,619(0.35%)#31 |
| 12. | Torrance | 165 | 11,287(1.46%)#12 | 56,619(0.29%)#41 |
| 13. | Folsom | 147 | 11,287(1.30%)#13 | 56,619(0.26%)#50 |
| 14. | San Diego | 137 | 11,287(1.21%)#14 | 56,619(0.24%)#54 |
| 15. | San Buenaventura Ventura | 131 | 11,287(1.16%)#15 | 56,619(0.23%)#59 |
| 16. | Fremont | 130 | 11,287(1.15%)#16 | 56,619(0.23%)#60 |
| 17. | Riverside | 123 | 11,287(1.09%)#17 | 56,619(0.22%)#64 |
| 18. | Ontario | 123 | 11,287(1.09%)#18 | 56,619(0.22%)#65 |
| 19. | Palmdale | 123 | 11,287(1.09%)#19 | 56,619(0.22%)#66 |
| 20. | Poway | 123 | 11,287(1.09%)#20 | 56,619(0.22%)#68 |
| 21. | Aliso Viejo | 119 | 11,287(1.05%)#21 | 56,619(0.21%)#71 |
| 22. | Sacramento | 118 | 11,287(1.05%)#22 | 56,619(0.21%)#73 |
| 23. | West Covina | 116 | 11,287(1.03%)#23 | 56,619(0.20%)#77 |
| 24. | Fresno | 115 | 11,287(1.02%)#24 | 56,619(0.20%)#79 |
| 25. | Roseville | 106 | 11,287(0.94%)#25 | 56,619(0.19%)#89 |
| 26. | Millbrae | 100 | 11,287(0.89%)#26 | 56,619(0.18%)#94 |
| 27. | Cerritos | 96 | 11,287(0.85%)#27 | 56,619(0.17%)#100 |
| 28. | Chula Vista | 91 | 11,287(0.81%)#28 | 56,619(0.16%)#110 |
| 29. | Moreno Valley | 91 | 11,287(0.81%)#29 | 56,619(0.16%)#111 |
| 30. | Yucaipa | 83 | 11,287(0.74%)#30 | 56,619(0.15%)#125 |
| 31. | Eastern Goleta Valley | 81 | 11,287(0.72%)#31 | 56,619(0.14%)#131 |
| 32. | Wildomar | 79 | 11,287(0.70%)#32 | 56,619(0.14%)#135 |
| 33. | San Bernardino | 77 | 11,287(0.68%)#33 | 56,619(0.14%)#139 |
| 34. | Inglewood | 77 | 11,287(0.68%)#34 | 56,619(0.14%)#140 |
| 35. | South Lake Tahoe | 77 | 11,287(0.68%)#35 | 56,619(0.14%)#141 |
| 36. | Fullerton | 76 | 11,287(0.67%)#36 | 56,619(0.13%)#142 |
| 37. | Palo Alto | 76 | 11,287(0.67%)#37 | 56,619(0.13%)#144 |
| 38. | Lawndale | 73 | 11,287(0.65%)#38 | 56,619(0.13%)#150 |
| 39. | Corona | 72 | 11,287(0.64%)#39 | 56,619(0.13%)#151 |
| 40. | Lakewood | 71 | 11,287(0.63%)#40 | 56,619(0.13%)#153 |
| 41. | Kentfield | 70 | 11,287(0.62%)#41 | 56,619(0.12%)#155 |
| 42. | Oceanside | 67 | 11,287(0.59%)#42 | 56,619(0.12%)#162 |
| 43. | Tulare | 67 | 11,287(0.59%)#43 | 56,619(0.12%)#163 |
| 44. | Anaheim | 66 | 11,287(0.58%)#44 | 56,619(0.12%)#167 |
| 45. | Huntington Beach | 62 | 11,287(0.55%)#45 | 56,619(0.11%)#184 |
| 46. | Richmond | 62 | 11,287(0.55%)#46 | 56,619(0.11%)#186 |
| 47. | Rancho Palos Verdes | 58 | 11,287(0.51%)#47 | 56,619(0.10%)#204 |
| 48. | Lake Forest | 55 | 11,287(0.49%)#48 | 56,619(0.10%)#215 |
| 49. | Newark | 54 | 11,287(0.48%)#49 | 56,619(0.10%)#221 |
| 50. | Antioch | 53 | 11,287(0.47%)#50 | 56,619(0.09%)#223 |
| 51. | Mission Viejo | 52 | 11,287(0.46%)#51 | 56,619(0.09%)#229 |
| 52. | Pleasanton | 50 | 11,287(0.44%)#52 | 56,619(0.09%)#238 |
| 53. | Del Rio | 50 | 11,287(0.44%)#53 | 56,619(0.09%)#239 |
| 54. | Pasadena | 49 | 11,287(0.43%)#54 | 56,619(0.09%)#240 |
| 55. | Tehachapi | 49 | 11,287(0.43%)#55 | 56,619(0.09%)#242 |
| 56. | Long Beach | 48 | 11,287(0.43%)#56 | 56,619(0.08%)#244 |
| 57. | Hayward | 48 | 11,287(0.43%)#57 | 56,619(0.08%)#246 |
| 58. | Clovis | 48 | 11,287(0.43%)#58 | 56,619(0.08%)#248 |
| 59. | Chino | 48 | 11,287(0.43%)#59 | 56,619(0.08%)#249 |
| 60. | Monterey Park | 46 | 11,287(0.41%)#60 | 56,619(0.08%)#262 |
| 61. | Hercules | 43 | 11,287(0.38%)#61 | 56,619(0.08%)#289 |
| 62. | Carson | 42 | 11,287(0.37%)#62 | 56,619(0.07%)#294 |
| 63. | Highland | 42 | 11,287(0.37%)#63 | 56,619(0.07%)#295 |
| 64. | Lafayette | 41 | 11,287(0.36%)#64 | 56,619(0.07%)#302 |
| 65. | Petaluma | 39 | 11,287(0.35%)#65 | 56,619(0.07%)#312 |
| 66. | Agua Dulce | 39 | 11,287(0.35%)#66 | 56,619(0.07%)#315 |
| 67. | Yorba Linda | 38 | 11,287(0.34%)#67 | 56,619(0.07%)#318 |
| 68. | Azusa | 38 | 11,287(0.34%)#68 | 56,619(0.07%)#319 |
| 69. | Strawberry Cdp Marin County | 37 | 11,287(0.33%)#69 | 56,619(0.07%)#327 |
| 70. | Buena Park | 35 | 11,287(0.31%)#70 | 56,619(0.06%)#337 |
| 71. | La Canada Flintridge | 35 | 11,287(0.31%)#71 | 56,619(0.06%)#340 |
| 72. | Cypress | 34 | 11,287(0.30%)#72 | 56,619(0.06%)#346 |
| 73. | Claremont | 34 | 11,287(0.30%)#73 | 56,619(0.06%)#348 |
| 74. | Arcata | 34 | 11,287(0.30%)#74 | 56,619(0.06%)#355 |
| 75. | Palos Verdes Estates | 34 | 11,287(0.30%)#75 | 56,619(0.06%)#357 |
| 76. | Pomona | 33 | 11,287(0.29%)#76 | 56,619(0.06%)#362 |
| 77. | Lake Elsinore | 32 | 11,287(0.28%)#77 | 56,619(0.06%)#369 |
| 78. | Upland | 31 | 11,287(0.27%)#78 | 56,619(0.05%)#374 |
| 79. | Auburn | 31 | 11,287(0.27%)#79 | 56,619(0.05%)#379 |
| 80. | Ojai | 31 | 11,287(0.27%)#80 | 56,619(0.05%)#381 |
| 81. | Daly City | 30 | 11,287(0.27%)#81 | 56,619(0.05%)#384 |
| 82. | Moorpark | 30 | 11,287(0.27%)#82 | 56,619(0.05%)#387 |
| 83. | Rancho San Diego | 30 | 11,287(0.27%)#83 | 56,619(0.05%)#389 |
| 84. | Gardena | 29 | 11,287(0.26%)#84 | 56,619(0.05%)#397 |
| 85. | Palm Desert | 29 | 11,287(0.26%)#85 | 56,619(0.05%)#398 |
| 86. | Walnut | 29 | 11,287(0.26%)#86 | 56,619(0.05%)#404 |
| 87. | La Verne | 28 | 11,287(0.25%)#87 | 56,619(0.05%)#418 |
| 88. | Laguna Hills | 28 | 11,287(0.25%)#88 | 56,619(0.05%)#419 |
| 89. | South Pasadena | 28 | 11,287(0.25%)#89 | 56,619(0.05%)#421 |
| 90. | Visalia | 27 | 11,287(0.24%)#90 | 56,619(0.05%)#424 |
| 91. | Redwood City | 27 | 11,287(0.24%)#91 | 56,619(0.05%)#426 |
| 92. | Cathedral City | 26 | 11,287(0.23%)#92 | 56,619(0.05%)#438 |
| 93. | Grand Terrace | 26 | 11,287(0.23%)#93 | 56,619(0.05%)#446 |
| 94. | Fairfax | 26 | 11,287(0.23%)#94 | 56,619(0.05%)#448 |
| 95. | Castro Valley | 25 | 11,287(0.22%)#95 | 56,619(0.04%)#451 |
| 96. | Woodland | 25 | 11,287(0.22%)#96 | 56,619(0.04%)#452 |
| 97. | South Whittier | 25 | 11,287(0.22%)#97 | 56,619(0.04%)#453 |
| 98. | Fairfield | 24 | 11,287(0.21%)#98 | 56,619(0.04%)#459 |
| 99. | El Dorado Hills | 24 | 11,287(0.21%)#99 | 56,619(0.04%)#460 |
| 100. | Thousand Oaks | 23 | 11,287(0.20%)#100 | 56,619(0.04%)#462 |
Common Questions
What are the Top 10 Cities with the Most Immigrants from Sri Lanka in California?
Top 10 Cities with the Most Immigrants from Sri Lanka in California are:
#1
1,939
#2
429
#3
337
#4
301
#5
291
#6
277
#7
268
#8
267
#9
251
#10
216
What city has the Most Immigrants from Sri Lanka in California?
Los Angeles has the Most Immigrants from Sri Lanka in California with 1,939.
What is the Total Immigrants from Sri Lanka in the State of California?
Total Immigrants from Sri Lanka in California is 11,287.
What is the Total Immigrants from Sri Lanka in the United States?
Total Immigrants from Sri Lanka in the United States is 56,619.