North Carolina Map & Demographics
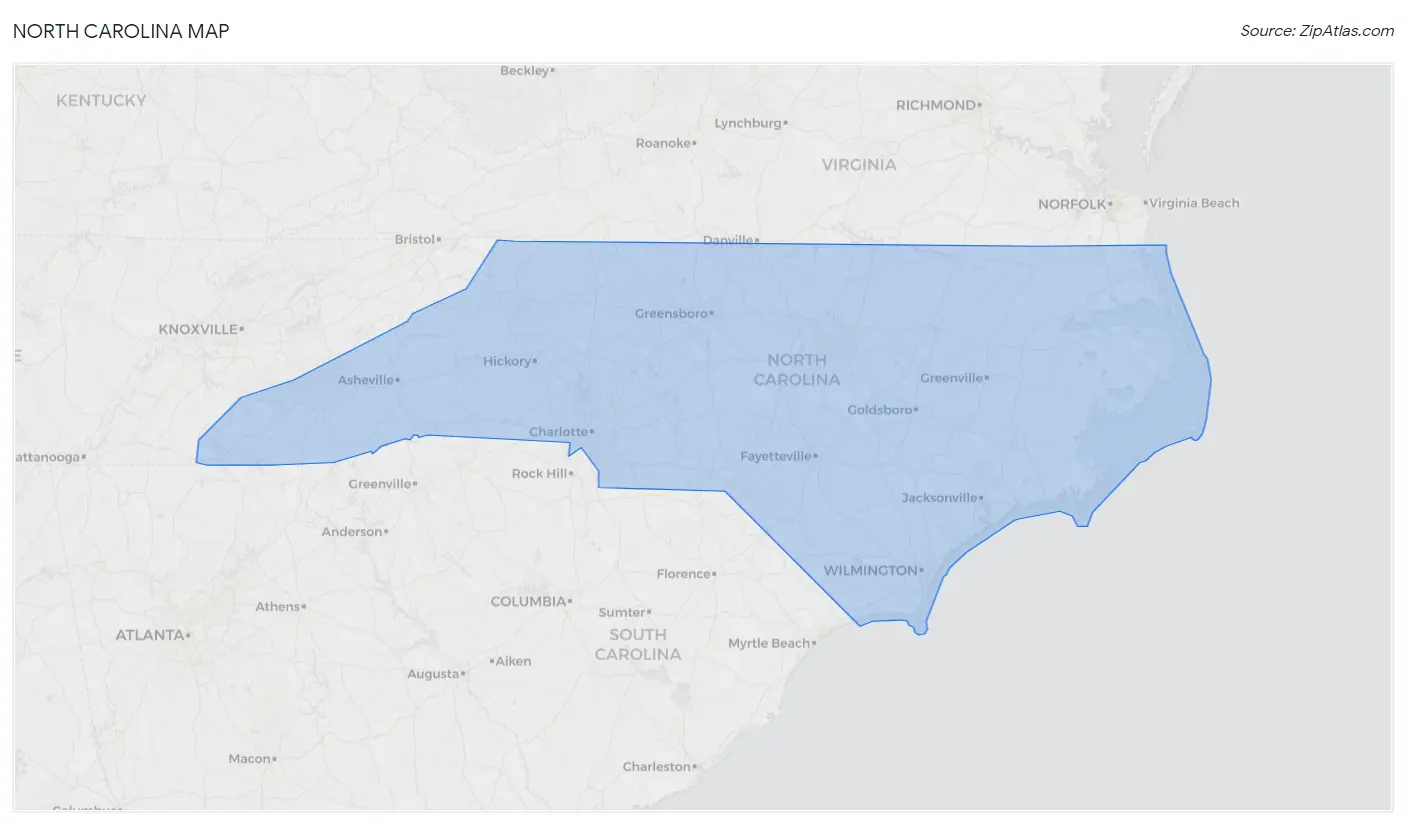
North Carolina Map
North Carolina Overview
Nov 21, 1789
INCORPORATED
53,819
TOTAL AREA [ SQ MI ]
48,619
LAND AREA [ SQ MI ]
5,200
WATER AREA [ SQ MI ]
700
ELEVATION AVG [ FT ]
6,684
ELEVATION HIGH [ FT ]
Sea Level
ELEVATION LOW [ FT ]
215.3
POP DENSITY [ PPL / SQ MI ]
$37,641
PER CAPITA INCOME
$82,890
AVG FAMILY INCOME
$66,186
AVG HOUSEHOLD INCOME
24.5%
WAGE / INCOME GAP [ % ]
75.5¢/ $1
WAGE / INCOME GAP [ $ ]
$10,791
FAMILY INCOME DEFICIT
0.48
INEQUALITY / GINI INDEX
27610
LARGEST ZIP CODE
Charlotte
LARGEST CITY
Wake County
LARGEST COUNTY
10,470,214
TOTAL POPULATION
5,131,370
MALE POPULATION
5,338,844
FEMALE POPULATION
96.11
MALES / 100 FEMALES
104.04
FEMALES / 100 MALES
39.1
MEDIAN AGE
3.1
AVG FAMILY SIZE
2.5
AVG HOUSEHOLD SIZE
5,292,296
LABOR FORCE [ PEOPLE ]
62.6%
PERCENT IN LABOR FORCE
5.1%
UNEMPLOYMENT RATE
Income in North Carolina
Income Overview in North Carolina
Per Capita Income in North Carolina is $37,641, while median incomes of families and households are $82,890 and $66,186 respectively.
| Characteristic | Number | Measure |
| Per Capita Income | 10,470,214 | $37,641 |
| Median Family Income | 2,653,429 | $82,890 |
| Mean Family Income | 2,653,429 | $110,687 |
| Median Household Income | 4,105,232 | $66,186 |
| Mean Household Income | 4,105,232 | $92,878 |
| Income Deficit | 2,653,429 | $10,791 |
| Wage / Income Gap (%) | 10,470,214 | 24.53% |
| Wage / Income Gap ($) | 10,470,214 | 75.47¢ per $1 |
| Gini / Inequality Index | 10,470,214 | 0.48 |
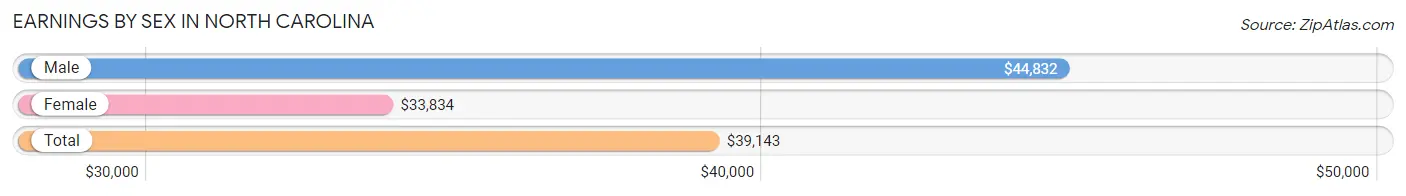
Earnings by Sex in North Carolina
Average Earnings in North Carolina are $39,143, $44,832 for men and $33,834 for women, a difference of 24.5%.
| Sex | Number | Average Earnings |
| Male | 2,878,788 (52.3%) | $44,832 |
| Female | 2,629,221 (47.7%) | $33,834 |
| Total | 5,508,009 (100.0%) | $39,143 |
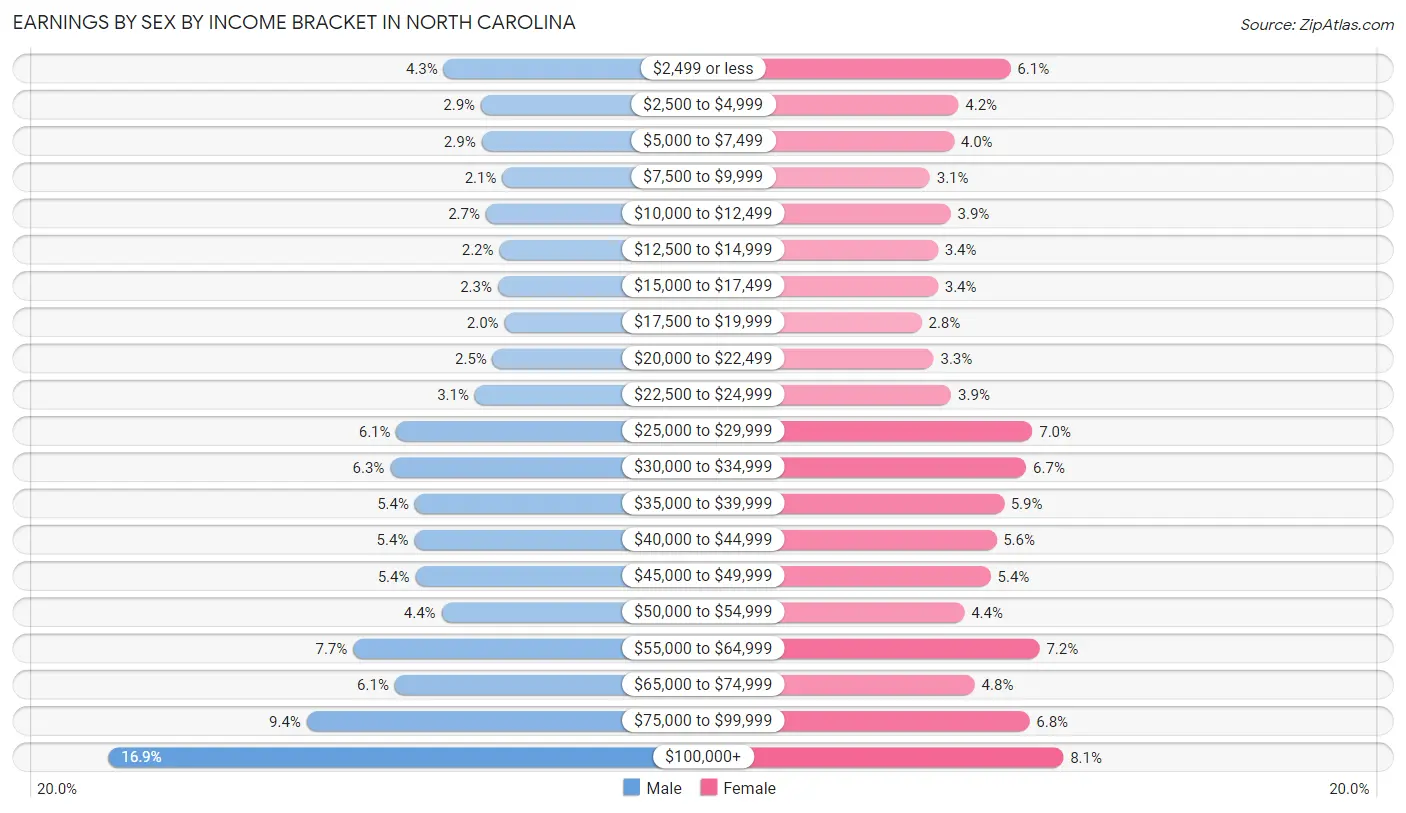
Earnings by Sex by Income Bracket in North Carolina
The most common earnings brackets in North Carolina are $100,000+ for men (485,359 | 16.9%) and $100,000+ for women (213,307 | 8.1%).
| Income | Male | Female |
| $2,499 or less | 123,904 (4.3%) | 161,269 (6.1%) |
| $2,500 to $4,999 | 83,584 (2.9%) | 109,961 (4.2%) |
| $5,000 to $7,499 | 82,944 (2.9%) | 105,426 (4.0%) |
| $7,500 to $9,999 | 60,477 (2.1%) | 81,664 (3.1%) |
| $10,000 to $12,499 | 78,247 (2.7%) | 102,213 (3.9%) |
| $12,500 to $14,999 | 63,707 (2.2%) | 89,699 (3.4%) |
| $15,000 to $17,499 | 65,212 (2.3%) | 89,615 (3.4%) |
| $17,500 to $19,999 | 58,287 (2.0%) | 73,653 (2.8%) |
| $20,000 to $22,499 | 70,732 (2.5%) | 85,434 (3.3%) |
| $22,500 to $24,999 | 89,964 (3.1%) | 102,875 (3.9%) |
| $25,000 to $29,999 | 174,608 (6.1%) | 182,731 (7.0%) |
| $30,000 to $34,999 | 181,464 (6.3%) | 176,590 (6.7%) |
| $35,000 to $39,999 | 154,954 (5.4%) | 154,575 (5.9%) |
| $40,000 to $44,999 | 155,576 (5.4%) | 147,215 (5.6%) |
| $45,000 to $49,999 | 154,250 (5.4%) | 141,603 (5.4%) |
| $50,000 to $54,999 | 126,065 (4.4%) | 115,767 (4.4%) |
| $55,000 to $64,999 | 221,355 (7.7%) | 189,845 (7.2%) |
| $65,000 to $74,999 | 176,552 (6.1%) | 125,870 (4.8%) |
| $75,000 to $99,999 | 271,547 (9.4%) | 179,909 (6.8%) |
| $100,000+ | 485,359 (16.9%) | 213,307 (8.1%) |
| Total | 2,878,788 (100.0%) | 2,629,221 (100.0%) |
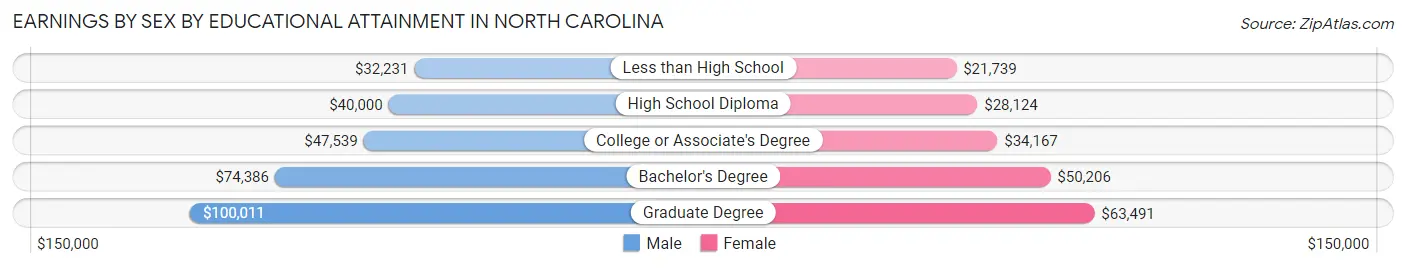
Earnings by Sex by Educational Attainment in North Carolina
Average earnings in North Carolina are $51,244 for men and $38,862 for women, a difference of 24.2%. Men with an educational attainment of graduate degree enjoy the highest average annual earnings of $100,011, while those with less than high school education earn the least with $32,231. Women with an educational attainment of graduate degree earn the most with the average annual earnings of $63,491, while those with less than high school education have the smallest earnings of $21,739.
| Educational Attainment | Male Income | Female Income |
| Less than High School | $32,231 | $21,739 |
| High School Diploma | $40,000 | $28,124 |
| College or Associate's Degree | $47,539 | $34,167 |
| Bachelor's Degree | $74,386 | $50,206 |
| Graduate Degree | $100,011 | $63,491 |
| Total | $51,244 | $38,862 |
Family Income in North Carolina
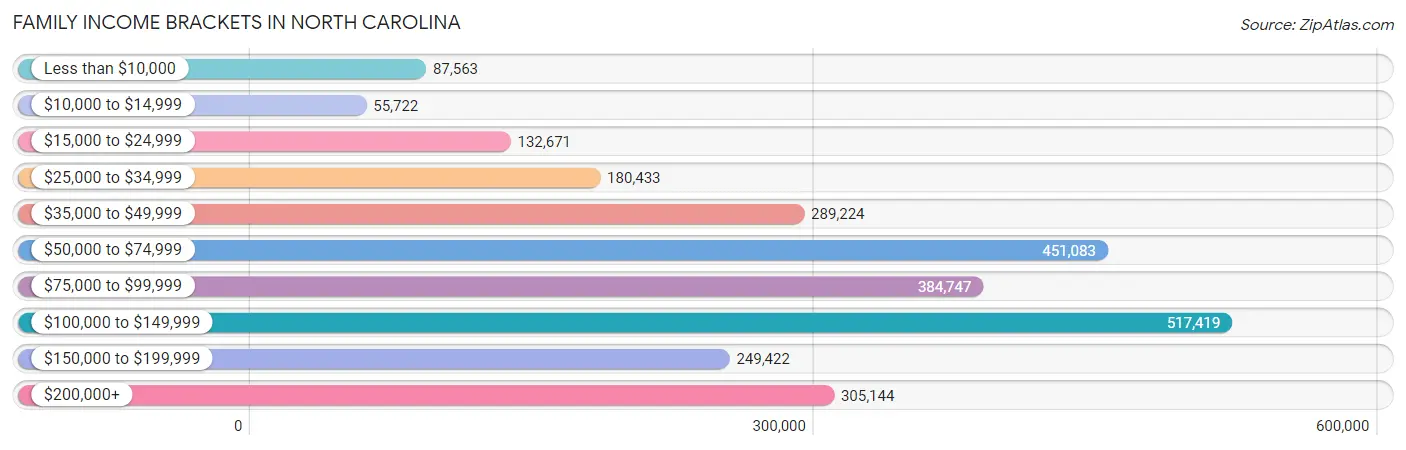
Family Income Brackets in North Carolina
According to the North Carolina family income data, there are 517,419 families falling into the $100,000 to $149,999 income range, which is the most common income bracket and makes up 19.5% of all families. Conversely, the $10,000 to $14,999 income bracket is the least frequent group with only 55,722 families (2.1%) belonging to this category.
| Income Bracket | # Families | % Families |
| Less than $10,000 | 87,563 | 3.3% |
| $10,000 to $14,999 | 55,722 | 2.1% |
| $15,000 to $24,999 | 132,671 | 5.0% |
| $25,000 to $34,999 | 180,433 | 6.8% |
| $35,000 to $49,999 | 289,224 | 10.9% |
| $50,000 to $74,999 | 451,083 | 17.0% |
| $75,000 to $99,999 | 384,747 | 14.5% |
| $100,000 to $149,999 | 517,419 | 19.5% |
| $150,000 to $199,999 | 249,422 | 9.4% |
| $200,000+ | 305,144 | 11.5% |
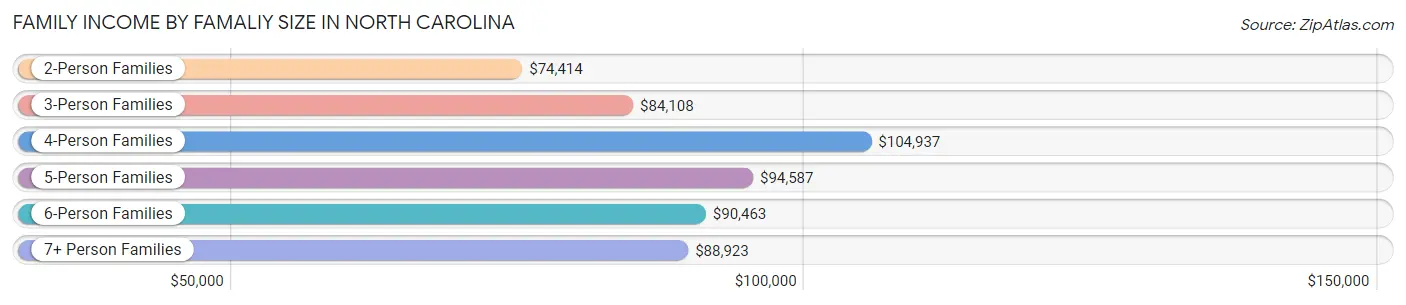
Family Income by Famaliy Size in North Carolina
4-person families (452,901 | 17.1%) account for the highest median family income in North Carolina with $104,937 per family, while 2-person families (1,326,715 | 50.0%) have the highest median income of $37,207 per family member.
| Income Bracket | # Families | Median Income |
| 2-Person Families | 1,326,715 (50.0%) | $74,414 |
| 3-Person Families | 595,787 (22.5%) | $84,108 |
| 4-Person Families | 452,901 (17.1%) | $104,937 |
| 5-Person Families | 184,292 (7.0%) | $94,587 |
| 6-Person Families | 63,419 (2.4%) | $90,463 |
| 7+ Person Families | 30,315 (1.1%) | $88,923 |
| Total | 2,653,429 (100.0%) | $82,890 |
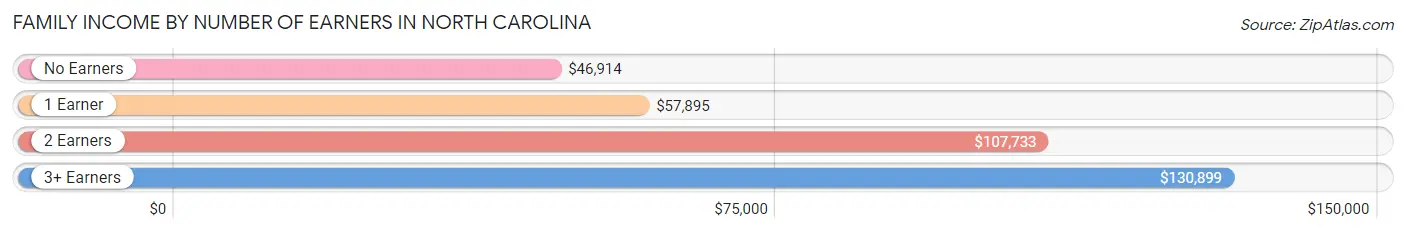
Family Income by Number of Earners in North Carolina
The median family income in North Carolina is $82,890, with families comprising 3+ earners (250,971) having the highest median family income of $130,899, while families with no earners (431,382) have the lowest median family income of $46,914, accounting for 9.5% and 16.3% of families, respectively.
| Number of Earners | # Families | Median Income |
| No Earners | 431,382 (16.3%) | $46,914 |
| 1 Earner | 875,021 (33.0%) | $57,895 |
| 2 Earners | 1,096,055 (41.3%) | $107,733 |
| 3+ Earners | 250,971 (9.5%) | $130,899 |
| Total | 2,653,429 (100.0%) | $82,890 |
Household Income in North Carolina
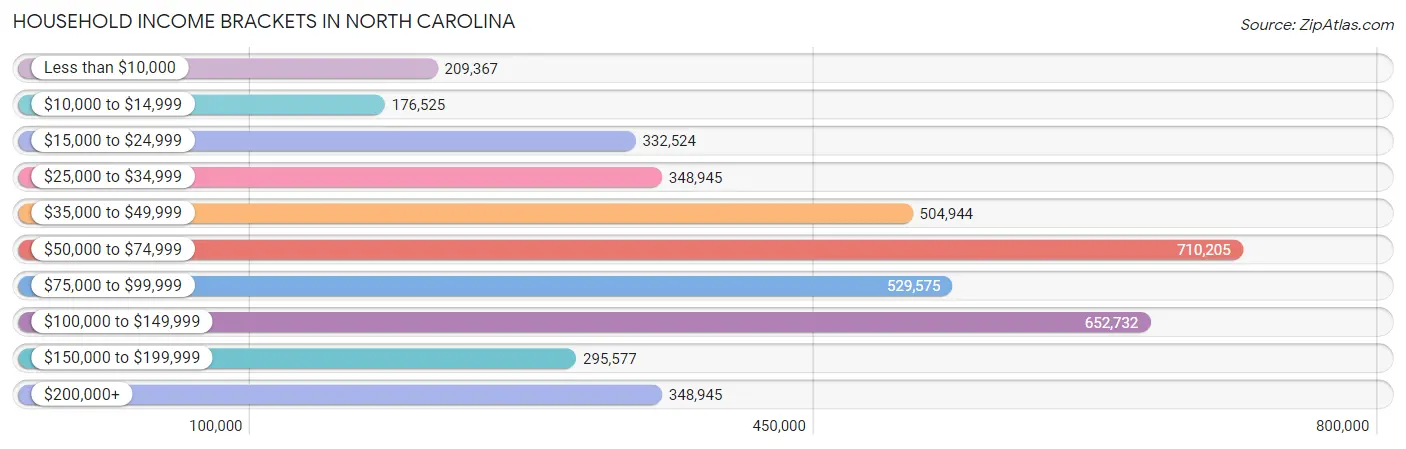
Household Income Brackets in North Carolina
With 710,205 households falling in the category, the $50,000 to $74,999 income range is the most frequent in North Carolina, accounting for 17.3% of all households. In contrast, only 176,525 households (4.3%) fall into the $10,000 to $14,999 income bracket, making it the least populous group.
| Income Bracket | # Households | % Households |
| Less than $10,000 | 209,367 | 5.1% |
| $10,000 to $14,999 | 176,525 | 4.3% |
| $15,000 to $24,999 | 332,524 | 8.1% |
| $25,000 to $34,999 | 348,945 | 8.5% |
| $35,000 to $49,999 | 504,944 | 12.3% |
| $50,000 to $74,999 | 710,205 | 17.3% |
| $75,000 to $99,999 | 529,575 | 12.9% |
| $100,000 to $149,999 | 652,732 | 15.9% |
| $150,000 to $199,999 | 295,577 | 7.2% |
| $200,000+ | 348,945 | 8.5% |
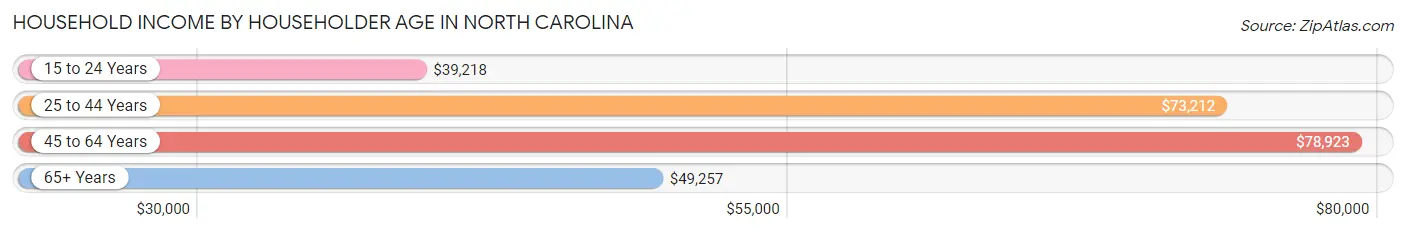
Household Income by Householder Age in North Carolina
The median household income in North Carolina is $66,186, with the highest median household income of $78,923 found in the 45 to 64 years age bracket for the primary householder. A total of 1,526,120 households (37.2%) fall into this category. Meanwhile, the 15 to 24 years age bracket for the primary householder has the lowest median household income of $39,218, with 168,722 households (4.1%) in this group.
| Income Bracket | # Households | Median Income |
| 15 to 24 Years | 168,722 (4.1%) | $39,218 |
| 25 to 44 Years | 1,315,133 (32.0%) | $73,212 |
| 45 to 64 Years | 1,526,120 (37.2%) | $78,923 |
| 65+ Years | 1,095,257 (26.7%) | $49,257 |
| Total | 4,105,232 (100.0%) | $66,186 |
Poverty in North Carolina
Income Below Poverty by Sex and Age in North Carolina
With 12.0% poverty level for males and 14.6% for females among the residents of North Carolina, 5 year old males and 18 to 24 year old females are the most vulnerable to poverty, with 12,176 males (20.8%) and 100,477 females (23.4%) in their respective age groups living below the poverty level.
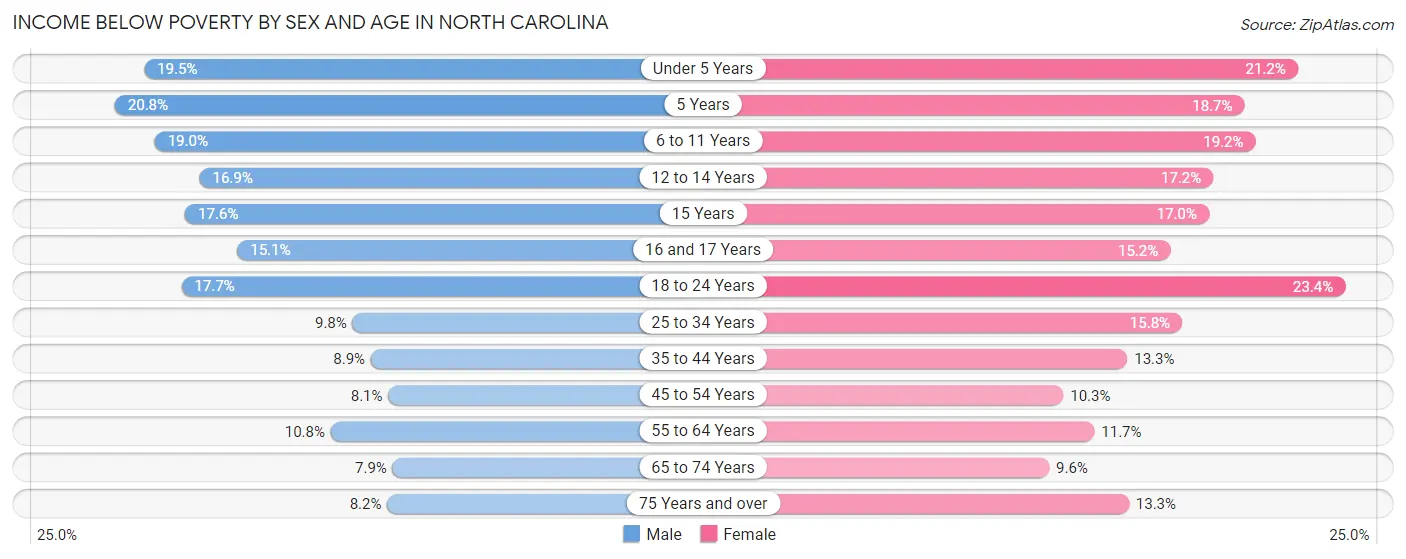
| Age Bracket | Male | Female |
| Under 5 Years | 57,558 (19.5%) | 59,860 (21.1%) |
| 5 Years | 12,176 (20.8%) | 10,848 (18.7%) |
| 6 to 11 Years | 73,192 (19.0%) | 70,505 (19.2%) |
| 12 to 14 Years | 34,000 (16.9%) | 33,142 (17.2%) |
| 15 Years | 12,291 (17.5%) | 11,351 (17.0%) |
| 16 and 17 Years | 20,398 (15.1%) | 20,016 (15.2%) |
| 18 to 24 Years | 79,008 (17.7%) | 100,477 (23.4%) |
| 25 to 34 Years | 65,979 (9.8%) | 109,964 (15.8%) |
| 35 to 44 Years | 56,796 (8.9%) | 88,403 (13.3%) |
| 45 to 54 Years | 53,431 (8.1%) | 70,165 (10.3%) |
| 55 to 64 Years | 69,539 (10.8%) | 81,794 (11.7%) |
| 65 to 74 Years | 37,968 (7.9%) | 53,871 (9.6%) |
| 75 Years and over | 22,433 (8.2%) | 52,253 (13.3%) |
| Total | 594,769 (12.0%) | 762,649 (14.6%) |
Income Above Poverty by Sex and Age in North Carolina
According to the poverty statistics in North Carolina, males aged 65 to 74 years and females aged 65 to 74 years are the age groups that are most secure financially, with 92.1% of males and 90.4% of females in these age groups living above the poverty line.
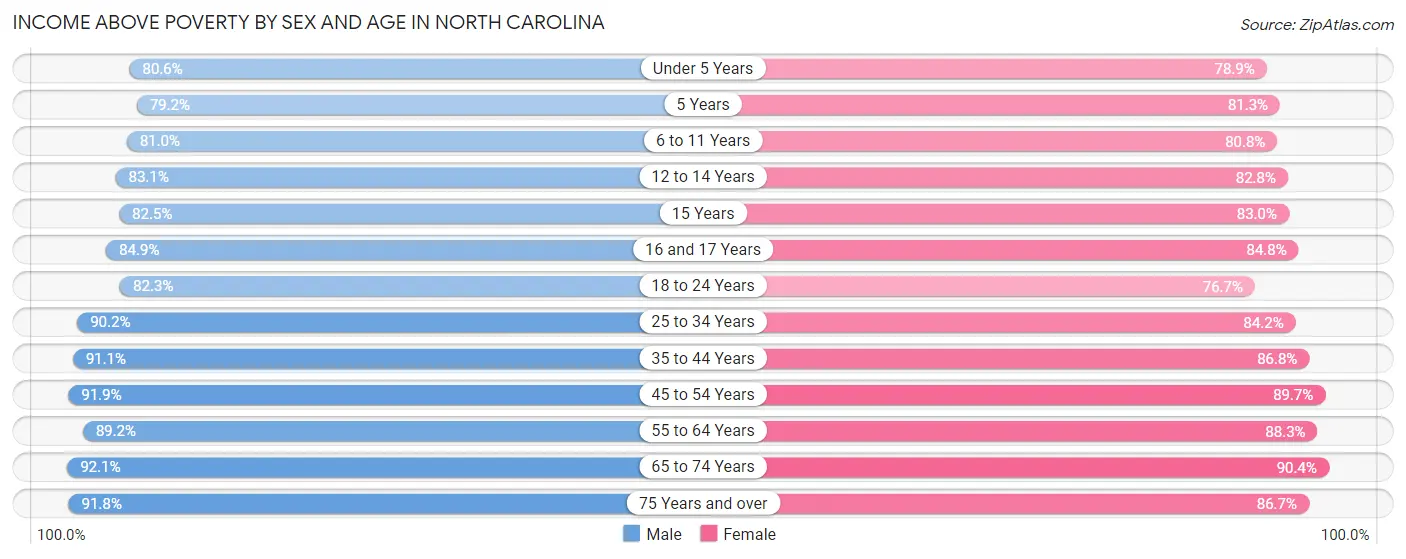
| Age Bracket | Male | Female |
| Under 5 Years | 238,435 (80.5%) | 223,122 (78.8%) |
| 5 Years | 46,339 (79.2%) | 47,235 (81.3%) |
| 6 to 11 Years | 312,852 (81.0%) | 296,942 (80.8%) |
| 12 to 14 Years | 167,426 (83.1%) | 159,240 (82.8%) |
| 15 Years | 57,757 (82.5%) | 55,294 (83.0%) |
| 16 and 17 Years | 114,409 (84.9%) | 111,386 (84.8%) |
| 18 to 24 Years | 366,864 (82.3%) | 329,876 (76.6%) |
| 25 to 34 Years | 608,737 (90.2%) | 586,829 (84.2%) |
| 35 to 44 Years | 579,326 (91.1%) | 578,718 (86.8%) |
| 45 to 54 Years | 604,797 (91.9%) | 612,412 (89.7%) |
| 55 to 64 Years | 574,709 (89.2%) | 616,074 (88.3%) |
| 65 to 74 Years | 441,706 (92.1%) | 506,199 (90.4%) |
| 75 Years and over | 252,075 (91.8%) | 339,978 (86.7%) |
| Total | 4,365,432 (88.0%) | 4,463,305 (85.4%) |
Income Below Poverty Among Married-Couple Families in North Carolina
The poverty statistics for married-couple families in North Carolina show that 4.5% or 87,611 of the total 1,952,436 families live below the poverty line. Families with 5 or more children have the highest poverty rate of 21.1%, comprising of 2,116 families. On the other hand, families with no children have the lowest poverty rate of 3.5%, which includes 41,025 families.
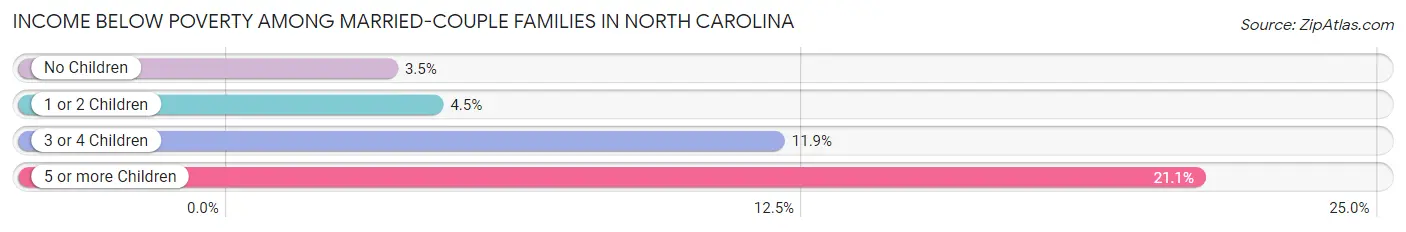
| Children | Above Poverty | Below Poverty |
| No Children | 1,139,138 (96.5%) | 41,025 (3.5%) |
| 1 or 2 Children | 594,684 (95.5%) | 27,842 (4.5%) |
| 3 or 4 Children | 123,070 (88.1%) | 16,628 (11.9%) |
| 5 or more Children | 7,933 (78.9%) | 2,116 (21.1%) |
| Total | 1,864,825 (95.5%) | 87,611 (4.5%) |
Income Below Poverty Among Single-Parent Households in North Carolina
According to the poverty data in North Carolina, 14.4% or 26,297 single-father households and 26.6% or 138,113 single-mother households are living below the poverty line. Among single-father households, those with 5 or more children have the highest poverty rate, with 423 households (41.7%) experiencing poverty. Likewise, among single-mother households, those with 5 or more children have the highest poverty rate, with 4,005 households (79.7%) falling below the poverty line.
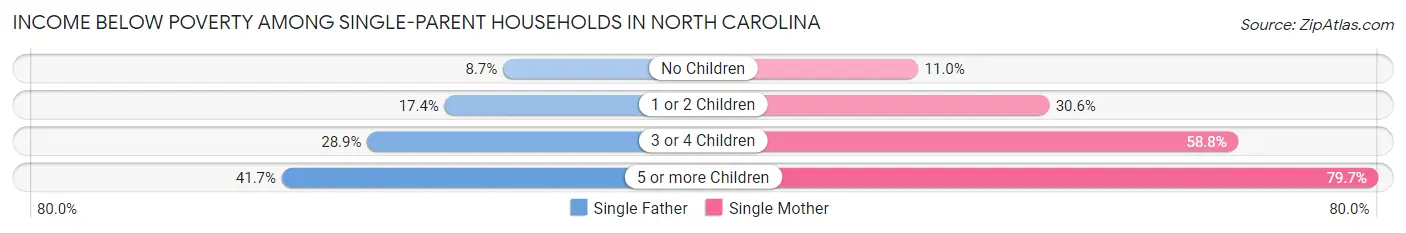
| Children | Single Father | Single Mother |
| No Children | 7,129 (8.7%) | 20,986 (11.0%) |
| 1 or 2 Children | 14,962 (17.4%) | 83,513 (30.5%) |
| 3 or 4 Children | 3,783 (28.9%) | 29,609 (58.8%) |
| 5 or more Children | 423 (41.7%) | 4,005 (79.7%) |
| Total | 26,297 (14.4%) | 138,113 (26.6%) |
Income Below Poverty Among Married-Couple vs Single-Parent Households in North Carolina
The poverty data for North Carolina shows that 87,611 of the married-couple family households (4.5%) and 164,410 of the single-parent households (23.4%) are living below the poverty level. Within the married-couple family households, those with 5 or more children have the highest poverty rate, with 2,116 households (21.1%) falling below the poverty line. Among the single-parent households, those with 5 or more children have the highest poverty rate, with 4,428 household (73.3%) living below poverty.
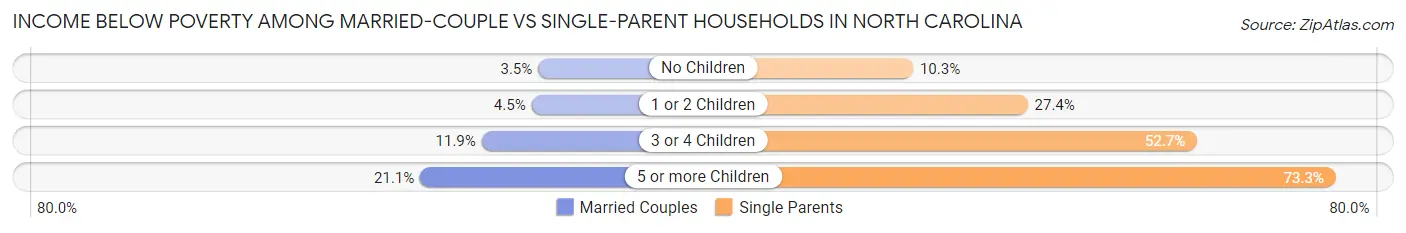
| Children | Married-Couple Families | Single-Parent Households |
| No Children | 41,025 (3.5%) | 28,115 (10.3%) |
| 1 or 2 Children | 27,842 (4.5%) | 98,475 (27.4%) |
| 3 or 4 Children | 16,628 (11.9%) | 33,392 (52.7%) |
| 5 or more Children | 2,116 (21.1%) | 4,428 (73.3%) |
| Total | 87,611 (4.5%) | 164,410 (23.4%) |
Largest Zip Codes by Population in North Carolina
The largest zip codes in North Carolina by population are 27610 (81,219), 28027 (79,079), 27587 (78,666), 28269 (78,540), and 28277 (71,047).
1.27610
81,219 (0.78%)
2.28027
79,079 (0.76%)
3.27587
78,666 (0.75%)
4.28269
78,540 (0.75%)
5.28277
71,047 (0.68%)
6.28078
68,639 (0.66%)
7.27519
66,046 (0.63%)
8.28215
64,713 (0.62%)
9.27406
64,386 (0.61%)
10.28173
62,501 (0.60%)
11.27703
60,483 (0.58%)
12.28227
59,904 (0.57%)
13.28314
57,908 (0.55%)
14.27616
57,599 (0.55%)
15.28025
57,384 (0.55%)
16.27713
57,157 (0.55%)
17.27858
57,075 (0.55%)
18.27526
56,866 (0.54%)
19.27284
56,773 (0.54%)
20.28655
56,692 (0.54%)
21.27410
54,951 (0.52%)
22.28110
54,577 (0.52%)
23.27834
54,547 (0.52%)
24.27407
54,257 (0.52%)
25.27603
53,535 (0.51%)
26.28216
53,422 (0.51%)
27.27529
53,223 (0.51%)
28.28601
53,172 (0.51%)
29.27405
51,962 (0.50%)
30.28205
51,160 (0.49%)
Largest Cities by Population in North Carolina
The largest cities in North Carolina by population are Charlotte (875,045), Raleigh (465,517), Greensboro (297,202), Durham (284,094), and Winston Salem (249,571).
875,045 (8.36%)
2.Raleigh
465,517 (4.45%)
297,202 (2.84%)
4.Durham
284,094 (2.71%)
249,571 (2.38%)
208,697 (1.99%)
7.Cary
174,880 (1.67%)
116,933 (1.12%)
114,120 (1.09%)
10.Concord
105,335 (1.01%)
11.Asheville
93,695 (0.89%)
12.Greenville
87,894 (0.84%)
13.Gastonia
80,615 (0.77%)
14.Jacksonville
71,908 (0.69%)
15.Apex
65,541 (0.63%)
16.Huntersville
61,202 (0.58%)
17.Chapel Hill
58,919 (0.56%)
18.Burlington
56,951 (0.54%)
19.Rocky Mount
54,260 (0.52%)
20.Kannapolis
53,314 (0.51%)
21.Mooresville
50,025 (0.48%)
22.Wake Forest
48,047 (0.46%)
23.Wilson
47,767 (0.46%)
24.Hickory
43,352 (0.41%)
42,023 (0.40%)
26.Indian Trail
40,325 (0.39%)
27.Salisbury
35,437 (0.34%)
35,428 (0.34%)
29.Monroe
34,897 (0.33%)
30.Goldsboro
33,566 (0.32%)
Largest Counties by Population in North Carolina
The largest counties in North Carolina by population are Wake County (1,132,103), Mecklenburg County (1,115,403), Guilford County (539,557), Forsyth County (383,739), and Cumberland County (335,207).
1,132,103 (10.81%)
1,115,403 (10.65%)
539,557 (5.15%)
383,739 (3.67%)
335,207 (3.20%)
325,101 (3.11%)
269,449 (2.57%)
240,109 (2.29%)
228,972 (2.19%)
228,134 (2.18%)
226,396 (2.16%)
219,042 (2.09%)
203,686 (1.95%)
187,839 (1.79%)
171,779 (1.64%)
16.Pitt County
171,196 (1.64%)
169,498 (1.62%)
161,011 (1.54%)
19.Rowan County
147,067 (1.40%)
145,919 (1.39%)
144,403 (1.38%)
139,721 (1.33%)
134,718 (1.29%)
117,573 (1.12%)
25.Wayne County
117,480 (1.12%)
116,469 (1.11%)
101,098 (0.97%)
28.Moore County
100,759 (0.96%)
99,527 (0.95%)
30.Nash County
95,015 (0.91%)
Race in North Carolina
The most populous races in North Carolina are White / Caucasian (6,800,458 | 64.9%), Black / African American (2,192,455 | 20.9%), and Hispanic or Latino (1,051,008 | 10.0%).
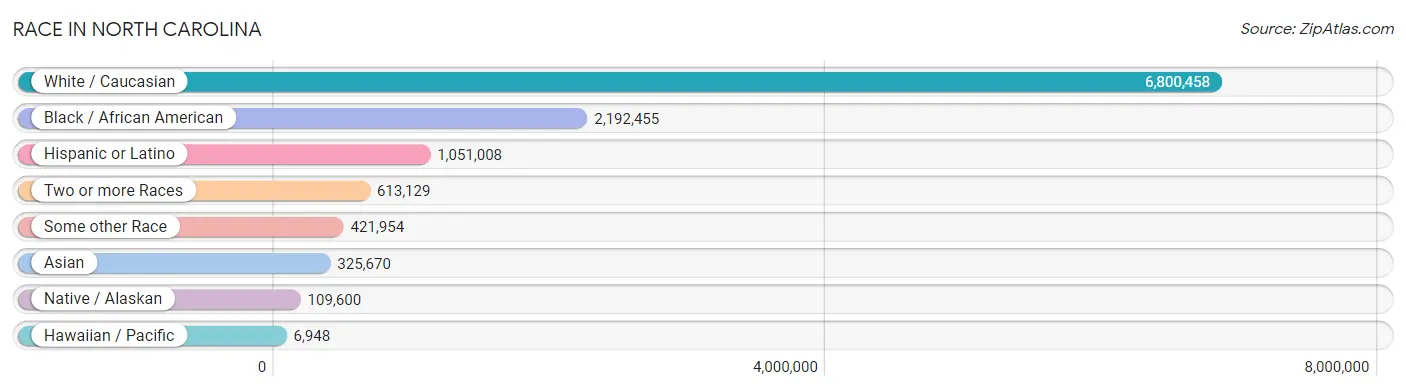
| Race | # Population | % Population |
| Asian | 325,670 | 3.1% |
| Black / African American | 2,192,455 | 20.9% |
| Hawaiian / Pacific | 6,948 | 0.1% |
| Hispanic or Latino | 1,051,008 | 10.0% |
| Native / Alaskan | 109,600 | 1.1% |
| White / Caucasian | 6,800,458 | 64.9% |
| Two or more Races | 613,129 | 5.9% |
| Some other Race | 421,954 | 4.0% |
| Total | 10,470,214 | 100.0% |
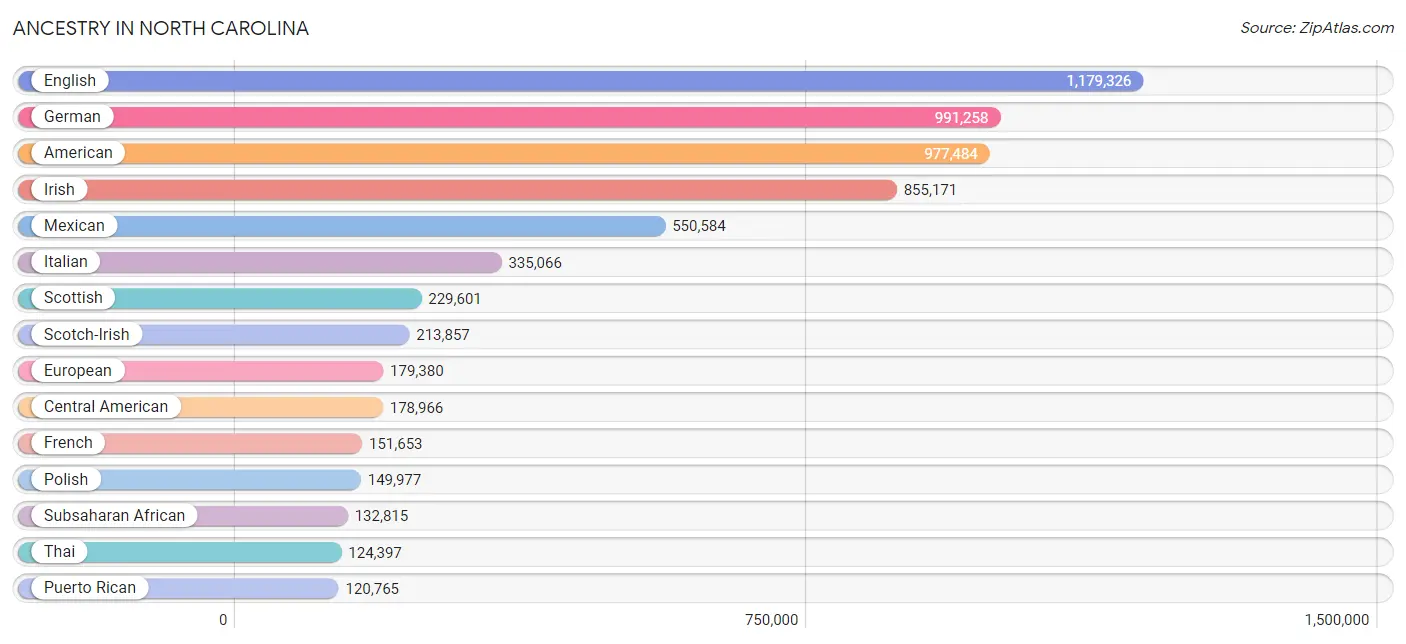
Ancestry in North Carolina
The most populous ancestries reported in North Carolina are English (1,179,326 | 11.3%), German (991,258 | 9.5%), American (977,484 | 9.3%), Irish (855,171 | 8.2%), and Mexican (550,584 | 5.3%), together accounting for 43.5% of all North Carolina residents.
| Ancestry | # Population | % Population |
| Afghan | 1,683 | 0.0% |
| African | 74,005 | 0.7% |
| Alaska Native | 170 | 0.0% |
| Alaskan Athabascan | 73 | 0.0% |
| Albanian | 1,603 | 0.0% |
| Aleut | 91 | 0.0% |
| Alsatian | 202 | 0.0% |
| American | 977,484 | 9.3% |
| Apache | 1,794 | 0.0% |
| Arab | 45,666 | 0.4% |
| Arapaho | 131 | 0.0% |
| Argentinean | 4,991 | 0.1% |
| Armenian | 3,719 | 0.0% |
| Assyrian / Chaldean / Syriac | 97 | 0.0% |
| Australian | 1,818 | 0.0% |
| Austrian | 11,841 | 0.1% |
| Bahamian | 854 | 0.0% |
| Bangladeshi | 13,851 | 0.1% |
| Barbadian | 1,594 | 0.0% |
| Basque | 338 | 0.0% |
| Belgian | 5,000 | 0.1% |
| Belizean | 704 | 0.0% |
| Bermudan | 272 | 0.0% |
| Bhutanese | 20,116 | 0.2% |
| Blackfeet | 6,409 | 0.1% |
| Bolivian | 1,092 | 0.0% |
| Brazilian | 8,410 | 0.1% |
| British | 61,893 | 0.6% |
| British West Indian | 1,828 | 0.0% |
| Bulgarian | 2,393 | 0.0% |
| Burmese | 34,901 | 0.3% |
| Cajun | 1,115 | 0.0% |
| Cambodian | 645 | 0.0% |
| Canadian | 13,972 | 0.1% |
| Cape Verdean | 725 | 0.0% |
| Carpatho Rusyn | 136 | 0.0% |
| Celtic | 1,478 | 0.0% |
| Central American | 178,966 | 1.7% |
| Central American Indian | 8,461 | 0.1% |
| Cherokee | 55,141 | 0.5% |
| Cheyenne | 145 | 0.0% |
| Chickasaw | 658 | 0.0% |
| Chilean | 4,349 | 0.0% |
| Chinese | 338 | 0.0% |
| Chippewa | 1,392 | 0.0% |
| Choctaw | 1,774 | 0.0% |
| Colombian | 29,684 | 0.3% |
| Colville | 43 | 0.0% |
| Comanche | 204 | 0.0% |
| Costa Rican | 5,531 | 0.1% |
| Cree | 74 | 0.0% |
| Creek | 1,721 | 0.0% |
| Croatian | 5,250 | 0.1% |
| Crow | 47 | 0.0% |
| Cuban | 30,879 | 0.3% |
| Cypriot | 219 | 0.0% |
| Czech | 18,273 | 0.2% |
| Czechoslovakian | 4,930 | 0.1% |
| Danish | 15,588 | 0.2% |
| Delaware | 315 | 0.0% |
| Dominican | 32,871 | 0.3% |
| Dutch | 75,227 | 0.7% |
| Dutch West Indian | 353 | 0.0% |
| Eastern European | 19,849 | 0.2% |
| Ecuadorian | 13,087 | 0.1% |
| Egyptian | 7,030 | 0.1% |
| English | 1,179,326 | 11.3% |
| Estonian | 662 | 0.0% |
| Ethiopian | 7,199 | 0.1% |
| European | 179,380 | 1.7% |
| Fijian | 408 | 0.0% |
| Filipino | 3,345 | 0.0% |
| Finnish | 8,349 | 0.1% |
| French | 151,653 | 1.5% |
| French American Indian | 773 | 0.0% |
| French Canadian | 33,977 | 0.3% |
| German | 991,258 | 9.5% |
| German Russian | 263 | 0.0% |
| Ghanaian | 4,576 | 0.0% |
| Greek | 29,585 | 0.3% |
| Guamanian / Chamorro | 3,527 | 0.0% |
| Guatemalan | 38,038 | 0.4% |
| Guyanese | 2,436 | 0.0% |
| Haitian | 12,265 | 0.1% |
| Hmong | 13 | 0.0% |
| Honduran | 59,809 | 0.6% |
| Hopi | 53 | 0.0% |
| Houma | 125 | 0.0% |
| Hungarian | 29,841 | 0.3% |
| Icelander | 707 | 0.0% |
| Indian (Asian) | 62,079 | 0.6% |
| Indonesian | 6,161 | 0.1% |
| Inupiat | 259 | 0.0% |
| Iranian | 6,809 | 0.1% |
| Iraqi | 1,456 | 0.0% |
| Irish | 855,171 | 8.2% |
| Iroquois | 3,227 | 0.0% |
| Israeli | 1,715 | 0.0% |
| Italian | 335,066 | 3.2% |
| Jamaican | 23,560 | 0.2% |
| Japanese | 6,433 | 0.1% |
| Jordanian | 2,345 | 0.0% |
| Kenyan | 3,200 | 0.0% |
| Kiowa | 58 | 0.0% |
| Korean | 47,046 | 0.4% |
| Laotian | 1,940 | 0.0% |
| Latvian | 1,391 | 0.0% |
| Lebanese | 13,288 | 0.1% |
| Liberian | 3,769 | 0.0% |
| Lithuanian | 11,130 | 0.1% |
| Lumbee | 63,338 | 0.6% |
| Luxembourger | 464 | 0.0% |
| Macedonian | 740 | 0.0% |
| Malaysian | 6,865 | 0.1% |
| Maltese | 709 | 0.0% |
| Marshallese | 31 | 0.0% |
| Menominee | 62 | 0.0% |
| Mexican | 550,584 | 5.3% |
| Mexican American Indian | 8,453 | 0.1% |
| Mongolian | 615 | 0.0% |
| Moroccan | 4,075 | 0.0% |
| Native Hawaiian | 6,330 | 0.1% |
| Navajo | 1,617 | 0.0% |
| Nepalese | 242 | 0.0% |
| New Zealander | 562 | 0.0% |
| Nicaraguan | 6,996 | 0.1% |
| Nigerian | 15,875 | 0.2% |
| Northern European | 11,197 | 0.1% |
| Norwegian | 46,820 | 0.4% |
| Okinawan | 115 | 0.0% |
| Osage | 201 | 0.0% |
| Ottawa | 44 | 0.0% |
| Paiute | 61 | 0.0% |
| Pakistani | 6,631 | 0.1% |
| Palestinian | 4,543 | 0.0% |
| Panamanian | 7,328 | 0.1% |
| Paraguayan | 445 | 0.0% |
| Pennsylvania German | 2,123 | 0.0% |
| Peruvian | 10,337 | 0.1% |
| Polish | 149,977 | 1.4% |
| Portuguese | 17,979 | 0.2% |
| Potawatomi | 198 | 0.0% |
| Pueblo | 328 | 0.0% |
| Puerto Rican | 120,765 | 1.1% |
| Puget Sound Salish | 16 | 0.0% |
| Romanian | 10,256 | 0.1% |
| Russian | 40,593 | 0.4% |
| Salvadoran | 60,323 | 0.6% |
| Samoan | 2,795 | 0.0% |
| Scandinavian | 21,856 | 0.2% |
| Scotch-Irish | 213,857 | 2.0% |
| Scottish | 229,601 | 2.2% |
| Seminole | 998 | 0.0% |
| Senegalese | 2,054 | 0.0% |
| Serbian | 2,245 | 0.0% |
| Shoshone | 216 | 0.0% |
| Sierra Leonean | 1,058 | 0.0% |
| Sioux | 1,873 | 0.0% |
| Slavic | 3,892 | 0.0% |
| Slovak | 12,416 | 0.1% |
| Slovene | 2,834 | 0.0% |
| Somali | 1,218 | 0.0% |
| South African | 3,150 | 0.0% |
| South American | 78,823 | 0.7% |
| South American Indian | 1,376 | 0.0% |
| Spaniard | 13,884 | 0.1% |
| Spanish | 10,639 | 0.1% |
| Spanish American | 250 | 0.0% |
| Spanish American Indian | 20 | 0.0% |
| Sri Lankan | 41,677 | 0.4% |
| Subsaharan African | 132,815 | 1.3% |
| Sudanese | 2,624 | 0.0% |
| Swedish | 54,970 | 0.5% |
| Swiss | 17,006 | 0.2% |
| Syrian | 2,931 | 0.0% |
| Taiwanese | 103 | 0.0% |
| Thai | 124,397 | 1.2% |
| Tlingit-Haida | 197 | 0.0% |
| Tohono O'Odham | 56 | 0.0% |
| Tongan | 306 | 0.0% |
| Trinidadian and Tobagonian | 3,014 | 0.0% |
| Tsimshian | 31 | 0.0% |
| Turkish | 5,200 | 0.1% |
| U.S. Virgin Islander | 710 | 0.0% |
| Ugandan | 641 | 0.0% |
| Ukrainian | 21,493 | 0.2% |
| Uruguayan | 1,696 | 0.0% |
| Ute | 70 | 0.0% |
| Venezuelan | 12,140 | 0.1% |
| Vietnamese | 1,683 | 0.0% |
| Welsh | 56,735 | 0.5% |
| West Indian | 7,634 | 0.1% |
| Yakama | 21 | 0.0% |
| Yaqui | 120 | 0.0% |
| Yugoslavian | 3,179 | 0.0% |
| Yuman | 77 | 0.0% |
| Yup'ik | 197 | 0.0% |
| Zimbabwean | 382 | 0.0% | View All 198 Rows |
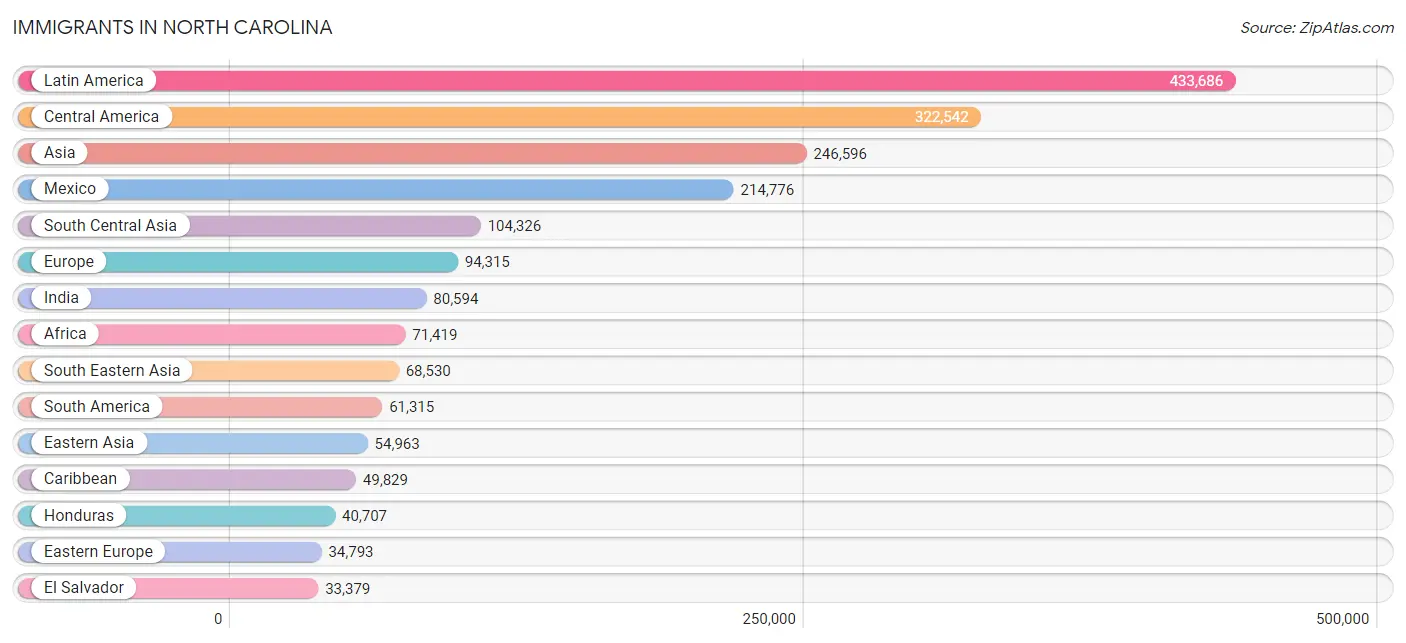
Immigrants in North Carolina
The most numerous immigrant groups reported in North Carolina came from Latin America (433,686 | 4.1%), Central America (322,542 | 3.1%), Asia (246,596 | 2.4%), Mexico (214,776 | 2.1%), and South Central Asia (104,326 | 1.0%), together accounting for 12.6% of all North Carolina residents.
| Immigration Origin | # Population | % Population |
| Afghanistan | 1,745 | 0.0% |
| Africa | 71,419 | 0.7% |
| Albania | 699 | 0.0% |
| Argentina | 3,710 | 0.0% |
| Armenia | 201 | 0.0% |
| Asia | 246,596 | 2.4% |
| Australia | 1,599 | 0.0% |
| Austria | 635 | 0.0% |
| Azores | 72 | 0.0% |
| Bahamas | 1,108 | 0.0% |
| Bangladesh | 1,797 | 0.0% |
| Barbados | 1,125 | 0.0% |
| Belarus | 1,097 | 0.0% |
| Belgium | 904 | 0.0% |
| Belize | 359 | 0.0% |
| Bolivia | 612 | 0.0% |
| Bosnia and Herzegovina | 1,868 | 0.0% |
| Brazil | 8,426 | 0.1% |
| Bulgaria | 1,135 | 0.0% |
| Cabo Verde | 103 | 0.0% |
| Cambodia | 2,583 | 0.0% |
| Cameroon | 1,536 | 0.0% |
| Canada | 18,105 | 0.2% |
| Caribbean | 49,829 | 0.5% |
| Central America | 322,542 | 3.1% |
| Chile | 2,274 | 0.0% |
| China | 32,948 | 0.3% |
| Colombia | 18,275 | 0.2% |
| Congo | 3,108 | 0.0% |
| Costa Rica | 3,066 | 0.0% |
| Croatia | 554 | 0.0% |
| Cuba | 9,005 | 0.1% |
| Czechoslovakia | 1,445 | 0.0% |
| Denmark | 701 | 0.0% |
| Dominica | 859 | 0.0% |
| Dominican Republic | 15,135 | 0.1% |
| Eastern Africa | 16,285 | 0.2% |
| Eastern Asia | 54,963 | 0.5% |
| Eastern Europe | 34,793 | 0.3% |
| Ecuador | 7,765 | 0.1% |
| Egypt | 4,847 | 0.1% |
| El Salvador | 33,379 | 0.3% |
| England | 10,140 | 0.1% |
| Eritrea | 1,716 | 0.0% |
| Ethiopia | 4,296 | 0.0% |
| Europe | 94,315 | 0.9% |
| Fiji | 104 | 0.0% |
| France | 3,292 | 0.0% |
| Germany | 15,534 | 0.2% |
| Ghana | 4,233 | 0.0% |
| Greece | 2,520 | 0.0% |
| Grenada | 752 | 0.0% |
| Guatemala | 22,964 | 0.2% |
| Guyana | 2,465 | 0.0% |
| Haiti | 5,018 | 0.1% |
| Honduras | 40,707 | 0.4% |
| Hong Kong | 1,947 | 0.0% |
| Hungary | 1,491 | 0.0% |
| India | 80,594 | 0.8% |
| Indonesia | 1,923 | 0.0% |
| Iran | 4,378 | 0.0% |
| Iraq | 2,149 | 0.0% |
| Ireland | 1,974 | 0.0% |
| Israel | 994 | 0.0% |
| Italy | 4,315 | 0.0% |
| Jamaica | 11,419 | 0.1% |
| Japan | 5,941 | 0.1% |
| Jordan | 2,167 | 0.0% |
| Kazakhstan | 698 | 0.0% |
| Kenya | 4,309 | 0.0% |
| Korea | 15,988 | 0.2% |
| Kuwait | 903 | 0.0% |
| Laos | 4,983 | 0.1% |
| Latin America | 433,686 | 4.1% |
| Latvia | 552 | 0.0% |
| Lebanon | 2,422 | 0.0% |
| Liberia | 4,475 | 0.0% |
| Lithuania | 355 | 0.0% |
| Malaysia | 2,184 | 0.0% |
| Mexico | 214,776 | 2.1% |
| Micronesia | 298 | 0.0% |
| Middle Africa | 9,446 | 0.1% |
| Moldova | 1,824 | 0.0% |
| Morocco | 2,820 | 0.0% |
| Nepal | 5,372 | 0.1% |
| Netherlands | 1,461 | 0.0% |
| Nicaragua | 4,128 | 0.0% |
| Nigeria | 9,173 | 0.1% |
| North Macedonia | 116 | 0.0% |
| Northern Africa | 11,401 | 0.1% |
| Northern Europe | 26,679 | 0.3% |
| Norway | 389 | 0.0% |
| Oceania | 3,499 | 0.0% |
| Pakistan | 6,226 | 0.1% |
| Panama | 3,031 | 0.0% |
| Peru | 6,091 | 0.1% |
| Philippines | 20,695 | 0.2% |
| Poland | 3,607 | 0.0% |
| Portugal | 903 | 0.0% |
| Romania | 3,093 | 0.0% |
| Russia | 8,067 | 0.1% |
| Saudi Arabia | 1,080 | 0.0% |
| Scotland | 1,464 | 0.0% |
| Senegal | 1,555 | 0.0% |
| Serbia | 317 | 0.0% |
| Sierra Leone | 1,485 | 0.0% |
| Singapore | 491 | 0.0% |
| Somalia | 1,010 | 0.0% |
| South Africa | 4,673 | 0.0% |
| South America | 61,315 | 0.6% |
| South Central Asia | 104,326 | 1.0% |
| South Eastern Asia | 68,530 | 0.6% |
| Southern Europe | 10,084 | 0.1% |
| Spain | 2,183 | 0.0% |
| Sri Lanka | 1,029 | 0.0% |
| St. Vincent and the Grenadines | 169 | 0.0% |
| Sudan | 2,638 | 0.0% |
| Sweden | 1,544 | 0.0% |
| Switzerland | 575 | 0.0% |
| Syria | 1,332 | 0.0% |
| Taiwan | 3,524 | 0.0% |
| Thailand | 6,161 | 0.1% |
| Trinidad and Tobago | 3,587 | 0.0% |
| Turkey | 2,997 | 0.0% |
| Uganda | 1,162 | 0.0% |
| Ukraine | 6,645 | 0.1% |
| Uruguay | 998 | 0.0% |
| Uzbekistan | 639 | 0.0% |
| Venezuela | 9,986 | 0.1% |
| Vietnam | 24,965 | 0.2% |
| West Indies | 254 | 0.0% |
| Western Africa | 25,401 | 0.2% |
| Western Asia | 17,613 | 0.2% |
| Western Europe | 22,474 | 0.2% |
| Yemen | 1,937 | 0.0% |
| Zaire | 4,046 | 0.0% |
| Zimbabwe | 1,323 | 0.0% | View All 137 Rows |
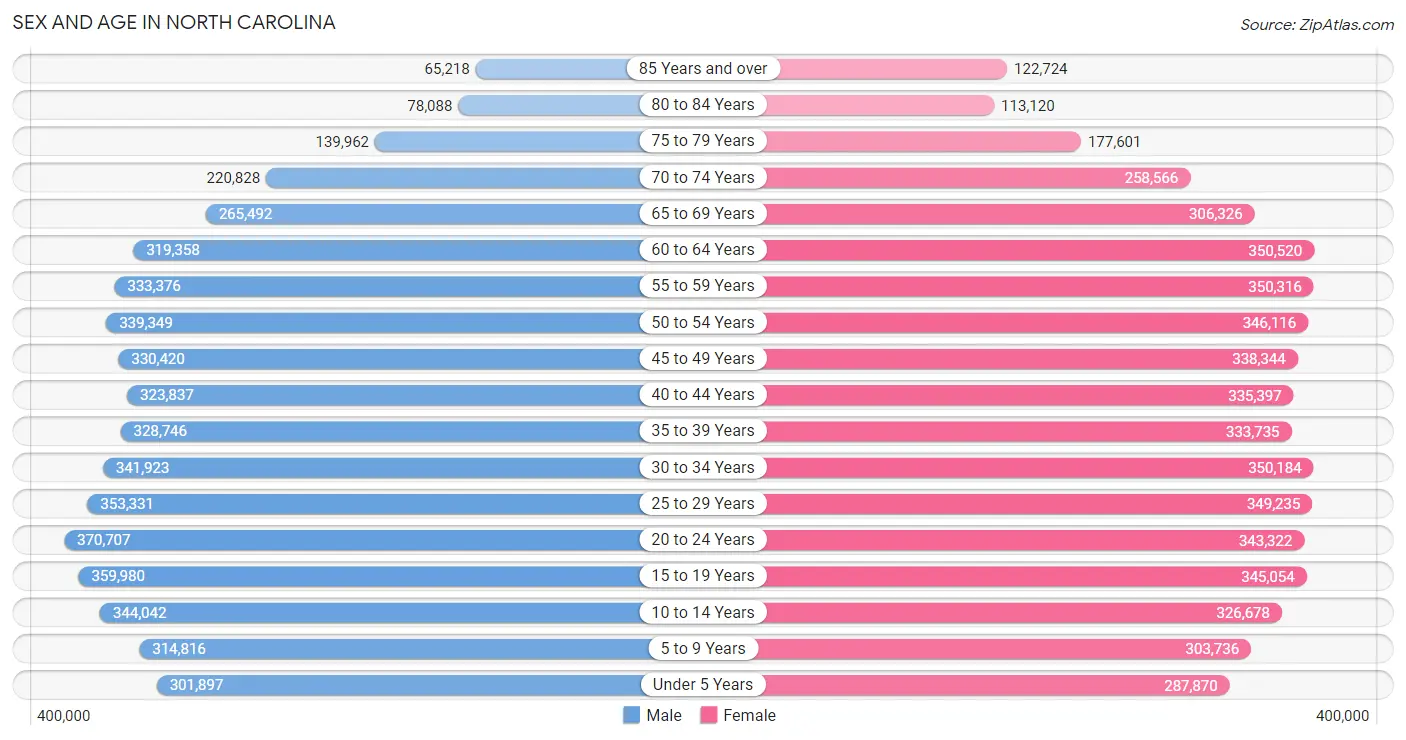
Sex and Age in North Carolina
Sex and Age in North Carolina
The most populous age groups in North Carolina are 20 to 24 Years (370,707 | 7.2%) for men and 60 to 64 Years (350,520 | 6.6%) for women.
| Age Bracket | Male | Female |
| Under 5 Years | 301,897 (5.9%) | 287,870 (5.4%) |
| 5 to 9 Years | 314,816 (6.1%) | 303,736 (5.7%) |
| 10 to 14 Years | 344,042 (6.7%) | 326,678 (6.1%) |
| 15 to 19 Years | 359,980 (7.0%) | 345,054 (6.5%) |
| 20 to 24 Years | 370,707 (7.2%) | 343,322 (6.4%) |
| 25 to 29 Years | 353,331 (6.9%) | 349,235 (6.5%) |
| 30 to 34 Years | 341,923 (6.7%) | 350,184 (6.6%) |
| 35 to 39 Years | 328,746 (6.4%) | 333,735 (6.2%) |
| 40 to 44 Years | 323,837 (6.3%) | 335,397 (6.3%) |
| 45 to 49 Years | 330,420 (6.4%) | 338,344 (6.3%) |
| 50 to 54 Years | 339,349 (6.6%) | 346,116 (6.5%) |
| 55 to 59 Years | 333,376 (6.5%) | 350,316 (6.6%) |
| 60 to 64 Years | 319,358 (6.2%) | 350,520 (6.6%) |
| 65 to 69 Years | 265,492 (5.2%) | 306,326 (5.7%) |
| 70 to 74 Years | 220,828 (4.3%) | 258,566 (4.8%) |
| 75 to 79 Years | 139,962 (2.7%) | 177,601 (3.3%) |
| 80 to 84 Years | 78,088 (1.5%) | 113,120 (2.1%) |
| 85 Years and over | 65,218 (1.3%) | 122,724 (2.3%) |
| Total | 5,131,370 (100.0%) | 5,338,844 (100.0%) |
Families and Households in North Carolina
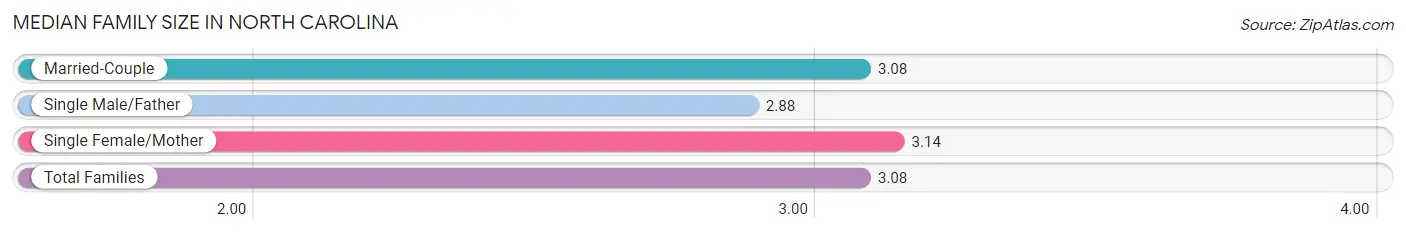
Median Family Size in North Carolina
The median family size in North Carolina is 3.08 persons per family, with single female/mother families (519,027 | 19.6%) accounting for the largest median family size of 3.14 persons per family. On the other hand, single male/father families (181,966 | 6.9%) represent the smallest median family size with 2.88 persons per family.
| Family Type | # Families | Family Size |
| Married-Couple | 1,952,436 (73.6%) | 3.08 |
| Single Male/Father | 181,966 (6.9%) | 2.88 |
| Single Female/Mother | 519,027 (19.6%) | 3.14 |
| Total Families | 2,653,429 (100.0%) | 3.08 |
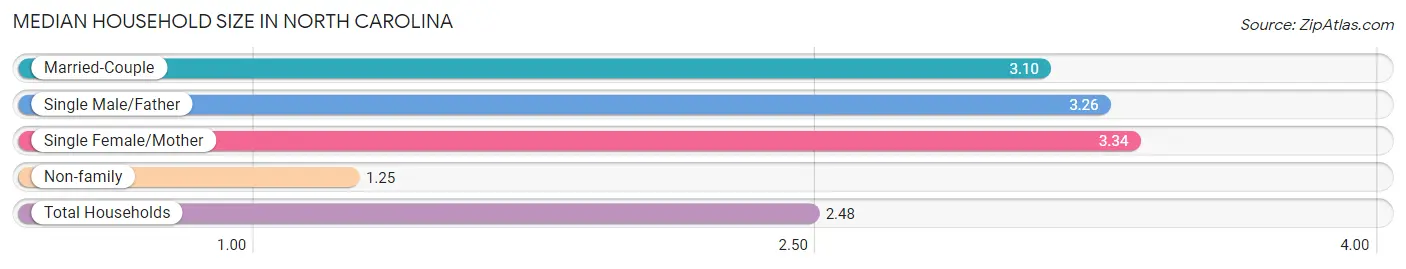
Median Household Size in North Carolina
The median household size in North Carolina is 2.48 persons per household, with single female/mother households (519,027 | 12.6%) accounting for the largest median household size of 3.34 persons per household. non-family households (1,451,803 | 35.4%) represent the smallest median household size with 1.25 persons per household.
| Household Type | # Households | Household Size |
| Married-Couple | 1,952,436 (47.6%) | 3.10 |
| Single Male/Father | 181,966 (4.4%) | 3.26 |
| Single Female/Mother | 519,027 (12.6%) | 3.34 |
| Non-family | 1,451,803 (35.4%) | 1.25 |
| Total Households | 4,105,232 (100.0%) | 2.48 |
Household Size by Marriage Status in North Carolina
Out of a total of 4,105,232 households in North Carolina, 2,653,429 (64.6%) are family households, while 1,451,803 (35.4%) are nonfamily households. The most numerous type of family households are 2-person households, comprising 1,250,778, and the most common type of nonfamily households are 1-person households, comprising 1,192,569.
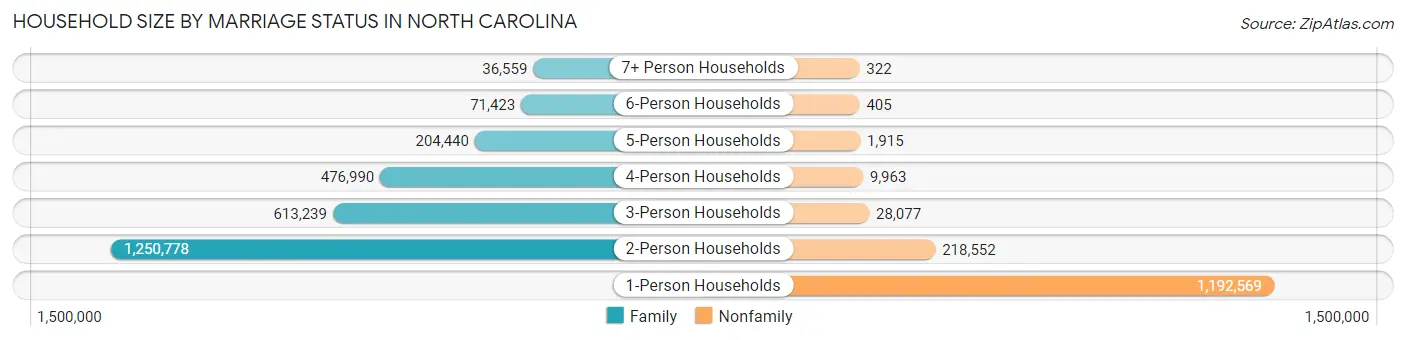
| Household Size | Family Households | Nonfamily Households |
| 1-Person Households | - | 1,192,569 (29.0%) |
| 2-Person Households | 1,250,778 (30.5%) | 218,552 (5.3%) |
| 3-Person Households | 613,239 (14.9%) | 28,077 (0.7%) |
| 4-Person Households | 476,990 (11.6%) | 9,963 (0.2%) |
| 5-Person Households | 204,440 (5.0%) | 1,915 (0.1%) |
| 6-Person Households | 71,423 (1.7%) | 405 (0.0%) |
| 7+ Person Households | 36,559 (0.9%) | 322 (0.0%) |
| Total | 2,653,429 (64.6%) | 1,451,803 (35.4%) |
Female Fertility in North Carolina
Fertility by Age in North Carolina
Average fertility rate in North Carolina is 50.0 births per 1,000 women. Women in the age bracket of 20 to 34 years have the highest fertility rate with 88.0 births per 1,000 women. Women in the age bracket of 20 to 34 years acount for 73.3% of all women with births.
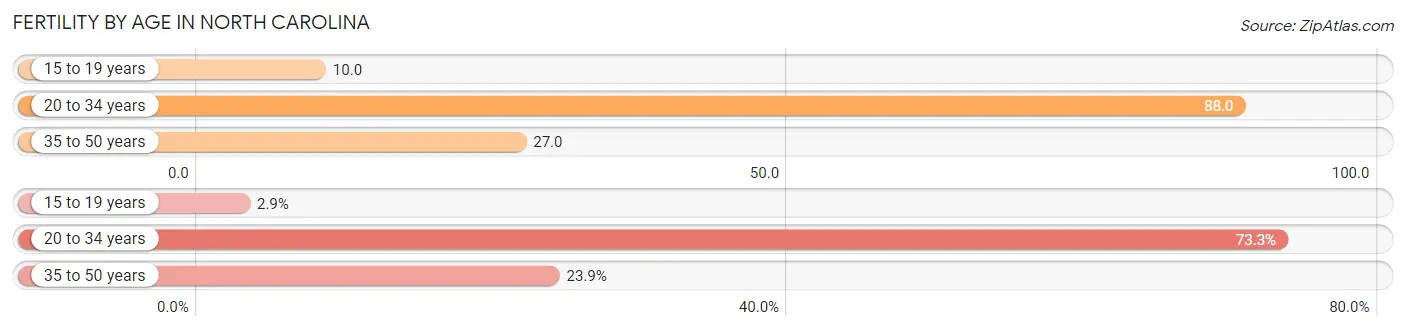
| Age Bracket | Women with Births | Births / 1,000 Women |
| 15 to 19 years | 3,548 (2.9%) | 10.0 |
| 20 to 34 years | 91,245 (73.3%) | 88.0 |
| 35 to 50 years | 29,698 (23.9%) | 27.0 |
| Total | 124,491 (100.0%) | 50.0 |
Fertility by Age by Marriage Status in North Carolina
65.4% of women with births (124,491) in North Carolina are married. The highest percentage of unmarried women with births falls into 15 to 19 years age bracket with 81.9% of them unmarried at the time of birth, while the lowest percentage of unmarried women with births belong to 35 to 50 years age bracket with 19.1% of them unmarried.
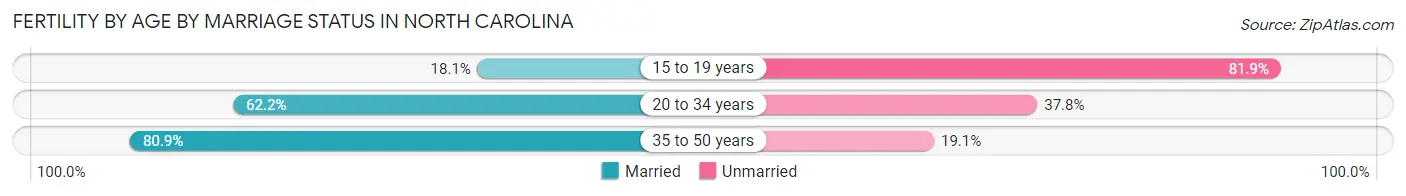
| Age Bracket | Married | Unmarried |
| 15 to 19 years | 642 (18.1%) | 2,906 (81.9%) |
| 20 to 34 years | 56,754 (62.2%) | 34,491 (37.8%) |
| 35 to 50 years | 24,026 (80.9%) | 5,672 (19.1%) |
| Total | 81,417 (65.4%) | 43,074 (34.6%) |
Fertility by Education in North Carolina
Average fertility rate in North Carolina is 50.0 births per 1,000 women. Women with the education attainment of high school diploma have the highest fertility rate of 59.0 births per 1,000 women, while women with the education attainment of less than high school have the lowest fertility at 31.0 births per 1,000 women. Women with the education attainment of college or associate's degree represent 32.5% of all women with births.
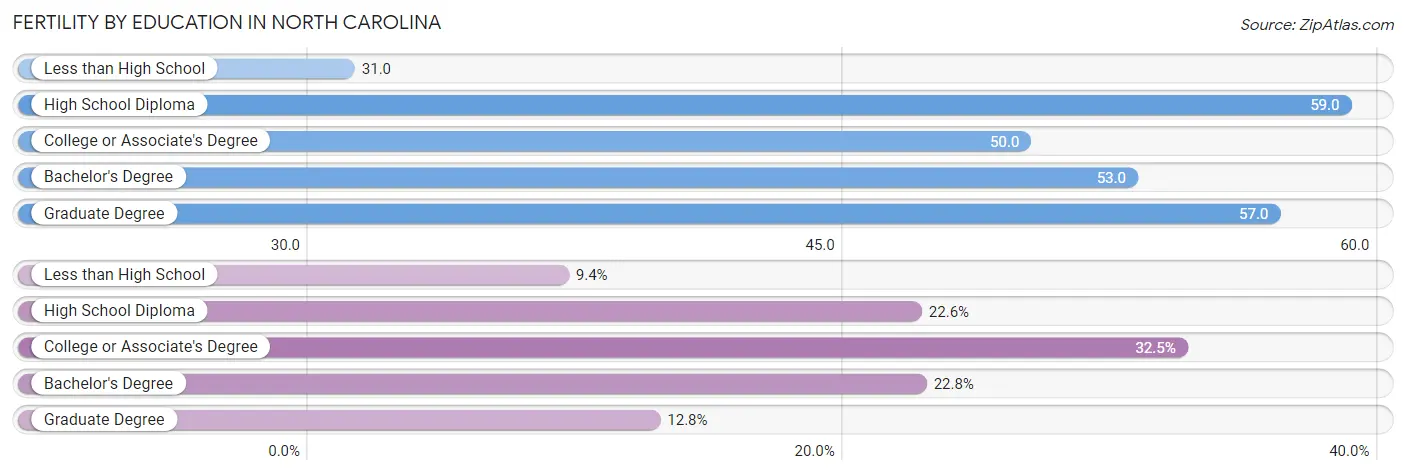
| Educational Attainment | Women with Births | Births / 1,000 Women |
| Less than High School | 11,641 (9.3%) | 31.0 |
| High School Diploma | 28,105 (22.6%) | 59.0 |
| College or Associate's Degree | 40,497 (32.5%) | 50.0 |
| Bachelor's Degree | 28,337 (22.8%) | 53.0 |
| Graduate Degree | 15,911 (12.8%) | 57.0 |
| Total | 124,491 (100.0%) | 50.0 |
Fertility by Education by Marriage Status in North Carolina
34.6% of women with births in North Carolina are unmarried. Women with the educational attainment of graduate degree are most likely to be married with 92.6% of them married at childbirth, while women with the educational attainment of less than high school are least likely to be married with 58.5% of them unmarried at childbirth.
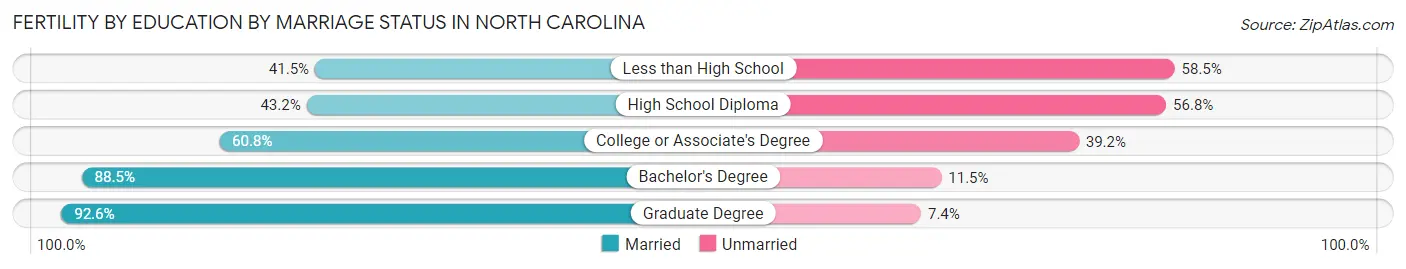
| Educational Attainment | Married | Unmarried |
| Less than High School | 4,831 (41.5%) | 6,810 (58.5%) |
| High School Diploma | 12,141 (43.2%) | 15,964 (56.8%) |
| College or Associate's Degree | 24,622 (60.8%) | 15,875 (39.2%) |
| Bachelor's Degree | 25,078 (88.5%) | 3,259 (11.5%) |
| Graduate Degree | 14,734 (92.6%) | 1,177 (7.4%) |
| Total | 81,417 (65.4%) | 43,074 (34.6%) |
Employment Characteristics in North Carolina
Employment by Class of Employer in North Carolina
Among the 4,919,645 employed individuals in North Carolina, private company employees (3,332,472 | 67.7%), not-for-profit organizations (356,277 | 7.2%), and local government employees (292,220 | 5.9%) make up the most common classes of employment.
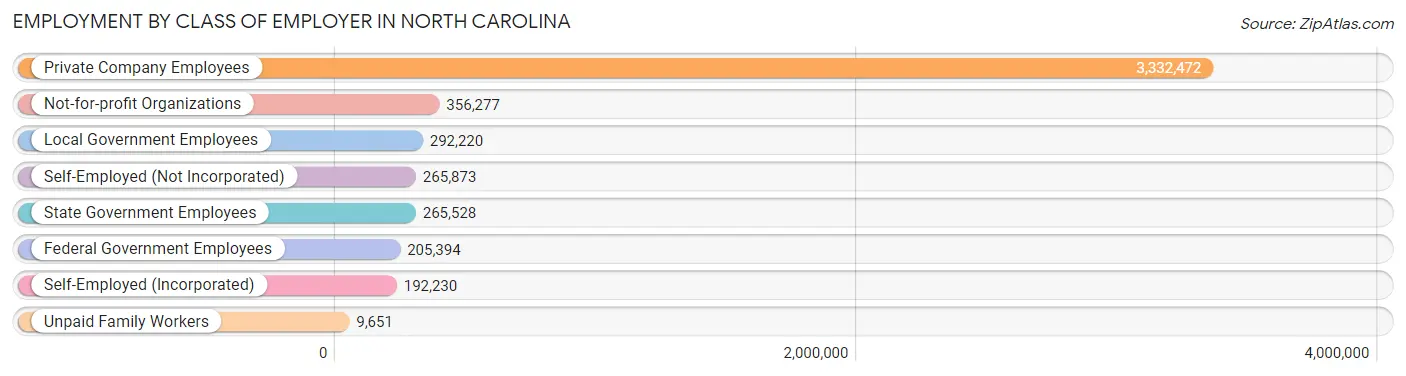
| Employer Class | # Employees | % Employees |
| Private Company Employees | 3,332,472 | 67.7% |
| Self-Employed (Incorporated) | 192,230 | 3.9% |
| Self-Employed (Not Incorporated) | 265,873 | 5.4% |
| Not-for-profit Organizations | 356,277 | 7.2% |
| Local Government Employees | 292,220 | 5.9% |
| State Government Employees | 265,528 | 5.4% |
| Federal Government Employees | 205,394 | 4.2% |
| Unpaid Family Workers | 9,651 | 0.2% |
| Total | 4,919,645 | 100.0% |
Employment Status by Age in North Carolina
According to the labor force statistics for North Carolina, out of the total population over 16 years of age (8,454,147), 62.6% or 5,292,296 individuals are in the labor force, with 5.1% or 269,907 of them unemployed. The age group with the highest labor force participation rate is 25 to 29 years, with 84.2% or 591,561 individuals in the labor force. Within the labor force, the 16 to 19 years age range has the highest percentage of unemployed individuals, with 15.5% or 35,657 of them being unemployed.
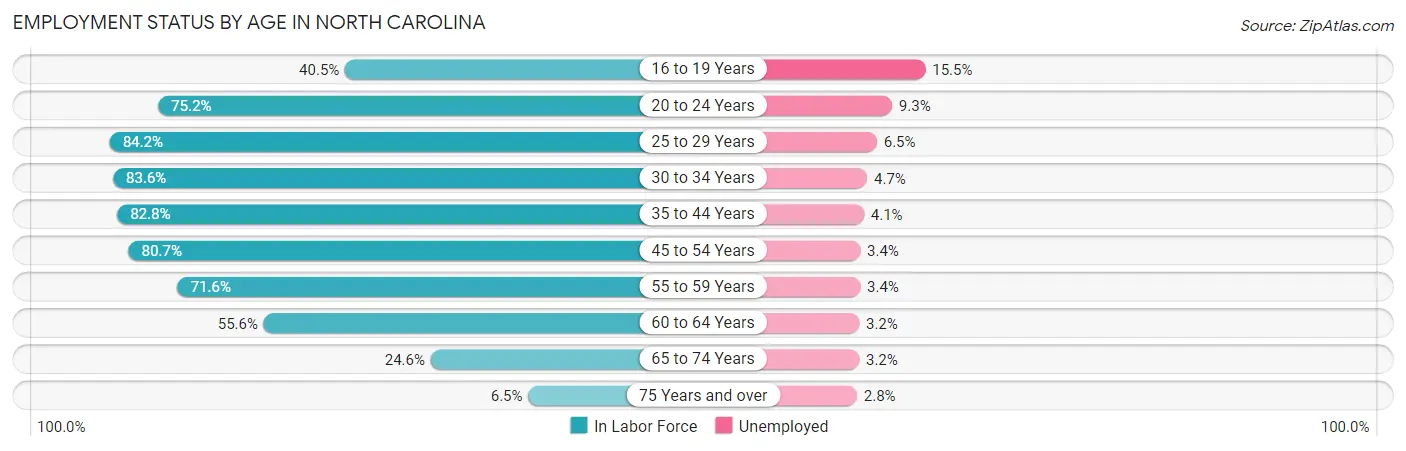
| Age Bracket | In Labor Force | Unemployed |
| 16 to 19 Years | 230,042 (40.5%) | 35,657 (15.5%) |
| 20 to 24 Years | 536,950 (75.2%) | 49,936 (9.3%) |
| 25 to 29 Years | 591,561 (84.2%) | 38,451 (6.5%) |
| 30 to 34 Years | 578,601 (83.6%) | 27,194 (4.7%) |
| 35 to 44 Years | 1,094,380 (82.8%) | 44,870 (4.1%) |
| 45 to 54 Years | 1,092,863 (80.7%) | 37,157 (3.4%) |
| 55 to 59 Years | 489,523 (71.6%) | 16,644 (3.4%) |
| 60 to 64 Years | 372,452 (55.6%) | 11,918 (3.2%) |
| 65 to 74 Years | 258,598 (24.6%) | 8,275 (3.2%) |
| 75 Years and over | 45,286 (6.5%) | 1,268 (2.8%) |
| Total | 5,292,296 (62.6%) | 269,907 (5.1%) |
Employment Status by Educational Attainment in North Carolina
According to labor force statistics for North Carolina, 77.8% of individuals (4,220,017) out of the total population between 25 and 64 years of age (5,424,187) are in the labor force, with 4.2% or 177,241 of them being unemployed. The group with the highest labor force participation rate are those with the educational attainment of bachelor's degree or higher, with 86.2% or 1,660,733 individuals in the labor force. Within the labor force, individuals with less than high school education have the highest percentage of unemployment, with 7.6% or 23,924 of them being unemployed.
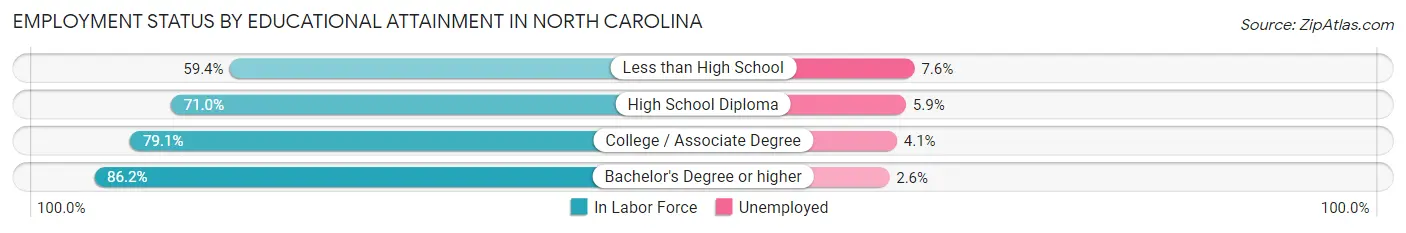
| Educational Attainment | In Labor Force | Unemployed |
| Less than High School | 314,790 (59.4%) | 40,276 (7.6%) |
| High School Diploma | 910,122 (71.0%) | 75,630 (5.9%) |
| College / Associate Degree | 1,333,446 (79.1%) | 69,117 (4.1%) |
| Bachelor's Degree or higher | 1,660,733 (86.2%) | 50,092 (2.6%) |
| Total | 4,220,017 (77.8%) | 227,816 (4.2%) |
Employment Occupations by Sex in North Carolina
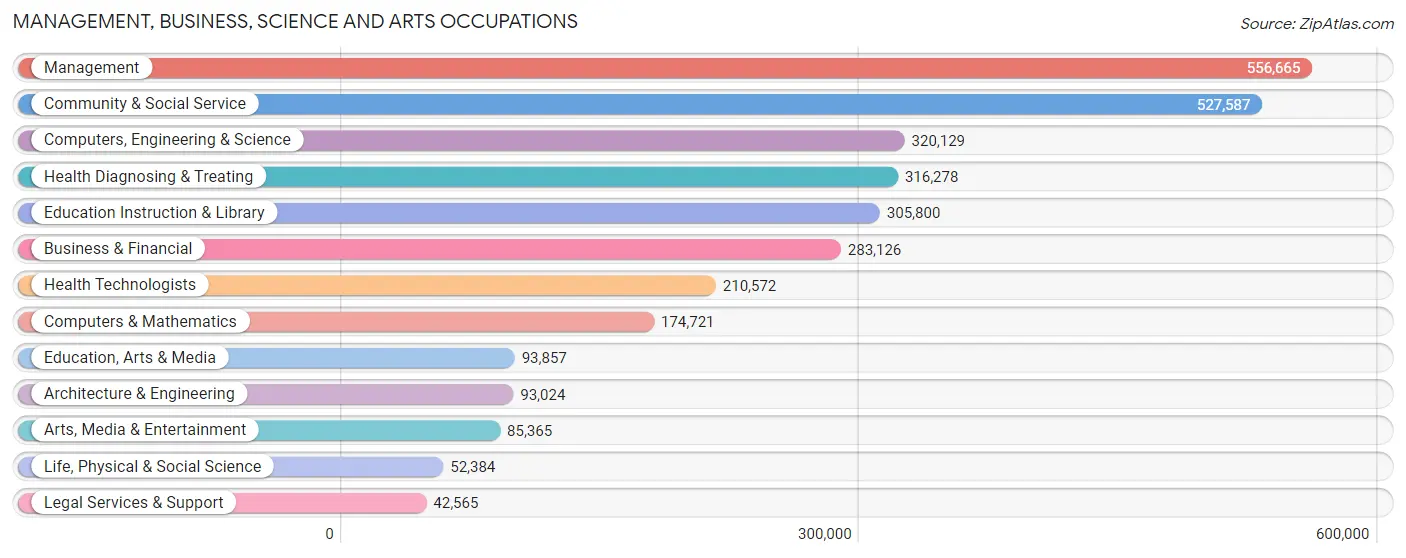
Management, Business, Science and Arts Occupations
The most common Management, Business, Science and Arts occupations in North Carolina are Management (556,665 | 11.3%), Community & Social Service (527,587 | 10.7%), Computers, Engineering & Science (320,129 | 6.5%), Health Diagnosing & Treating (316,278 | 6.4%), and Education Instruction & Library (305,800 | 6.2%).
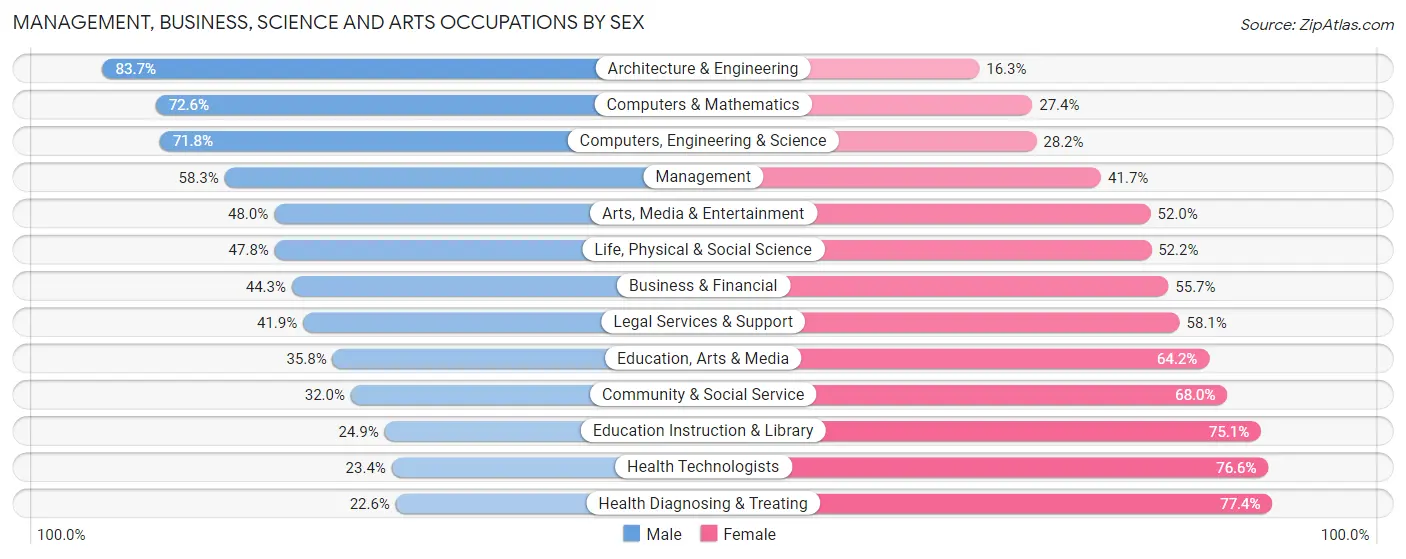
Management, Business, Science and Arts Occupations by Sex
Within the Management, Business, Science and Arts occupations in North Carolina, the most male-oriented occupations are Architecture & Engineering (83.7%), Computers & Mathematics (72.6%), and Computers, Engineering & Science (71.8%), while the most female-oriented occupations are Health Diagnosing & Treating (77.4%), Health Technologists (76.6%), and Education Instruction & Library (75.1%).
| Occupation | Male | Female |
| Management | 324,425 (58.3%) | 232,240 (41.7%) |
| Business & Financial | 125,320 (44.3%) | 157,806 (55.7%) |
| Computers, Engineering & Science | 229,840 (71.8%) | 90,289 (28.2%) |
| Computers & Mathematics | 126,909 (72.6%) | 47,812 (27.4%) |
| Architecture & Engineering | 77,873 (83.7%) | 15,151 (16.3%) |
| Life, Physical & Social Science | 25,058 (47.8%) | 27,326 (52.2%) |
| Community & Social Service | 168,591 (32.0%) | 358,996 (68.0%) |
| Education, Arts & Media | 33,560 (35.8%) | 60,297 (64.2%) |
| Legal Services & Support | 17,843 (41.9%) | 24,722 (58.1%) |
| Education Instruction & Library | 76,243 (24.9%) | 229,557 (75.1%) |
| Arts, Media & Entertainment | 40,945 (48.0%) | 44,420 (52.0%) |
| Health Diagnosing & Treating | 71,457 (22.6%) | 244,821 (77.4%) |
| Health Technologists | 49,338 (23.4%) | 161,234 (76.6%) |
| Total (Category) | 919,633 (45.9%) | 1,084,152 (54.1%) |
| Total (Overall) | 2,553,895 (51.8%) | 2,371,605 (48.1%) |
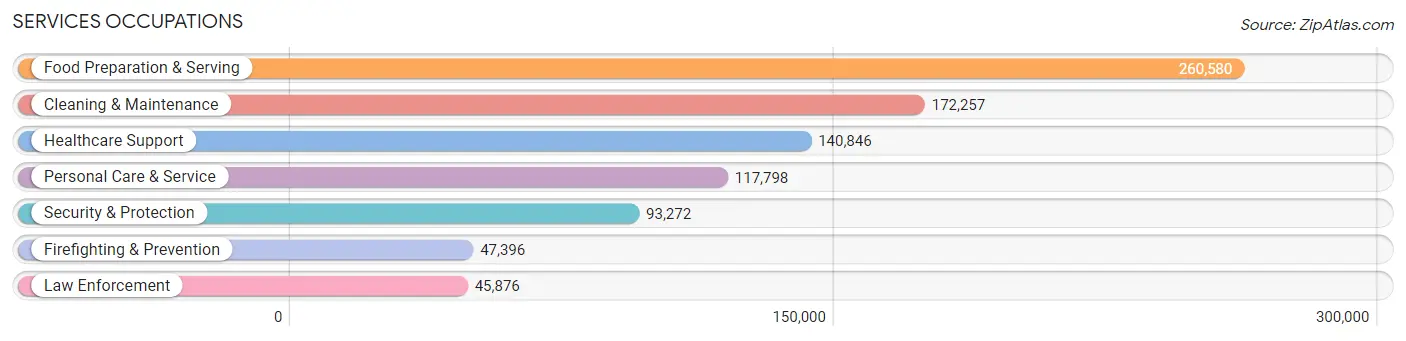
Services Occupations
The most common Services occupations in North Carolina are Food Preparation & Serving (260,580 | 5.3%), Cleaning & Maintenance (172,257 | 3.5%), Healthcare Support (140,846 | 2.9%), Personal Care & Service (117,798 | 2.4%), and Security & Protection (93,272 | 1.9%).
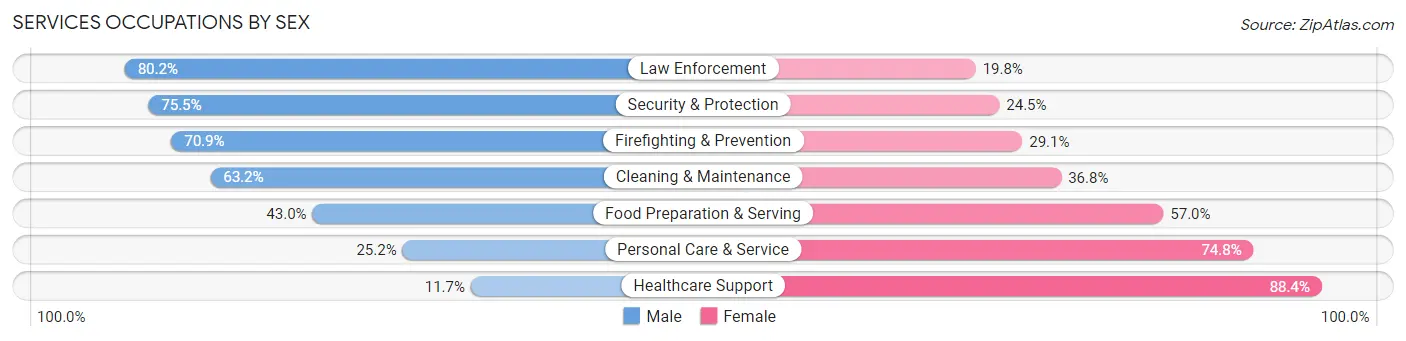
Services Occupations by Sex
Within the Services occupations in North Carolina, the most male-oriented occupations are Law Enforcement (80.2%), Security & Protection (75.5%), and Firefighting & Prevention (70.9%), while the most female-oriented occupations are Healthcare Support (88.3%), Personal Care & Service (74.8%), and Food Preparation & Serving (57.0%).
| Occupation | Male | Female |
| Healthcare Support | 16,413 (11.7%) | 124,433 (88.3%) |
| Security & Protection | 70,402 (75.5%) | 22,870 (24.5%) |
| Firefighting & Prevention | 33,625 (70.9%) | 13,771 (29.1%) |
| Law Enforcement | 36,777 (80.2%) | 9,099 (19.8%) |
| Food Preparation & Serving | 112,085 (43.0%) | 148,495 (57.0%) |
| Cleaning & Maintenance | 108,912 (63.2%) | 63,345 (36.8%) |
| Personal Care & Service | 29,647 (25.2%) | 88,151 (74.8%) |
| Total (Category) | 337,459 (43.0%) | 447,294 (57.0%) |
| Total (Overall) | 2,553,895 (51.8%) | 2,371,605 (48.1%) |
Sales and Office Occupations
The most common Sales and Office occupations in North Carolina are Office & Administration (502,313 | 10.2%), and Sales & Related (493,992 | 10.0%).
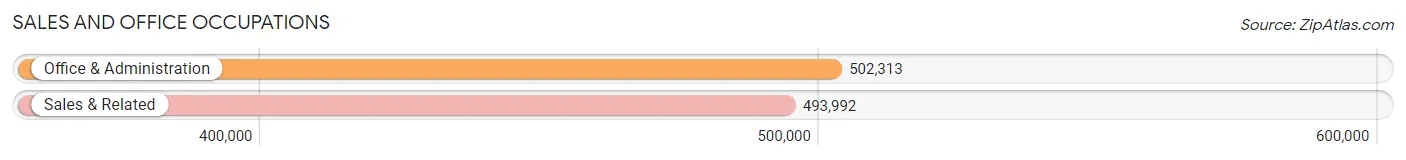
Sales and Office Occupations by Sex
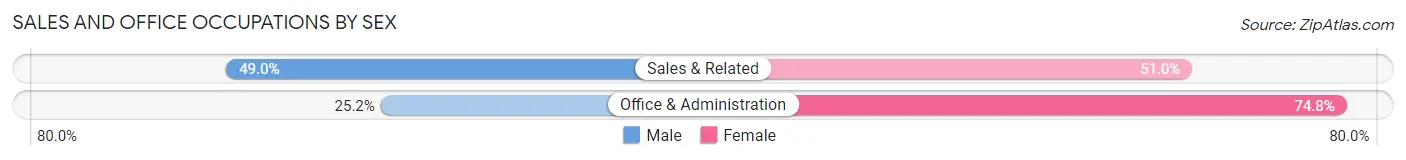
| Occupation | Male | Female |
| Sales & Related | 241,925 (49.0%) | 252,067 (51.0%) |
| Office & Administration | 126,717 (25.2%) | 375,596 (74.8%) |
| Total (Category) | 368,642 (37.0%) | 627,663 (63.0%) |
| Total (Overall) | 2,553,895 (51.8%) | 2,371,605 (48.1%) |
Natural Resources, Construction and Maintenance Occupations
The most common Natural Resources, Construction and Maintenance occupations in North Carolina are Construction & Extraction (247,259 | 5.0%), Installation, Maintenance & Repair (167,908 | 3.4%), and Farming, Fishing & Forestry (24,879 | 0.5%).
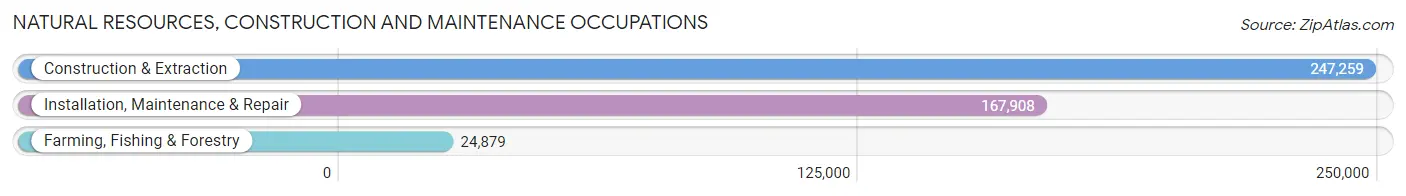
Natural Resources, Construction and Maintenance Occupations by Sex
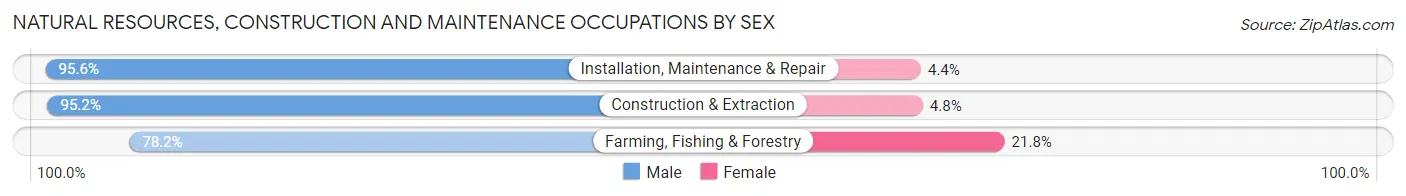
| Occupation | Male | Female |
| Farming, Fishing & Forestry | 19,459 (78.2%) | 5,420 (21.8%) |
| Construction & Extraction | 235,445 (95.2%) | 11,814 (4.8%) |
| Installation, Maintenance & Repair | 160,542 (95.6%) | 7,366 (4.4%) |
| Total (Category) | 415,446 (94.4%) | 24,600 (5.6%) |
| Total (Overall) | 2,553,895 (51.8%) | 2,371,605 (48.1%) |
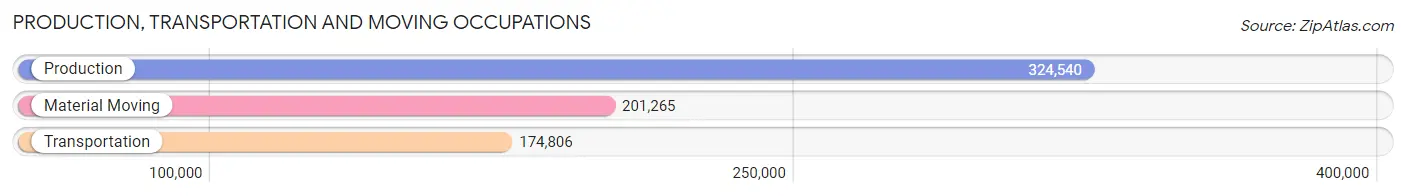
Production, Transportation and Moving Occupations
The most common Production, Transportation and Moving occupations in North Carolina are Production (324,540 | 6.6%), Material Moving (201,265 | 4.1%), and Transportation (174,806 | 3.5%).
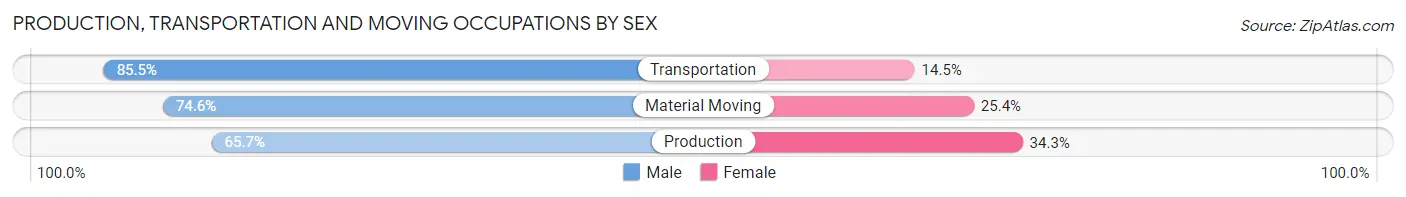
Production, Transportation and Moving Occupations by Sex
| Occupation | Male | Female |
| Production | 213,137 (65.7%) | 111,403 (34.3%) |
| Transportation | 149,416 (85.5%) | 25,390 (14.5%) |
| Material Moving | 150,162 (74.6%) | 51,103 (25.4%) |
| Total (Category) | 512,715 (73.2%) | 187,896 (26.8%) |
| Total (Overall) | 2,553,895 (51.8%) | 2,371,605 (48.1%) |
Employment Industries by Sex in North Carolina
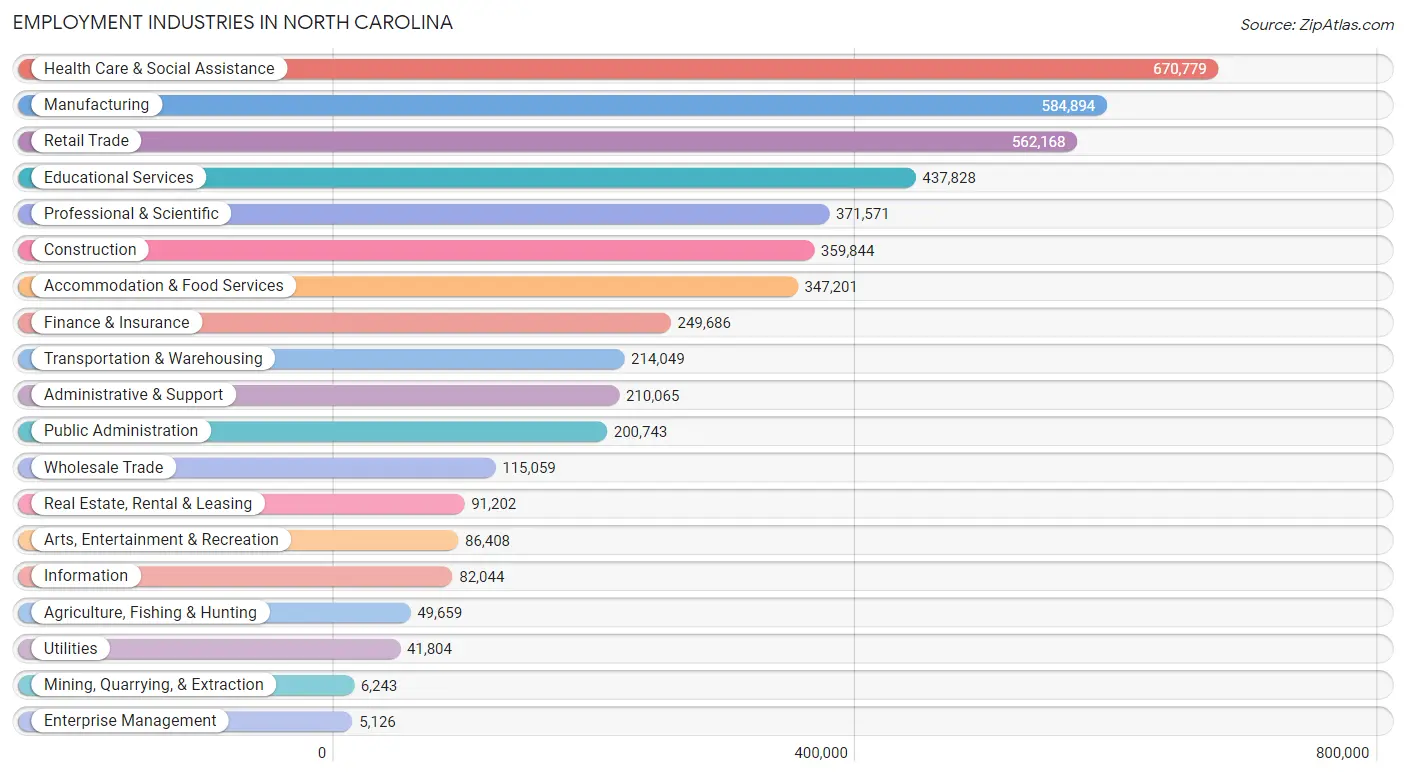
Employment Industries in North Carolina
The major employment industries in North Carolina include Health Care & Social Assistance (670,779 | 13.6%), Manufacturing (584,894 | 11.9%), Retail Trade (562,168 | 11.4%), Educational Services (437,828 | 8.9%), and Professional & Scientific (371,571 | 7.5%).
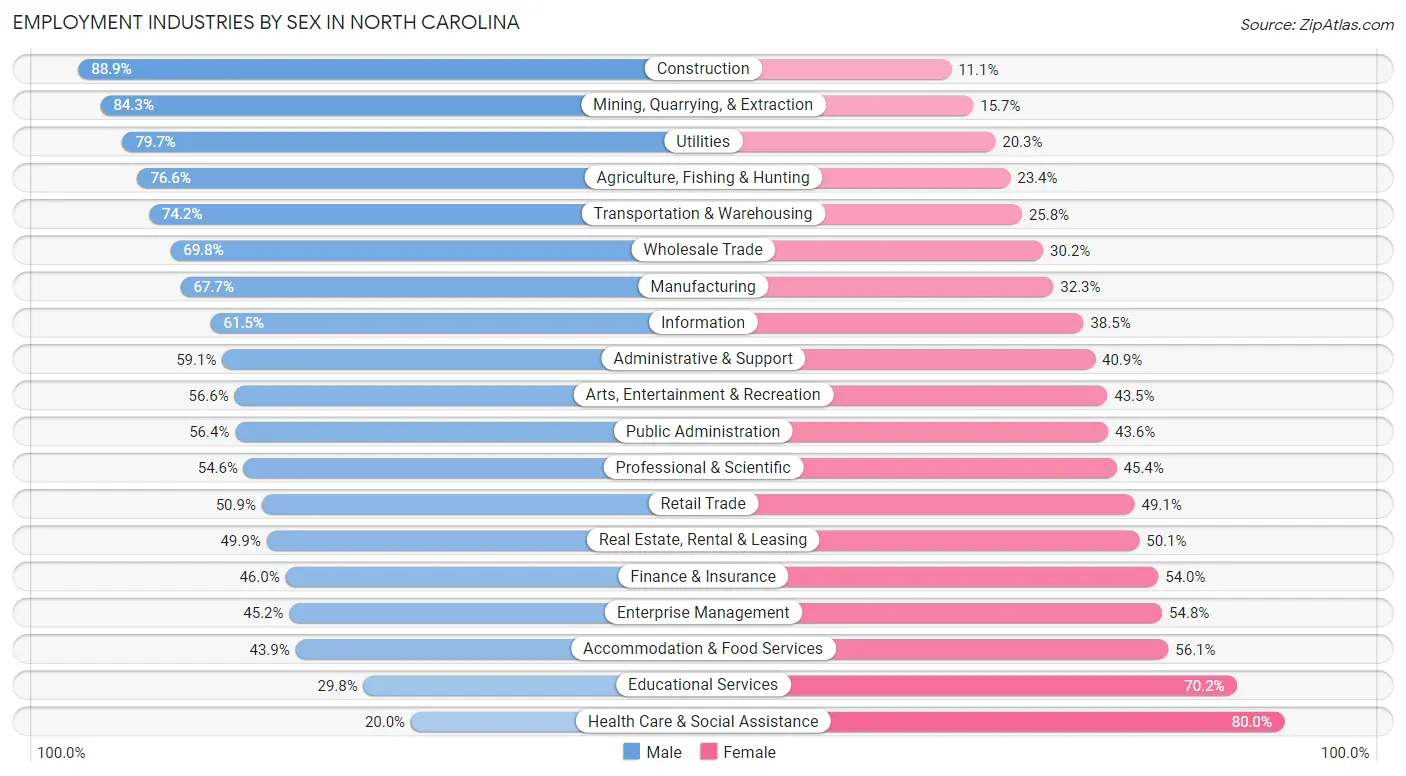
Employment Industries by Sex in North Carolina
The North Carolina industries that see more men than women are Construction (88.9%), Mining, Quarrying, & Extraction (84.3%), and Utilities (79.7%), whereas the industries that tend to have a higher number of women are Health Care & Social Assistance (80.0%), Educational Services (70.2%), and Accommodation & Food Services (56.1%).
| Industry | Male | Female |
| Agriculture, Fishing & Hunting | 38,052 (76.6%) | 11,607 (23.4%) |
| Mining, Quarrying, & Extraction | 5,262 (84.3%) | 981 (15.7%) |
| Construction | 319,749 (88.9%) | 40,095 (11.1%) |
| Manufacturing | 396,067 (67.7%) | 188,827 (32.3%) |
| Wholesale Trade | 80,348 (69.8%) | 34,711 (30.2%) |
| Retail Trade | 286,281 (50.9%) | 275,887 (49.1%) |
| Transportation & Warehousing | 158,865 (74.2%) | 55,184 (25.8%) |
| Utilities | 33,335 (79.7%) | 8,469 (20.3%) |
| Information | 50,452 (61.5%) | 31,592 (38.5%) |
| Finance & Insurance | 114,847 (46.0%) | 134,839 (54.0%) |
| Real Estate, Rental & Leasing | 45,540 (49.9%) | 45,662 (50.1%) |
| Professional & Scientific | 202,992 (54.6%) | 168,579 (45.4%) |
| Enterprise Management | 2,317 (45.2%) | 2,809 (54.8%) |
| Administrative & Support | 124,133 (59.1%) | 85,932 (40.9%) |
| Educational Services | 130,662 (29.8%) | 307,166 (70.2%) |
| Health Care & Social Assistance | 134,355 (20.0%) | 536,424 (80.0%) |
| Arts, Entertainment & Recreation | 48,867 (56.6%) | 37,541 (43.4%) |
| Accommodation & Food Services | 152,491 (43.9%) | 194,710 (56.1%) |
| Public Administration | 113,210 (56.4%) | 87,533 (43.6%) |
| Total | 2,553,895 (51.8%) | 2,371,605 (48.1%) |
Education in North Carolina
School Enrollment in North Carolina
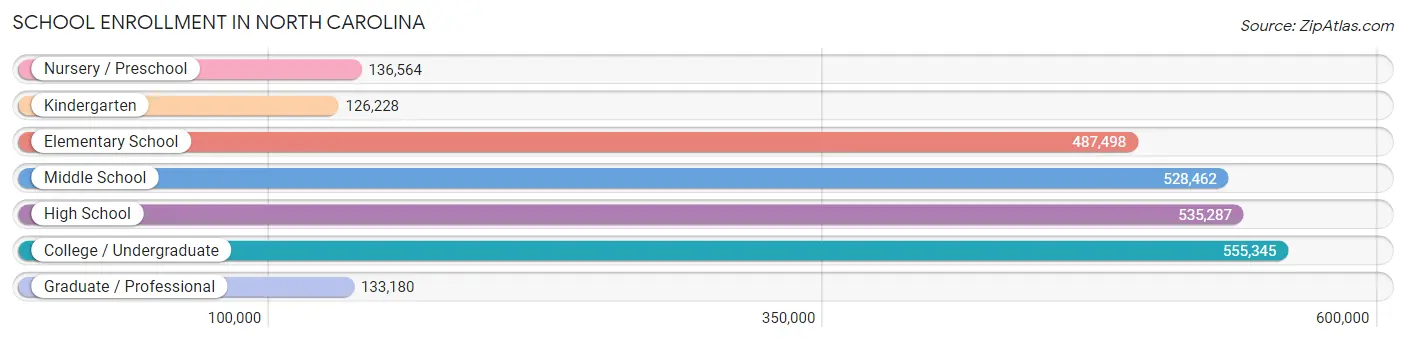
The most common levels of schooling among the 2,502,564 students in North Carolina are college / undergraduate (555,345 | 22.2%), high school (535,287 | 21.4%), and middle school (528,462 | 21.1%).
| School Level | # Students | % Students |
| Nursery / Preschool | 136,564 | 5.5% |
| Kindergarten | 126,228 | 5.0% |
| Elementary School | 487,498 | 19.5% |
| Middle School | 528,462 | 21.1% |
| High School | 535,287 | 21.4% |
| College / Undergraduate | 555,345 | 22.2% |
| Graduate / Professional | 133,180 | 5.3% |
| Total | 2,502,564 | 100.0% |
School Enrollment by Age by Funding Source in North Carolina
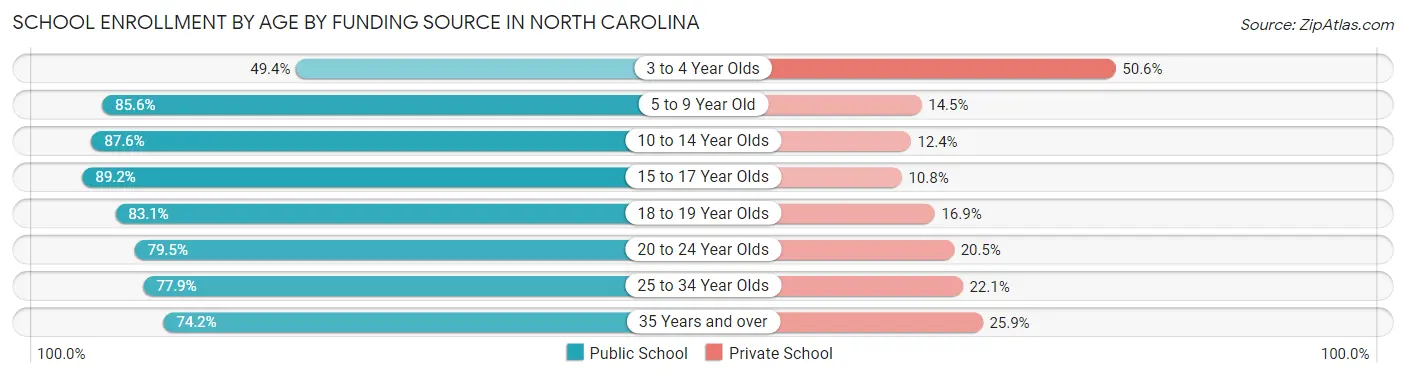
Out of a total of 2,502,564 students who are enrolled in schools in North Carolina, 420,431 (16.8%) attend a private institution, while the remaining 2,082,133 (83.2%) are enrolled in public schools. The age group of 3 to 4 year olds has the highest likelihood of being enrolled in private schools, with 52,331 (50.6% in the age bracket) enrolled. Conversely, the age group of 15 to 17 year olds has the lowest likelihood of being enrolled in a private school, with 347,199 (89.2% in the age bracket) attending a public institution.
| Age Bracket | Public School | Private School |
| 3 to 4 Year Olds | 51,076 (49.4%) | 52,331 (50.6%) |
| 5 to 9 Year Old | 495,810 (85.6%) | 83,729 (14.4%) |
| 10 to 14 Year Olds | 574,323 (87.6%) | 81,572 (12.4%) |
| 15 to 17 Year Olds | 347,199 (89.2%) | 41,890 (10.8%) |
| 18 to 19 Year Olds | 178,501 (83.1%) | 36,352 (16.9%) |
| 20 to 24 Year Olds | 211,104 (79.5%) | 54,387 (20.5%) |
| 25 to 34 Year Olds | 118,440 (77.9%) | 33,651 (22.1%) |
| 35 Years and over | 105,438 (74.2%) | 36,761 (25.9%) |
| Total | 2,082,133 (83.2%) | 420,431 (16.8%) |
Educational Attainment by Field of Study in North Carolina
Business (517,523 | 19.7%), education (306,417 | 11.7%), science & technology (255,684 | 9.8%), social sciences (197,994 | 7.5%), and arts & humanities (186,812 | 7.1%) are the most common fields of study among 2,622,166 individuals in North Carolina who have obtained a bachelor's degree or higher.
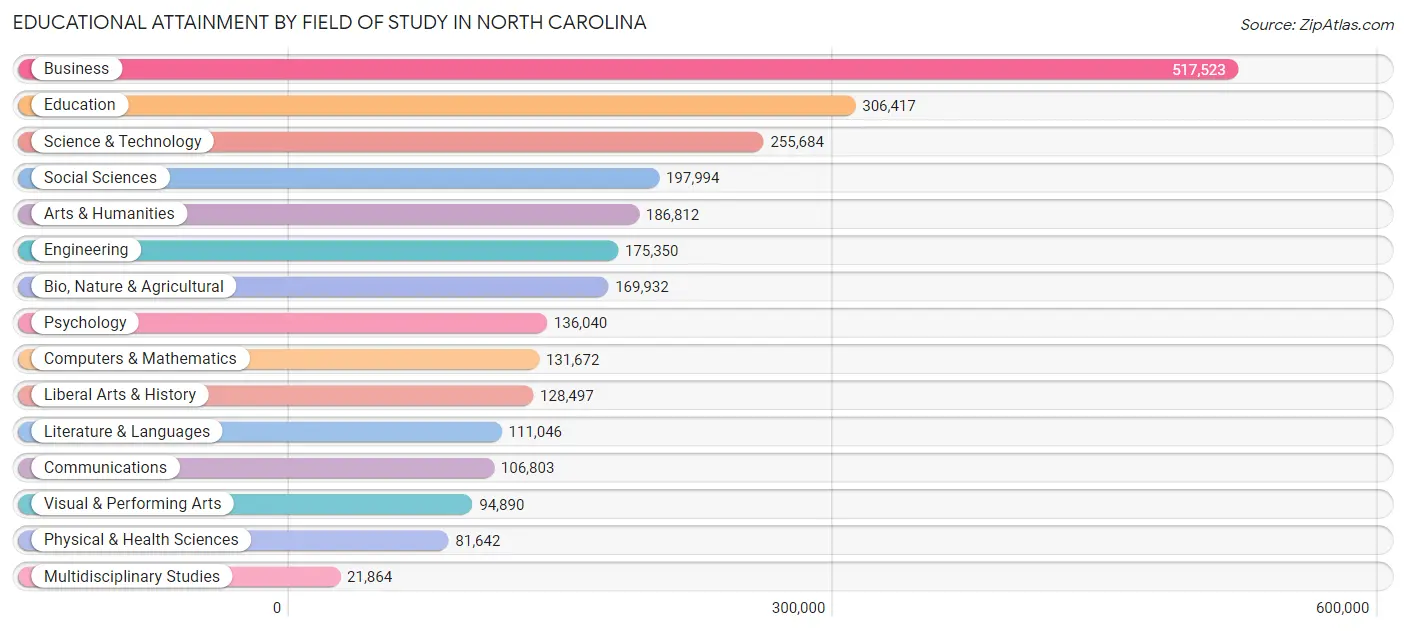
| Field of Study | # Graduates | % Graduates |
| Computers & Mathematics | 131,672 | 5.0% |
| Bio, Nature & Agricultural | 169,932 | 6.5% |
| Physical & Health Sciences | 81,642 | 3.1% |
| Psychology | 136,040 | 5.2% |
| Social Sciences | 197,994 | 7.5% |
| Engineering | 175,350 | 6.7% |
| Multidisciplinary Studies | 21,864 | 0.8% |
| Science & Technology | 255,684 | 9.8% |
| Business | 517,523 | 19.7% |
| Education | 306,417 | 11.7% |
| Literature & Languages | 111,046 | 4.2% |
| Liberal Arts & History | 128,497 | 4.9% |
| Visual & Performing Arts | 94,890 | 3.6% |
| Communications | 106,803 | 4.1% |
| Arts & Humanities | 186,812 | 7.1% |
| Total | 2,622,166 | 100.0% |
Transportation & Commute in North Carolina
Vehicle Availability by Sex in North Carolina
The most prevalent vehicle ownership categories in North Carolina are males with 2 vehicles (1,072,315, accounting for 42.0%) and females with 2 vehicles (908,271, making up 46.6%).
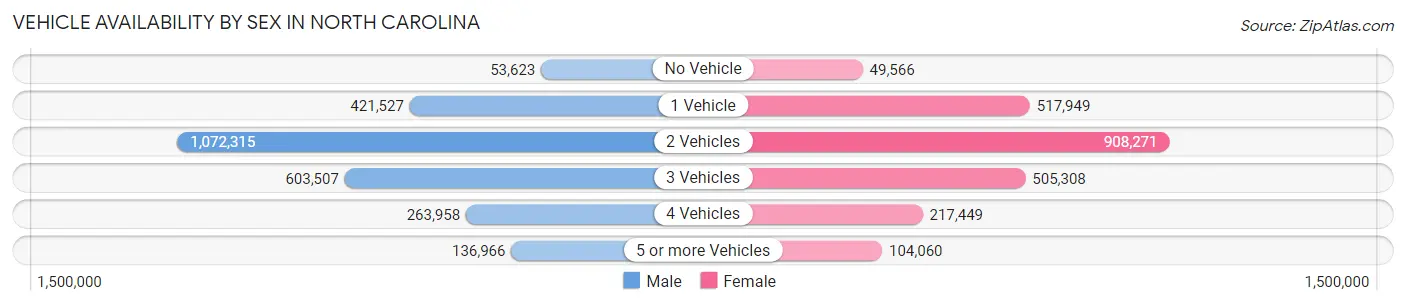
| Vehicles Available | Male | Female |
| No Vehicle | 53,623 (2.1%) | 49,566 (2.1%) |
| 1 Vehicle | 421,527 (16.5%) | 517,949 (22.5%) |
| 2 Vehicles | 1,072,315 (42.0%) | 908,271 (39.5%) |
| 3 Vehicles | 603,507 (23.6%) | 505,308 (22.0%) |
| 4 Vehicles | 263,958 (10.3%) | 217,449 (9.4%) |
| 5 or more Vehicles | 136,966 (5.4%) | 104,060 (4.5%) |
| Total | 2,551,896 (100.0%) | 2,302,603 (100.0%) |
Commute Time in North Carolina
The most frequently occuring commute durations in North Carolina are 15 to 19 minutes (731,059 commuters, 17.0%), 20 to 24 minutes (659,271 commuters, 15.3%), and 10 to 14 minutes (605,819 commuters, 14.1%).

| Commute Time | # Commuters | % Commuters |
| Less than 5 Minutes | 121,368 | 2.8% |
| 5 to 9 Minutes | 411,760 | 9.6% |
| 10 to 14 Minutes | 605,819 | 14.1% |
| 15 to 19 Minutes | 731,059 | 17.0% |
| 20 to 24 Minutes | 659,271 | 15.3% |
| 25 to 29 Minutes | 317,490 | 7.4% |
| 30 to 34 Minutes | 569,809 | 13.2% |
| 35 to 39 Minutes | 144,514 | 3.4% |
| 40 to 44 Minutes | 151,385 | 3.5% |
| 45 to 59 Minutes | 318,294 | 7.4% |
| 60 to 89 Minutes | 187,283 | 4.3% |
| 90 or more Minutes | 92,061 | 2.1% |
Commute Time by Sex in North Carolina
The most common commute times in North Carolina are 15 to 19 minutes (372,476 commuters, 16.2%) for males and 15 to 19 minutes (358,583 commuters, 17.8%) for females.
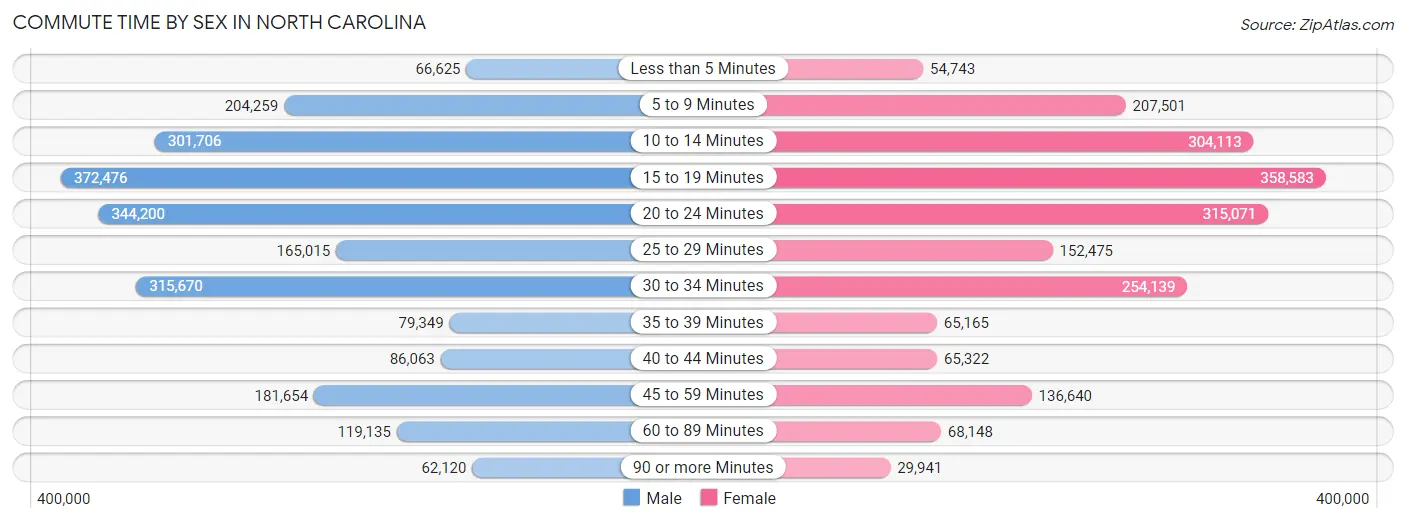
| Commute Time | Male | Female |
| Less than 5 Minutes | 66,625 (2.9%) | 54,743 (2.7%) |
| 5 to 9 Minutes | 204,259 (8.9%) | 207,501 (10.3%) |
| 10 to 14 Minutes | 301,706 (13.1%) | 304,113 (15.1%) |
| 15 to 19 Minutes | 372,476 (16.2%) | 358,583 (17.8%) |
| 20 to 24 Minutes | 344,200 (15.0%) | 315,071 (15.7%) |
| 25 to 29 Minutes | 165,015 (7.2%) | 152,475 (7.6%) |
| 30 to 34 Minutes | 315,670 (13.7%) | 254,139 (12.6%) |
| 35 to 39 Minutes | 79,349 (3.5%) | 65,165 (3.2%) |
| 40 to 44 Minutes | 86,063 (3.7%) | 65,322 (3.3%) |
| 45 to 59 Minutes | 181,654 (7.9%) | 136,640 (6.8%) |
| 60 to 89 Minutes | 119,135 (5.2%) | 68,148 (3.4%) |
| 90 or more Minutes | 62,120 (2.7%) | 29,941 (1.5%) |
Time of Departure to Work by Sex in North Carolina
The most frequent times of departure to work in North Carolina are 7:00 AM to 7:29 AM (337,725, 14.7%) for males and 7:00 AM to 7:29 AM (315,683, 15.7%) for females.
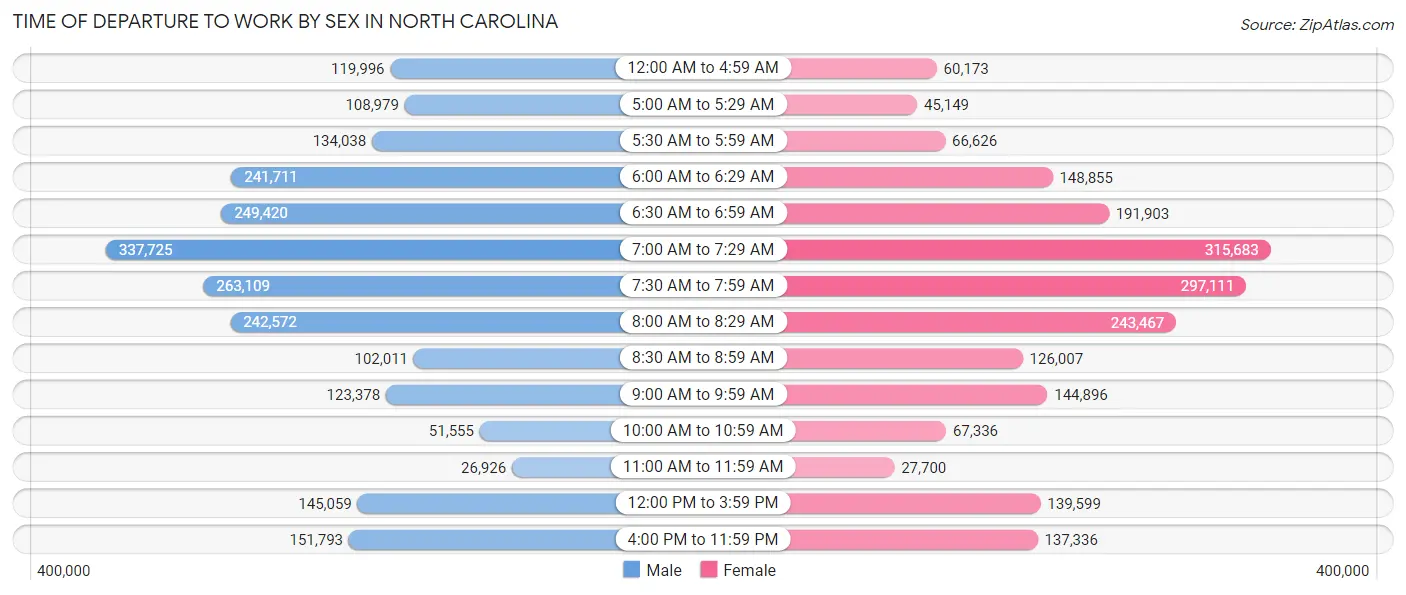
| Time of Departure | Male | Female |
| 12:00 AM to 4:59 AM | 119,996 (5.2%) | 60,173 (3.0%) |
| 5:00 AM to 5:29 AM | 108,979 (4.7%) | 45,149 (2.2%) |
| 5:30 AM to 5:59 AM | 134,038 (5.8%) | 66,626 (3.3%) |
| 6:00 AM to 6:29 AM | 241,711 (10.5%) | 148,855 (7.4%) |
| 6:30 AM to 6:59 AM | 249,420 (10.8%) | 191,903 (9.5%) |
| 7:00 AM to 7:29 AM | 337,725 (14.7%) | 315,683 (15.7%) |
| 7:30 AM to 7:59 AM | 263,109 (11.5%) | 297,111 (14.8%) |
| 8:00 AM to 8:29 AM | 242,572 (10.5%) | 243,467 (12.1%) |
| 8:30 AM to 8:59 AM | 102,011 (4.4%) | 126,007 (6.3%) |
| 9:00 AM to 9:59 AM | 123,378 (5.4%) | 144,896 (7.2%) |
| 10:00 AM to 10:59 AM | 51,555 (2.2%) | 67,336 (3.4%) |
| 11:00 AM to 11:59 AM | 26,926 (1.2%) | 27,700 (1.4%) |
| 12:00 PM to 3:59 PM | 145,059 (6.3%) | 139,599 (6.9%) |
| 4:00 PM to 11:59 PM | 151,793 (6.6%) | 137,336 (6.8%) |
| Total | 2,298,272 (100.0%) | 2,011,841 (100.0%) |
Housing Occupancy in North Carolina
Occupancy by Ownership in North Carolina
Of the total 4,105,232 dwellings in North Carolina, owner-occupied units account for 2,717,961 (66.2%), while renter-occupied units make up 1,387,271 (33.8%).
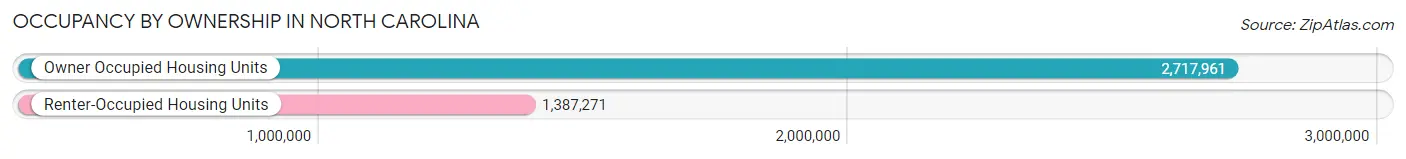
| Occupancy | # Housing Units | % Housing Units |
| Owner Occupied Housing Units | 2,717,961 | 66.2% |
| Renter-Occupied Housing Units | 1,387,271 | 33.8% |
| Total Occupied Housing Units | 4,105,232 | 100.0% |
Occupancy by Household Size in North Carolina
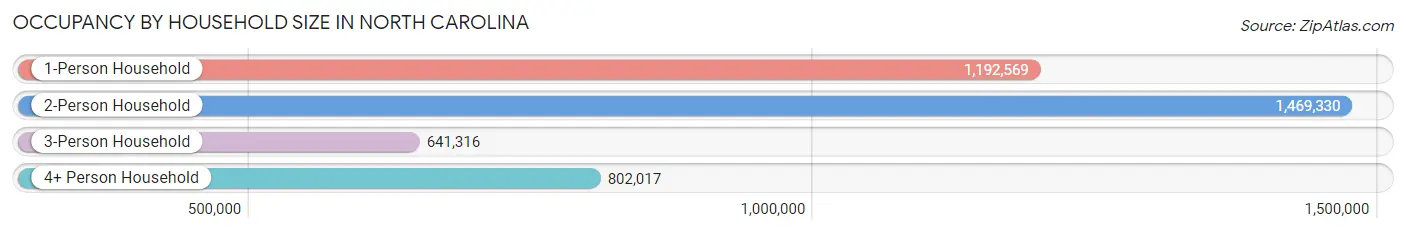
| Household Size | # Housing Units | % Housing Units |
| 1-Person Household | 1,192,569 | 29.0% |
| 2-Person Household | 1,469,330 | 35.8% |
| 3-Person Household | 641,316 | 15.6% |
| 4+ Person Household | 802,017 | 19.5% |
| Total Housing Units | 4,105,232 | 100.0% |
Occupancy by Ownership by Household Size in North Carolina
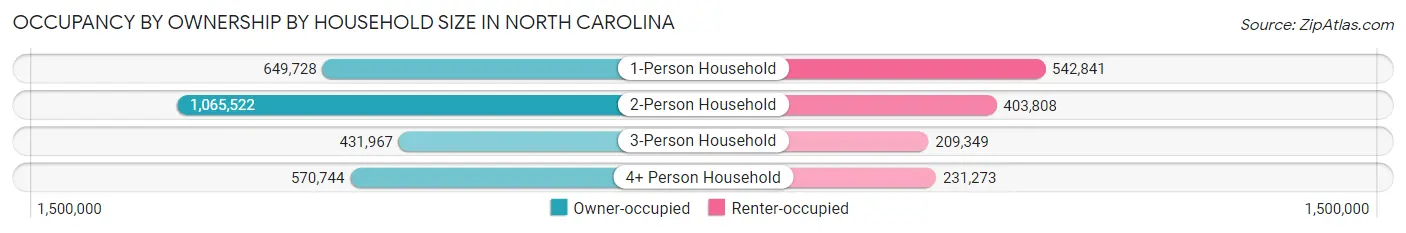
| Household Size | Owner-occupied | Renter-occupied |
| 1-Person Household | 649,728 (54.5%) | 542,841 (45.5%) |
| 2-Person Household | 1,065,522 (72.5%) | 403,808 (27.5%) |
| 3-Person Household | 431,967 (67.4%) | 209,349 (32.6%) |
| 4+ Person Household | 570,744 (71.2%) | 231,273 (28.8%) |
| Total Housing Units | 2,717,961 (66.2%) | 1,387,271 (33.8%) |
Occupancy by Educational Attainment in North Carolina
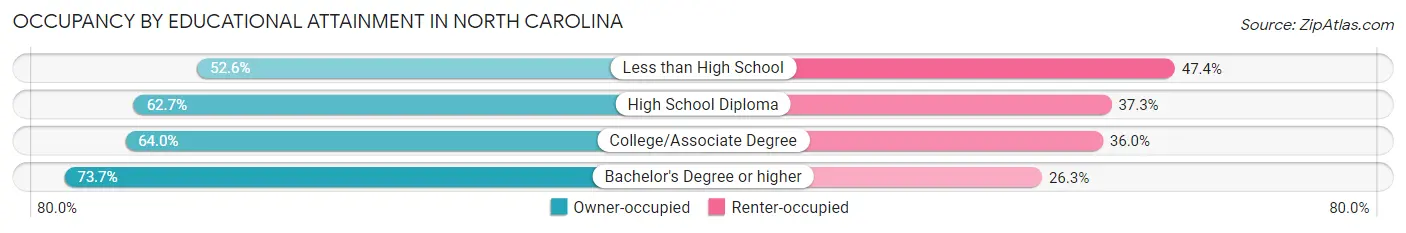
| Household Size | Owner-occupied | Renter-occupied |
| Less than High School | 194,005 (52.6%) | 174,612 (47.4%) |
| High School Diploma | 579,099 (62.7%) | 344,814 (37.3%) |
| College/Associate Degree | 849,109 (64.0%) | 476,817 (36.0%) |
| Bachelor's Degree or higher | 1,095,748 (73.7%) | 391,028 (26.3%) |
Occupancy by Age of Householder in North Carolina
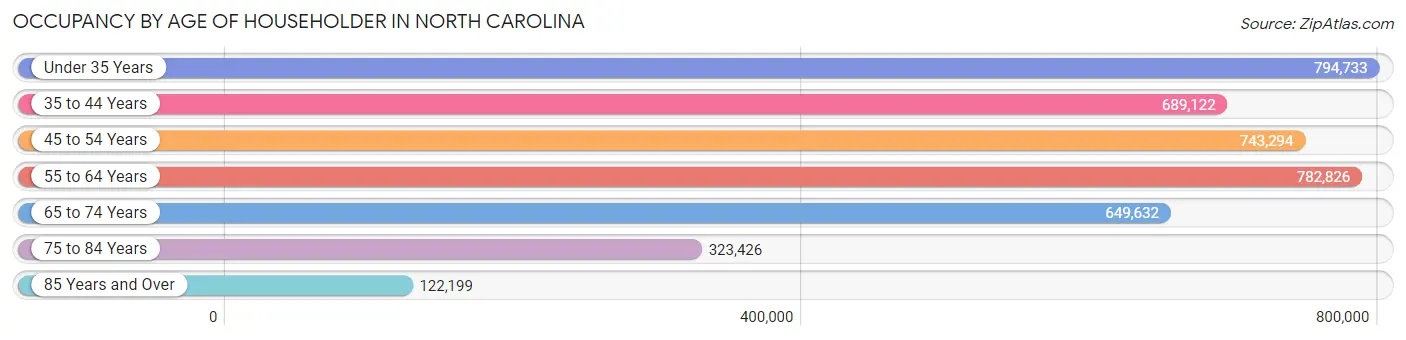
| Age Bracket | # Households | % Households |
| Under 35 Years | 794,733 | 19.4% |
| 35 to 44 Years | 689,122 | 16.8% |
| 45 to 54 Years | 743,294 | 18.1% |
| 55 to 64 Years | 782,826 | 19.1% |
| 65 to 74 Years | 649,632 | 15.8% |
| 75 to 84 Years | 323,426 | 7.9% |
| 85 Years and Over | 122,199 | 3.0% |
| Total | 4,105,232 | 100.0% |
Housing Finances in North Carolina
Median Income by Occupancy in North Carolina
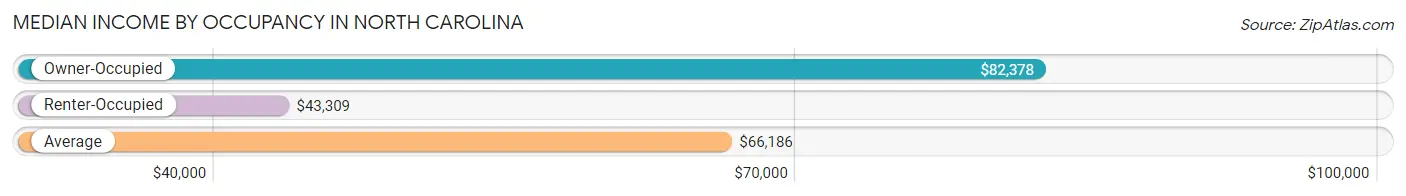
| Occupancy Type | # Households | Median Income |
| Owner-Occupied | 2,717,961 (66.2%) | $82,378 |
| Renter-Occupied | 1,387,271 (33.8%) | $43,309 |
| Average | 4,105,232 (100.0%) | $66,186 |
Occupancy by Householder Income Bracket in North Carolina
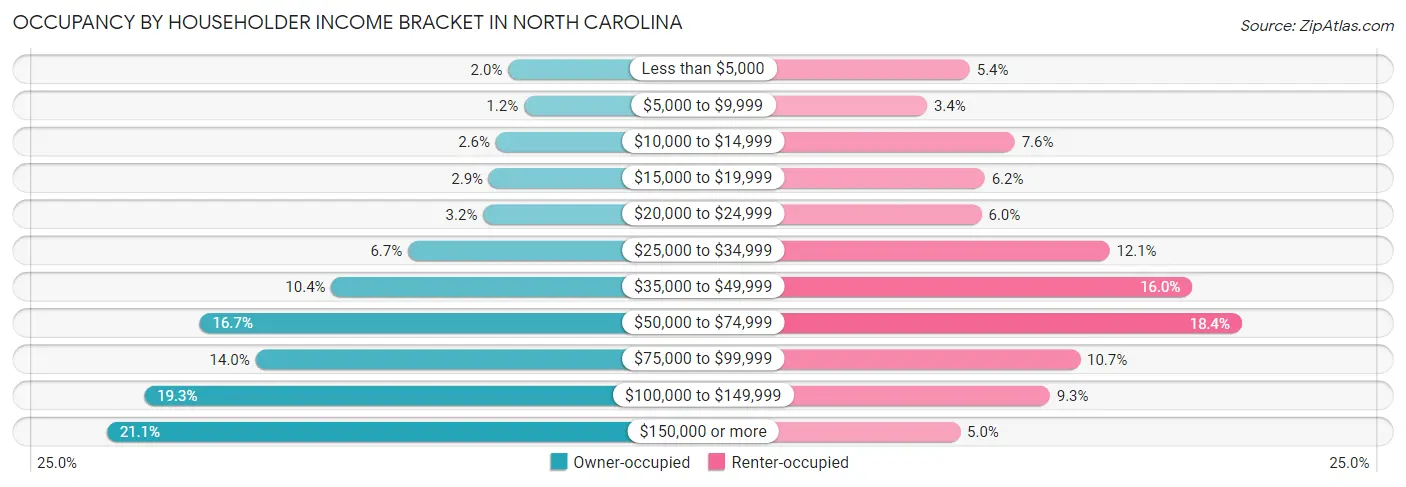
| Income Bracket | Owner-occupied | Renter-occupied |
| Less than $5,000 | 53,452 (2.0%) | 75,446 (5.4%) |
| $5,000 to $9,999 | 33,201 (1.2%) | 47,222 (3.4%) |
| $10,000 to $14,999 | 69,702 (2.6%) | 105,174 (7.6%) |
| $15,000 to $19,999 | 78,624 (2.9%) | 85,250 (6.1%) |
| $20,000 to $24,999 | 85,787 (3.2%) | 83,233 (6.0%) |
| $25,000 to $34,999 | 183,304 (6.7%) | 167,675 (12.1%) |
| $35,000 to $49,999 | 282,446 (10.4%) | 222,400 (16.0%) |
| $50,000 to $74,999 | 453,067 (16.7%) | 255,179 (18.4%) |
| $75,000 to $99,999 | 380,465 (14.0%) | 148,285 (10.7%) |
| $100,000 to $149,999 | 524,781 (19.3%) | 128,370 (9.2%) |
| $150,000 or more | 573,132 (21.1%) | 69,037 (5.0%) |
| Total | 2,717,961 (100.0%) | 1,387,271 (100.0%) |
Monthly Housing Cost Tiers in North Carolina
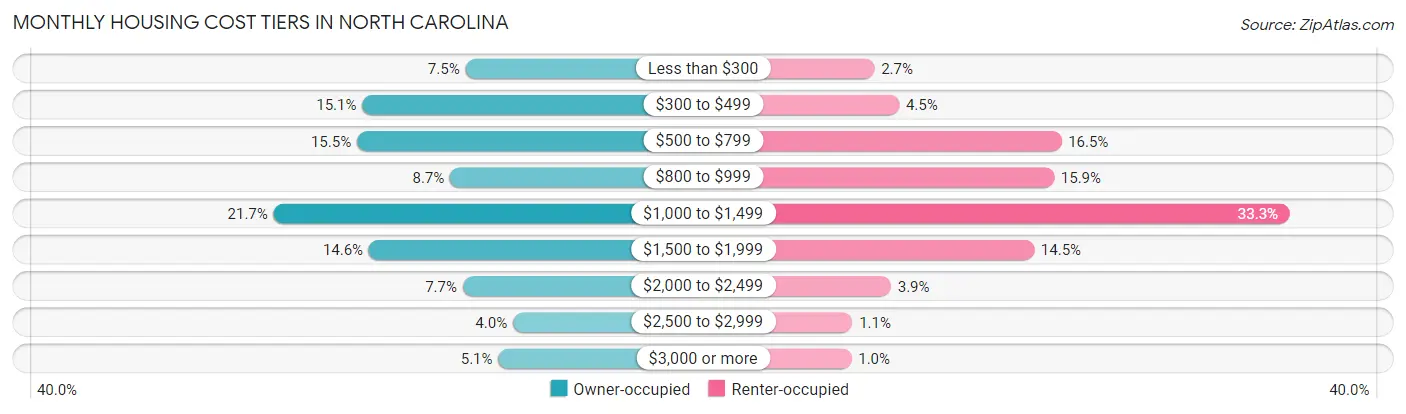
| Monthly Cost | Owner-occupied | Renter-occupied |
| Less than $300 | 204,596 (7.5%) | 37,643 (2.7%) |
| $300 to $499 | 411,223 (15.1%) | 62,805 (4.5%) |
| $500 to $799 | 421,745 (15.5%) | 228,667 (16.5%) |
| $800 to $999 | 235,417 (8.7%) | 221,115 (15.9%) |
| $1,000 to $1,499 | 588,779 (21.7%) | 462,187 (33.3%) |
| $1,500 to $1,999 | 397,958 (14.6%) | 200,760 (14.5%) |
| $2,000 to $2,499 | 209,997 (7.7%) | 54,535 (3.9%) |
| $2,500 to $2,999 | 109,470 (4.0%) | 15,120 (1.1%) |
| $3,000 or more | 138,776 (5.1%) | 14,099 (1.0%) |
| Total | 2,717,961 (100.0%) | 1,387,271 (100.0%) |
Physical Housing Characteristics in North Carolina
Housing Structures in North Carolina
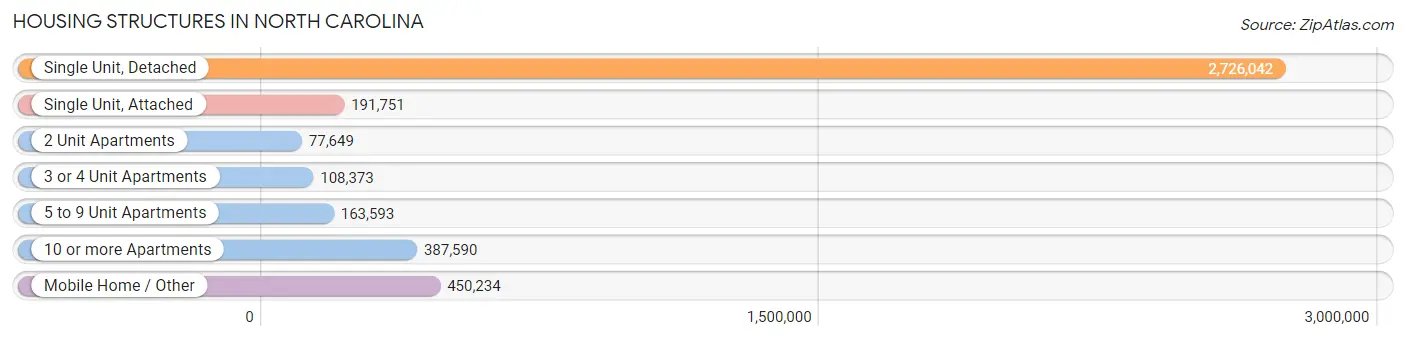
| Structure Type | # Housing Units | % Housing Units |
| Single Unit, Detached | 2,726,042 | 66.4% |
| Single Unit, Attached | 191,751 | 4.7% |
| 2 Unit Apartments | 77,649 | 1.9% |
| 3 or 4 Unit Apartments | 108,373 | 2.6% |
| 5 to 9 Unit Apartments | 163,593 | 4.0% |
| 10 or more Apartments | 387,590 | 9.4% |
| Mobile Home / Other | 450,234 | 11.0% |
| Total | 4,105,232 | 100.0% |
Housing Structures by Occupancy in North Carolina
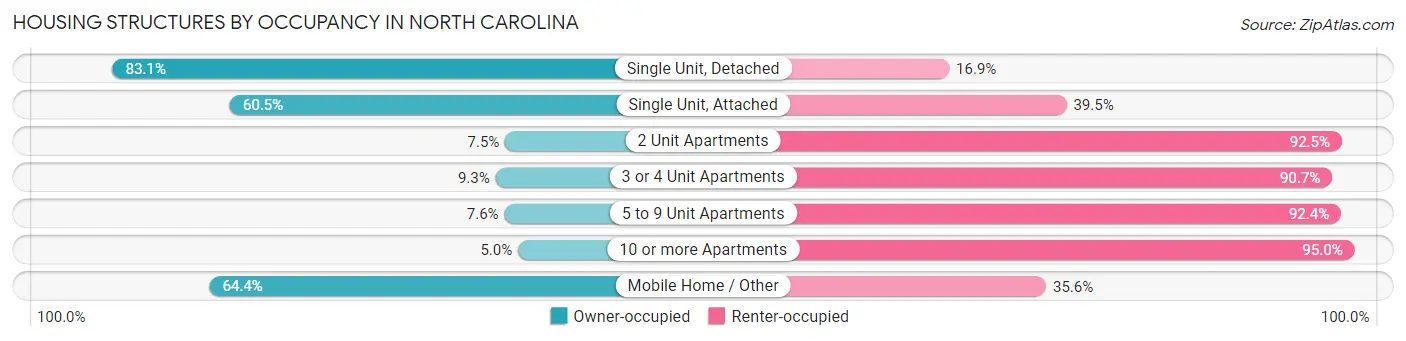
| Structure Type | Owner-occupied | Renter-occupied |
| Single Unit, Detached | 2,264,335 (83.1%) | 461,707 (16.9%) |
| Single Unit, Attached | 115,950 (60.5%) | 75,801 (39.5%) |
| 2 Unit Apartments | 5,803 (7.5%) | 71,846 (92.5%) |
| 3 or 4 Unit Apartments | 10,099 (9.3%) | 98,274 (90.7%) |
| 5 to 9 Unit Apartments | 12,472 (7.6%) | 151,121 (92.4%) |
| 10 or more Apartments | 19,341 (5.0%) | 368,249 (95.0%) |
| Mobile Home / Other | 289,961 (64.4%) | 160,273 (35.6%) |
| Total | 2,717,961 (66.2%) | 1,387,271 (33.8%) |
Housing Structures by Number of Rooms in North Carolina
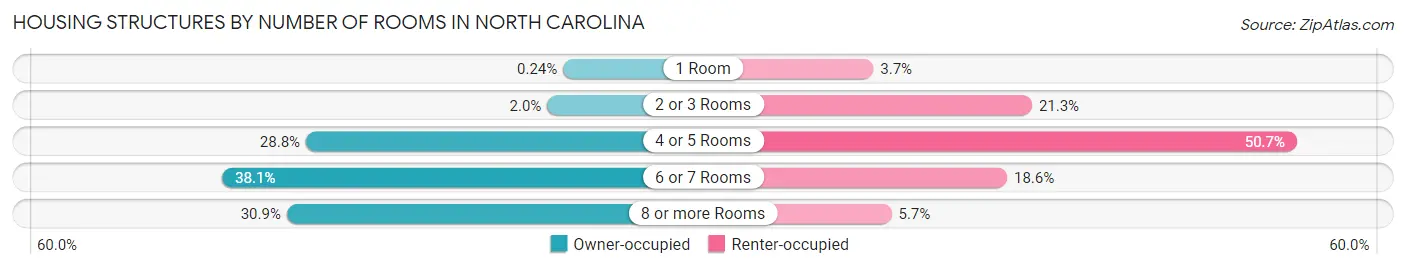
| Number of Rooms | Owner-occupied | Renter-occupied |
| 1 Room | 6,602 (0.2%) | 51,411 (3.7%) |
| 2 or 3 Rooms | 54,357 (2.0%) | 295,656 (21.3%) |
| 4 or 5 Rooms | 782,301 (28.8%) | 703,310 (50.7%) |
| 6 or 7 Rooms | 1,034,676 (38.1%) | 257,341 (18.5%) |
| 8 or more Rooms | 840,025 (30.9%) | 79,553 (5.7%) |
| Total | 2,717,961 (100.0%) | 1,387,271 (100.0%) |
Housing Structure by Heating Type in North Carolina
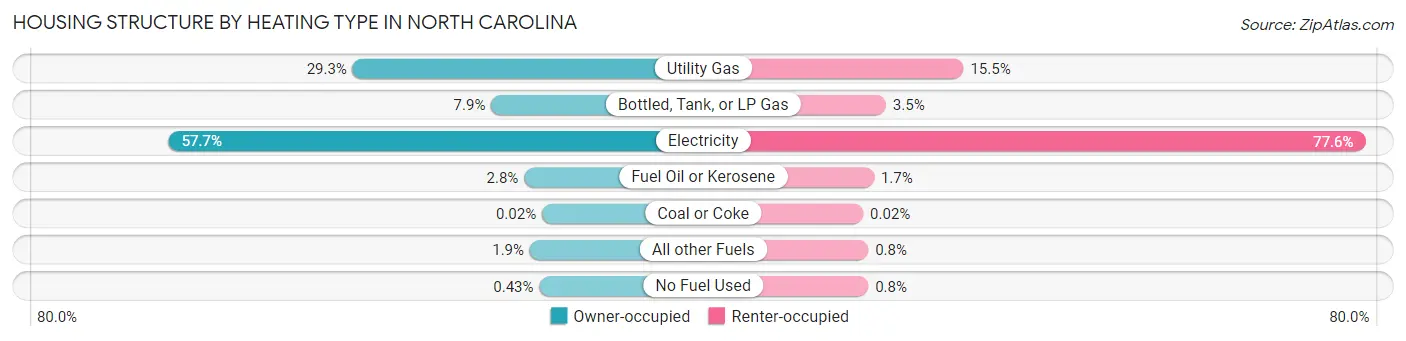
| Heating Type | Owner-occupied | Renter-occupied |
| Utility Gas | 795,917 (29.3%) | 215,382 (15.5%) |
| Bottled, Tank, or LP Gas | 213,677 (7.9%) | 48,984 (3.5%) |
| Electricity | 1,569,457 (57.7%) | 1,076,977 (77.6%) |
| Fuel Oil or Kerosene | 75,335 (2.8%) | 23,510 (1.7%) |
| Coal or Coke | 546 (0.0%) | 264 (0.0%) |
| All other Fuels | 51,270 (1.9%) | 11,119 (0.8%) |
| No Fuel Used | 11,759 (0.4%) | 11,035 (0.8%) |
| Total | 2,717,961 (100.0%) | 1,387,271 (100.0%) |
Household Vehicle Usage in North Carolina
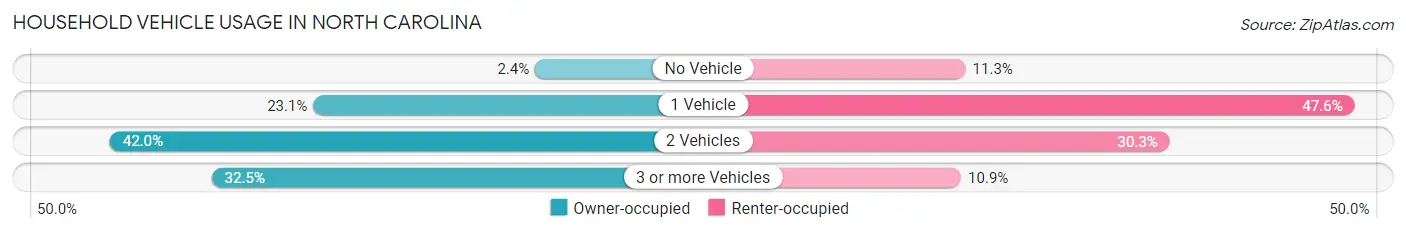
| Vehicles per Household | Owner-occupied | Renter-occupied |
| No Vehicle | 63,797 (2.4%) | 156,306 (11.3%) |
| 1 Vehicle | 626,855 (23.1%) | 659,914 (47.6%) |
| 2 Vehicles | 1,142,755 (42.0%) | 420,482 (30.3%) |
| 3 or more Vehicles | 884,554 (32.5%) | 150,569 (10.8%) |
| Total | 2,717,961 (100.0%) | 1,387,271 (100.0%) |
Real Estate & Mortgages in North Carolina
Real Estate and Mortgage Overview in North Carolina
| Characteristic | Without Mortgage | With Mortgage |
| Housing Units | 1,027,495 | 1,690,466 |
| Median Property Value | $185,500 | $259,000 |
| Median Household Income | $57,723 | $441,417 |
| Monthly Housing Costs | $457 | $135,911 |
| Real Estate Taxes | $1,390 | $27,951 |
Property Value by Mortgage Status in North Carolina
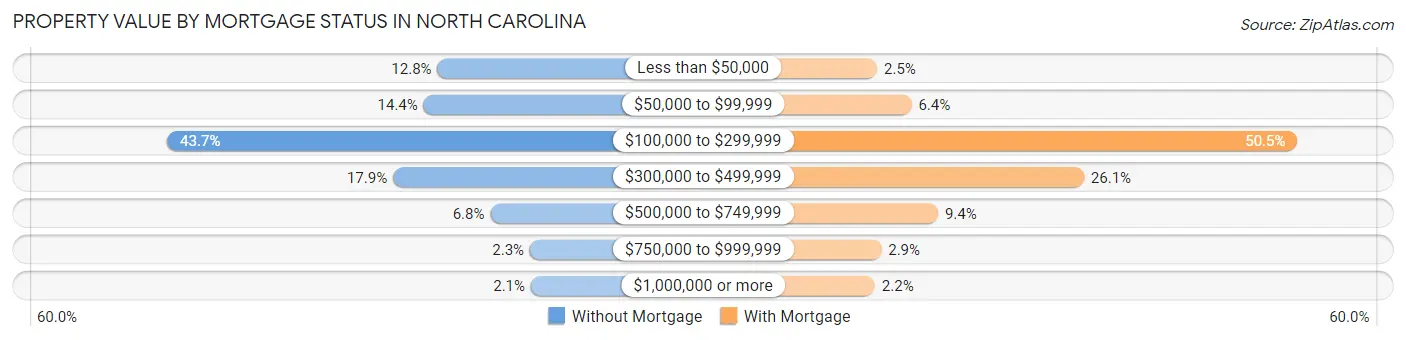
| Property Value | Without Mortgage | With Mortgage |
| Less than $50,000 | 131,688 (12.8%) | 41,639 (2.5%) |
| $50,000 to $99,999 | 147,996 (14.4%) | 107,954 (6.4%) |
| $100,000 to $299,999 | 449,068 (43.7%) | 853,288 (50.5%) |
| $300,000 to $499,999 | 183,886 (17.9%) | 441,255 (26.1%) |
| $500,000 to $749,999 | 69,687 (6.8%) | 159,218 (9.4%) |
| $750,000 to $999,999 | 23,149 (2.2%) | 49,747 (2.9%) |
| $1,000,000 or more | 22,021 (2.1%) | 37,365 (2.2%) |
| Total | 1,027,495 (100.0%) | 1,690,466 (100.0%) |
Household Income by Mortgage Status in North Carolina
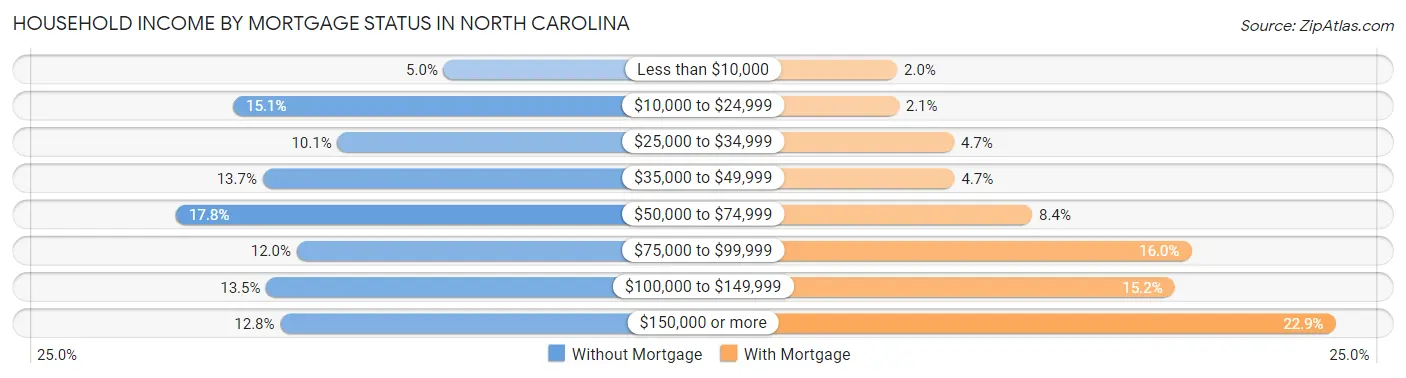
| Household Income | Without Mortgage | With Mortgage |
| Less than $10,000 | 51,779 (5.0%) | 33,502 (2.0%) |
| $10,000 to $24,999 | 154,873 (15.1%) | 34,874 (2.1%) |
| $25,000 to $34,999 | 103,750 (10.1%) | 79,240 (4.7%) |
| $35,000 to $49,999 | 140,317 (13.7%) | 79,554 (4.7%) |
| $50,000 to $74,999 | 182,763 (17.8%) | 142,129 (8.4%) |
| $75,000 to $99,999 | 123,722 (12.0%) | 270,304 (16.0%) |
| $100,000 to $149,999 | 138,576 (13.5%) | 256,743 (15.2%) |
| $150,000 or more | 131,715 (12.8%) | 386,205 (22.9%) |
| Total | 1,027,495 (100.0%) | 1,690,466 (100.0%) |
Property Value to Household Income Ratio in North Carolina
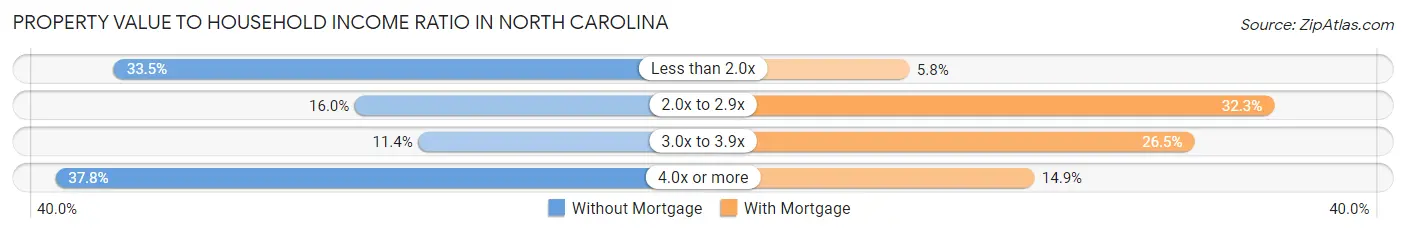
| Value-to-Income Ratio | Without Mortgage | With Mortgage |
| Less than 2.0x | 344,391 (33.5%) | 98,222 (5.8%) |
| 2.0x to 2.9x | 164,342 (16.0%) | 545,297 (32.3%) |
| 3.0x to 3.9x | 116,913 (11.4%) | 447,498 (26.5%) |
| 4.0x or more | 388,038 (37.8%) | 251,729 (14.9%) |
| Total | 1,027,495 (100.0%) | 1,690,466 (100.0%) |
Real Estate Taxes by Mortgage Status in North Carolina
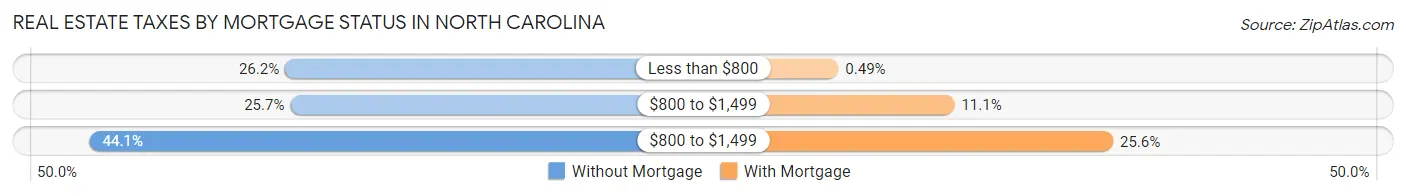
| Property Taxes | Without Mortgage | With Mortgage |
| Less than $800 | 269,420 (26.2%) | 8,353 (0.5%) |
| $800 to $1,499 | 264,439 (25.7%) | 187,475 (11.1%) |
| $800 to $1,499 | 452,745 (44.1%) | 432,330 (25.6%) |
| Total | 1,027,495 (100.0%) | 1,690,466 (100.0%) |
Health & Disability in North Carolina
Health Insurance Coverage by Age in North Carolina
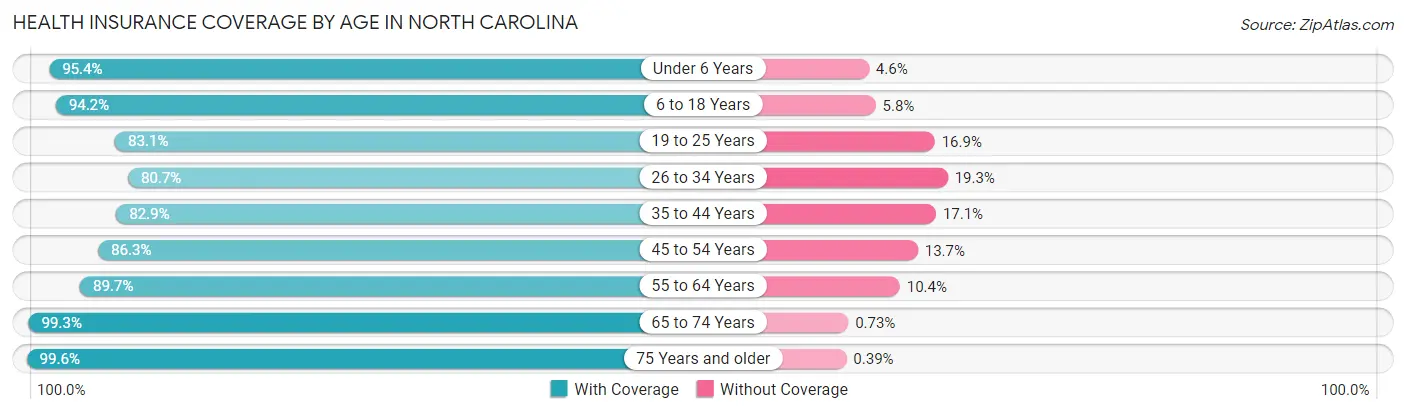
| Age Bracket | With Coverage | Without Coverage |
| Under 6 Years | 676,440 (95.4%) | 32,563 (4.6%) |
| 6 to 18 Years | 1,624,318 (94.2%) | 100,708 (5.8%) |
| 19 to 25 Years | 783,231 (83.1%) | 158,942 (16.9%) |
| 26 to 34 Years | 974,459 (80.7%) | 232,795 (19.3%) |
| 35 to 44 Years | 1,067,655 (82.9%) | 220,140 (17.1%) |
| 45 to 54 Years | 1,153,620 (86.3%) | 183,354 (13.7%) |
| 55 to 64 Years | 1,202,807 (89.6%) | 138,803 (10.3%) |
| 65 to 74 Years | 1,032,172 (99.3%) | 7,572 (0.7%) |
| 75 Years and older | 664,158 (99.6%) | 2,581 (0.4%) |
| Total | 9,178,860 (89.5%) | 1,077,458 (10.5%) |
Health Insurance Coverage by Citizenship Status in North Carolina
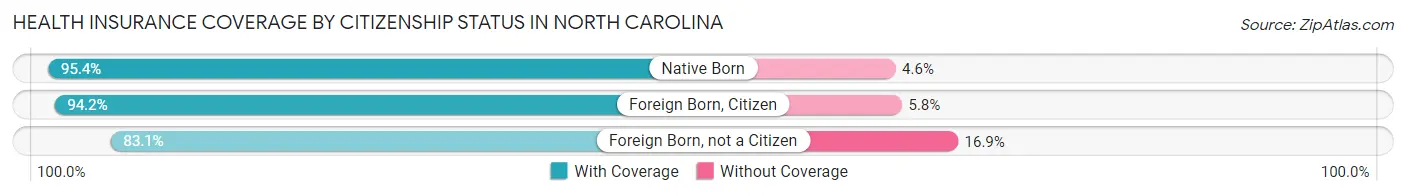
| Citizenship Status | With Coverage | Without Coverage |
| Native Born | 676,440 (95.4%) | 32,563 (4.6%) |
| Foreign Born, Citizen | 1,624,318 (94.2%) | 100,708 (5.8%) |
| Foreign Born, not a Citizen | 783,231 (83.1%) | 158,942 (16.9%) |
Health Insurance Coverage by Household Income in North Carolina
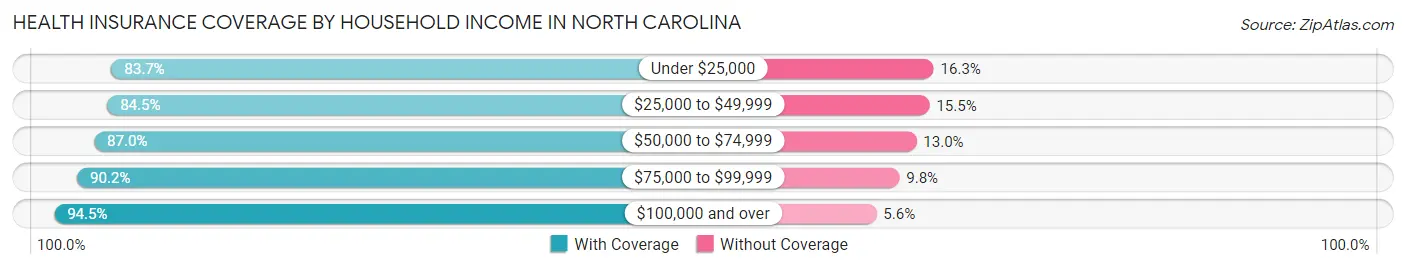
| Household Income | With Coverage | Without Coverage |
| Under $25,000 | 1,058,619 (83.7%) | 205,683 (16.3%) |
| $25,000 to $49,999 | 1,547,572 (84.5%) | 283,577 (15.5%) |
| $50,000 to $74,999 | 1,485,133 (87.0%) | 222,700 (13.0%) |
| $75,000 to $99,999 | 1,280,709 (90.2%) | 139,815 (9.8%) |
| $100,000 and over | 3,686,591 (94.5%) | 216,562 (5.6%) |
Public vs Private Health Insurance Coverage by Age in North Carolina
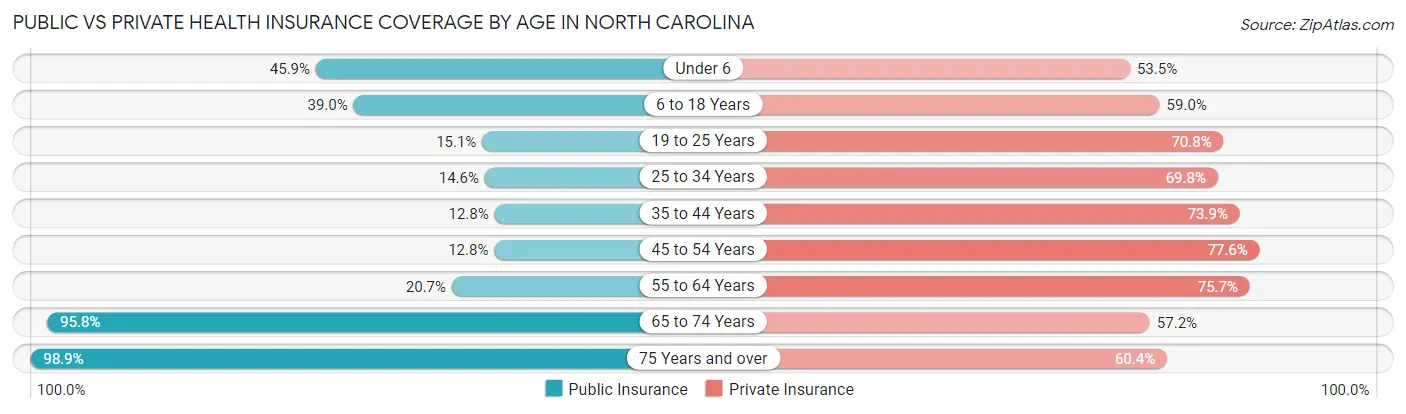
| Age Bracket | Public Insurance | Private Insurance |
| Under 6 | 325,710 (45.9%) | 379,237 (53.5%) |
| 6 to 18 Years | 671,886 (39.0%) | 1,017,827 (59.0%) |
| 19 to 25 Years | 141,855 (15.1%) | 667,420 (70.8%) |
| 25 to 34 Years | 176,058 (14.6%) | 842,248 (69.8%) |
| 35 to 44 Years | 164,493 (12.8%) | 951,207 (73.9%) |
| 45 to 54 Years | 171,519 (12.8%) | 1,037,004 (77.6%) |
| 55 to 64 Years | 277,708 (20.7%) | 1,015,883 (75.7%) |
| 65 to 74 Years | 996,275 (95.8%) | 594,608 (57.2%) |
| 75 Years and over | 659,698 (98.9%) | 402,536 (60.4%) |
| Total | 3,585,202 (35.0%) | 6,907,970 (67.3%) |
Disability Status by Sex by Age in North Carolina
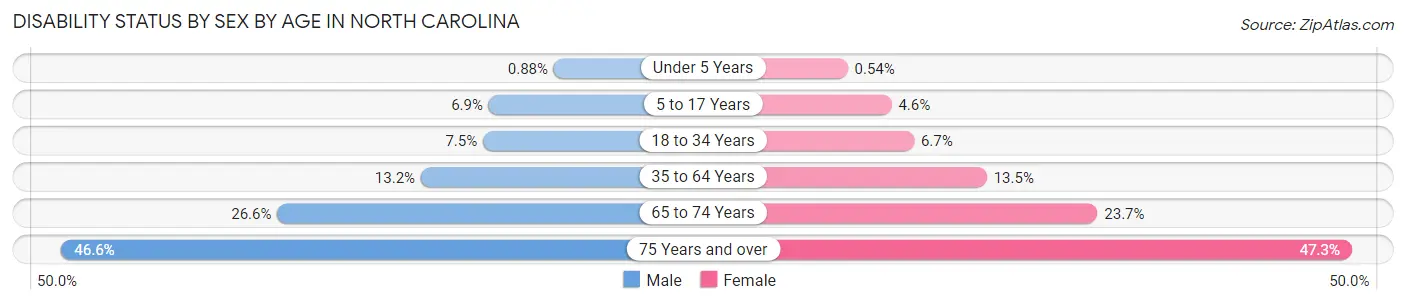
| Age Bracket | Male | Female |
| Under 5 Years | 2,643 (0.9%) | 1,560 (0.5%) |
| 5 to 17 Years | 59,780 (6.9%) | 38,188 (4.6%) |
| 18 to 34 Years | 83,690 (7.4%) | 78,872 (6.7%) |
| 35 to 64 Years | 253,969 (13.2%) | 275,086 (13.5%) |
| 65 to 74 Years | 127,334 (26.6%) | 132,875 (23.7%) |
| 75 Years and over | 127,869 (46.6%) | 185,651 (47.3%) |
Disability Class by Sex by Age in North Carolina
Disability Class: Hearing Difficulty
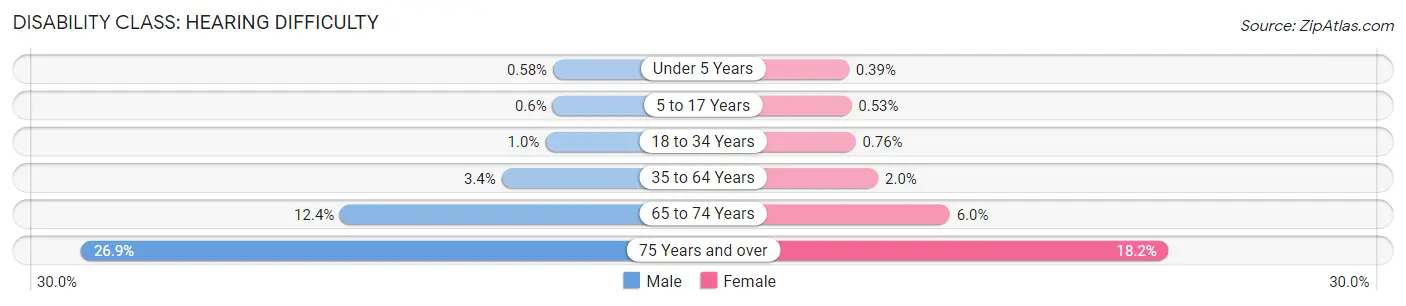
| Age Bracket | Male | Female |
| Under 5 Years | 1,748 (0.6%) | 1,130 (0.4%) |
| 5 to 17 Years | 5,143 (0.6%) | 4,391 (0.5%) |
| 18 to 34 Years | 11,357 (1.0%) | 8,998 (0.8%) |
| 35 to 64 Years | 66,122 (3.4%) | 41,342 (2.0%) |
| 65 to 74 Years | 59,640 (12.4%) | 33,646 (6.0%) |
| 75 Years and over | 73,745 (26.9%) | 71,386 (18.2%) |
Disability Class: Vision Difficulty
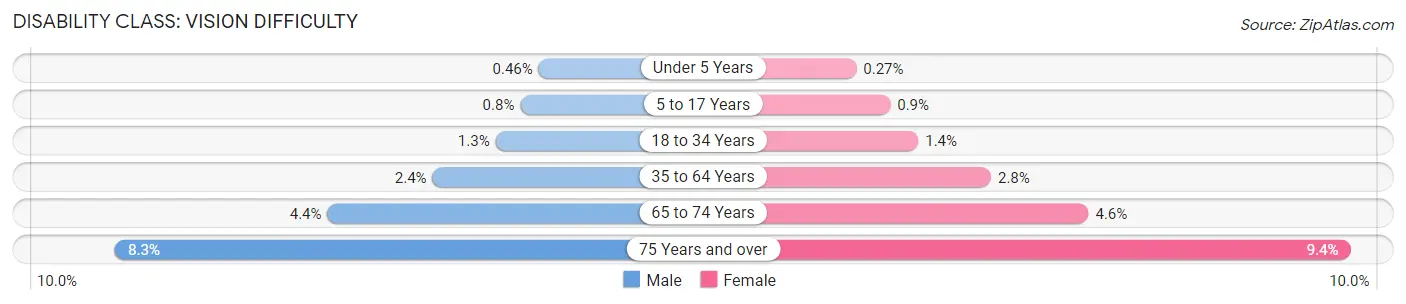
| Age Bracket | Male | Female |
| Under 5 Years | 1,378 (0.5%) | 777 (0.3%) |
| 5 to 17 Years | 6,891 (0.8%) | 7,473 (0.9%) |
| 18 to 34 Years | 14,187 (1.3%) | 16,762 (1.4%) |
| 35 to 64 Years | 46,717 (2.4%) | 56,637 (2.8%) |
| 65 to 74 Years | 20,987 (4.4%) | 25,662 (4.6%) |
| 75 Years and over | 22,831 (8.3%) | 37,042 (9.4%) |
Disability Class: Cognitive Difficulty
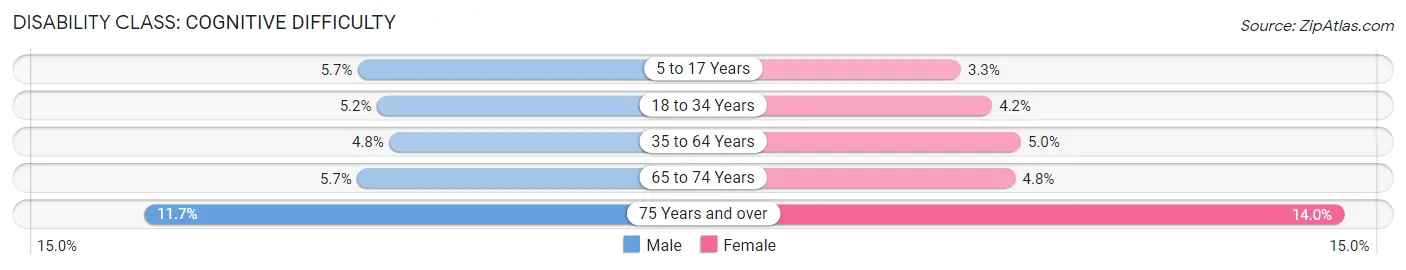
| Age Bracket | Male | Female |
| 5 to 17 Years | 49,332 (5.7%) | 27,533 (3.3%) |
| 18 to 34 Years | 58,193 (5.2%) | 49,339 (4.2%) |
| 35 to 64 Years | 92,970 (4.8%) | 102,020 (5.0%) |
| 65 to 74 Years | 27,466 (5.7%) | 27,100 (4.8%) |
| 75 Years and over | 32,047 (11.7%) | 54,841 (14.0%) |
Disability Class: Ambulatory Difficulty
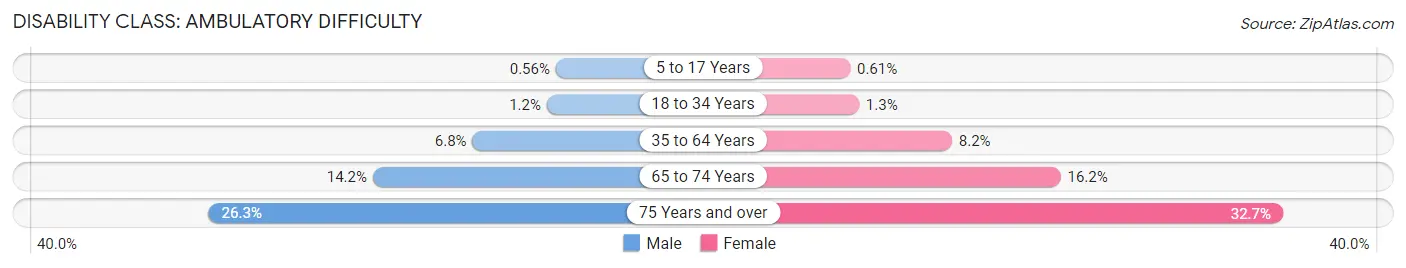
| Age Bracket | Male | Female |
| 5 to 17 Years | 4,849 (0.6%) | 5,033 (0.6%) |
| 18 to 34 Years | 13,813 (1.2%) | 14,962 (1.3%) |
| 35 to 64 Years | 129,631 (6.8%) | 167,164 (8.2%) |
| 65 to 74 Years | 67,874 (14.1%) | 90,970 (16.2%) |
| 75 Years and over | 72,268 (26.3%) | 128,424 (32.7%) |
Disability Class: Self-Care Difficulty
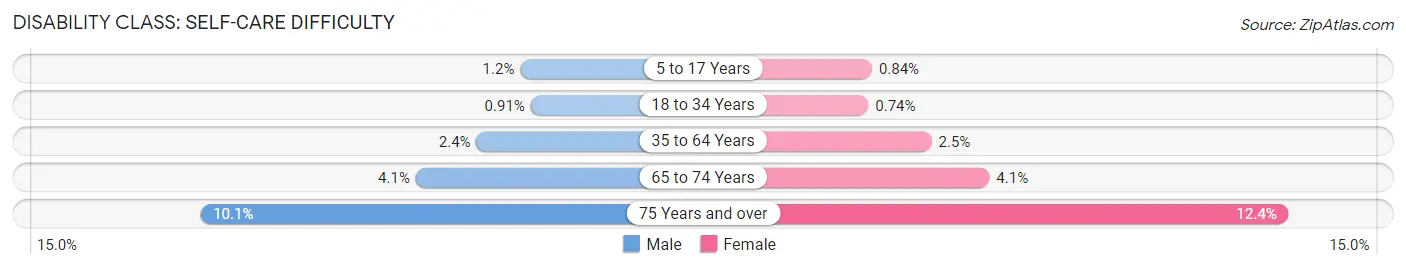
| Age Bracket | Male | Female |
| 5 to 17 Years | 10,363 (1.2%) | 6,957 (0.8%) |
| 18 to 34 Years | 10,211 (0.9%) | 8,760 (0.7%) |
| 35 to 64 Years | 46,541 (2.4%) | 51,188 (2.5%) |
| 65 to 74 Years | 19,713 (4.1%) | 23,029 (4.1%) |
| 75 Years and over | 27,748 (10.1%) | 48,794 (12.4%) |
Technology Access in North Carolina
Computing Device Access in North Carolina
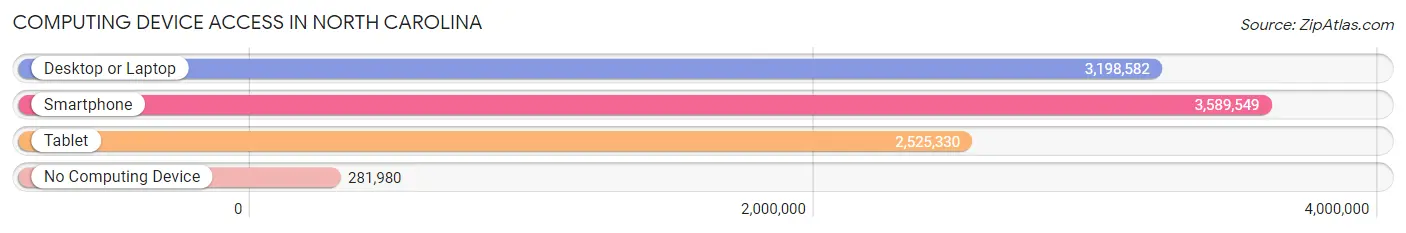
| Device Type | # Households | % Households |
| Desktop or Laptop | 3,198,582 | 77.9% |
| Smartphone | 3,589,549 | 87.4% |
| Tablet | 2,525,330 | 61.5% |
| No Computing Device | 281,980 | 6.9% |
| Total | 4,105,232 | 100.0% |
Internet Access in North Carolina
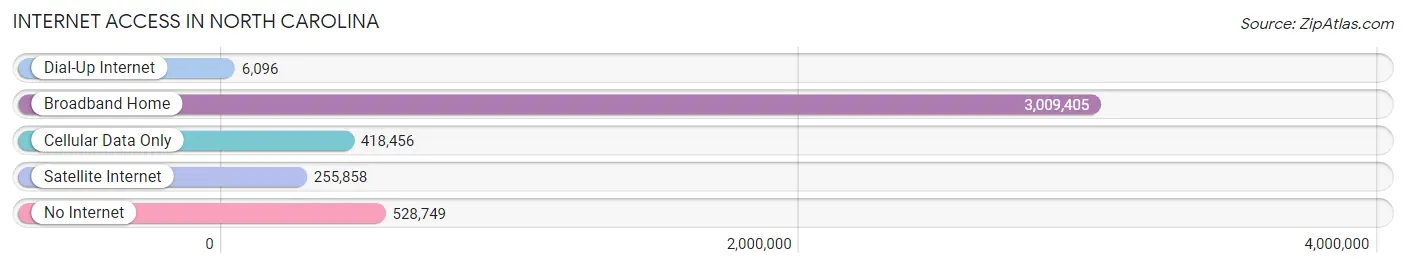
| Internet Type | # Households | % Households |
| Dial-Up Internet | 6,096 | 0.2% |
| Broadband Home | 3,009,405 | 73.3% |
| Cellular Data Only | 418,456 | 10.2% |
| Satellite Internet | 255,858 | 6.2% |
| No Internet | 528,749 | 12.9% |
| Total | 4,105,232 | 100.0% |
North Carolina Summary
North Carolina is a state located in the southeastern United States. It is bordered by South Carolina to the south, Georgia to the southwest, Tennessee to the west, Virginia to the north, and the Atlantic Ocean to the east. North Carolina is the 28th most populous state in the United States, with an estimated population of 10.3 million in 2019.
Geography
North Carolina is divided into three distinct geographic regions: the Coastal Plain, the Piedmont, and the Appalachian Mountains. The Coastal Plain is a low-lying region that extends from the Atlantic Ocean to the fall line, which marks the boundary between the Coastal Plain and the Piedmont. The Coastal Plain is home to the state’s largest cities, including Charlotte, Raleigh, and Wilmington. The Piedmont is a hilly region that extends from the fall line to the Blue Ridge Mountains. The Piedmont is home to many of the state’s major cities, including Greensboro, Winston-Salem, and Durham. The Appalachian Mountains are the highest mountain range in the eastern United States and extend from the Blue Ridge Mountains to the Great Smoky Mountains.
Economy
North Carolina’s economy is largely driven by its diverse industries, including agriculture, manufacturing, technology, and tourism. Agriculture is the state’s largest industry, with tobacco, cotton, and soybeans being the most important crops. Manufacturing is also a major industry in the state, with textiles, furniture, and electronics being the most important products. Technology is a growing industry in the state, with the Research Triangle Park in Raleigh-Durham being a major hub for technology companies. Tourism is also a major industry in the state, with the Outer Banks, the Blue Ridge Mountains, and the Great Smoky Mountains being popular destinations.
Demographics
North Carolina is a diverse state, with a population that is made up of a variety of racial and ethnic groups. The largest racial group in the state is white, making up 68.5% of the population. African Americans make up 22.1% of the population, while Hispanics and Latinos make up 8.3%. The state also has a large Native American population, making up 1.3% of the population. The state’s population is also diverse in terms of religion, with Christianity being the most common religion.
History
North Carolina was first settled by Europeans in the late 16th century. The first permanent settlement was established in 1587 by Sir Walter Raleigh. The state was one of the original 13 colonies and was the first state to declare its independence from Britain in 1776. During the American Revolution, North Carolina was a major supplier of troops and supplies to the Continental Army. After the war, the state became a major center of the cotton industry and was a leader in the development of the railroad. During the Civil War, North Carolina was a Confederate state and was the site of several major battles. After the war, the state experienced a period of economic growth and industrialization. In the 20th century, the state became a major center of the tobacco industry and was a leader in the civil rights movement. Today, North Carolina is a major center of industry, technology, and tourism.
Common Questions
When was North Carolina Incorporated?
North Carolina was Incorporated into the Union on Nov 21, 1789.
What is the Total Area of North Carolina?
Total Area of North Carolina is 53,819 Square Miles.
What is the Total Land Area of North Carolina?
Total Land Area of North Carolina is 48,619 Square Miles.
What is the Total Water Area of North Carolina?
Total Water Area of North Carolina is 5,200 Square Miles.
What is the Average Elevation in North Carolina?
Average Elevation in North Carolina is 700 Feet.
What is the Highest Elevation in North Carolina?
Highest Elevation in North Carolina is 6,684 Feet.
What is the Lowest Elevation in North Carolina?
Lowest Elevation in North Carolina is 0 Feet.
What is the Population Density in North Carolina?
Population Density in North Carolina is 215.3 People per Square Mile.
What is Per Capita Income in North Carolina?
Per Capita income in North Carolina is $37,641.
What is the Median Family Income in North Carolina?
Median Family Income in North Carolina is $82,890.
What is the Median Household income in North Carolina?
Median Household Income in North Carolina is $66,186.
What is Income or Wage Gap in North Carolina?
Income or Wage Gap in North Carolina is 24.5%.
Women in North Carolina earn 75.5 cents for every dollar earned by a man.
What is Family Income Deficit in North Carolina?
Family Income Deficit in North Carolina is $10,791.
Families that are below poverty line in North Carolina earn $10,791 less on average than the poverty threshold level.
What is Inequality or Gini Index in North Carolina?
Inequality or Gini Index in North Carolina is 0.48.
What is the Total Population of North Carolina?
Total Population of North Carolina is 10,470,214.
What is the Total Male Population of North Carolina?
Total Male Population of North Carolina is 5,131,370.
What is the Total Female Population of North Carolina?
Total Female Population of North Carolina is 5,338,844.
What is the Ratio of Males per 100 Females in North Carolina?
There are 96.11 Males per 100 Females in North Carolina.
What is the Ratio of Females per 100 Males in North Carolina?
There are 104.04 Females per 100 Males in North Carolina.
What is the Median Population Age in North Carolina?
Median Population Age in North Carolina is 39.1 Years.
What is the Average Family Size in North Carolina
Average Family Size in North Carolina is 3.1 People.
What is the Average Household Size in North Carolina
Average Household Size in North Carolina is 2.5 People.
How Large is the Labor Force in North Carolina?
There are 5,292,296 People in the Labor Forcein in North Carolina.
What is the Percentage of People in the Labor Force in North Carolina?
62.6% of People are in the Labor Force in North Carolina.
What is the Unemployment Rate in North Carolina?
Unemployment Rate in North Carolina is 5.1%.