Cities with the Lowest Inequality / Gini Index in California
RELATED REPORTS & OPTIONS
Lowest Inequality / Gini Index
California
Compare Cities
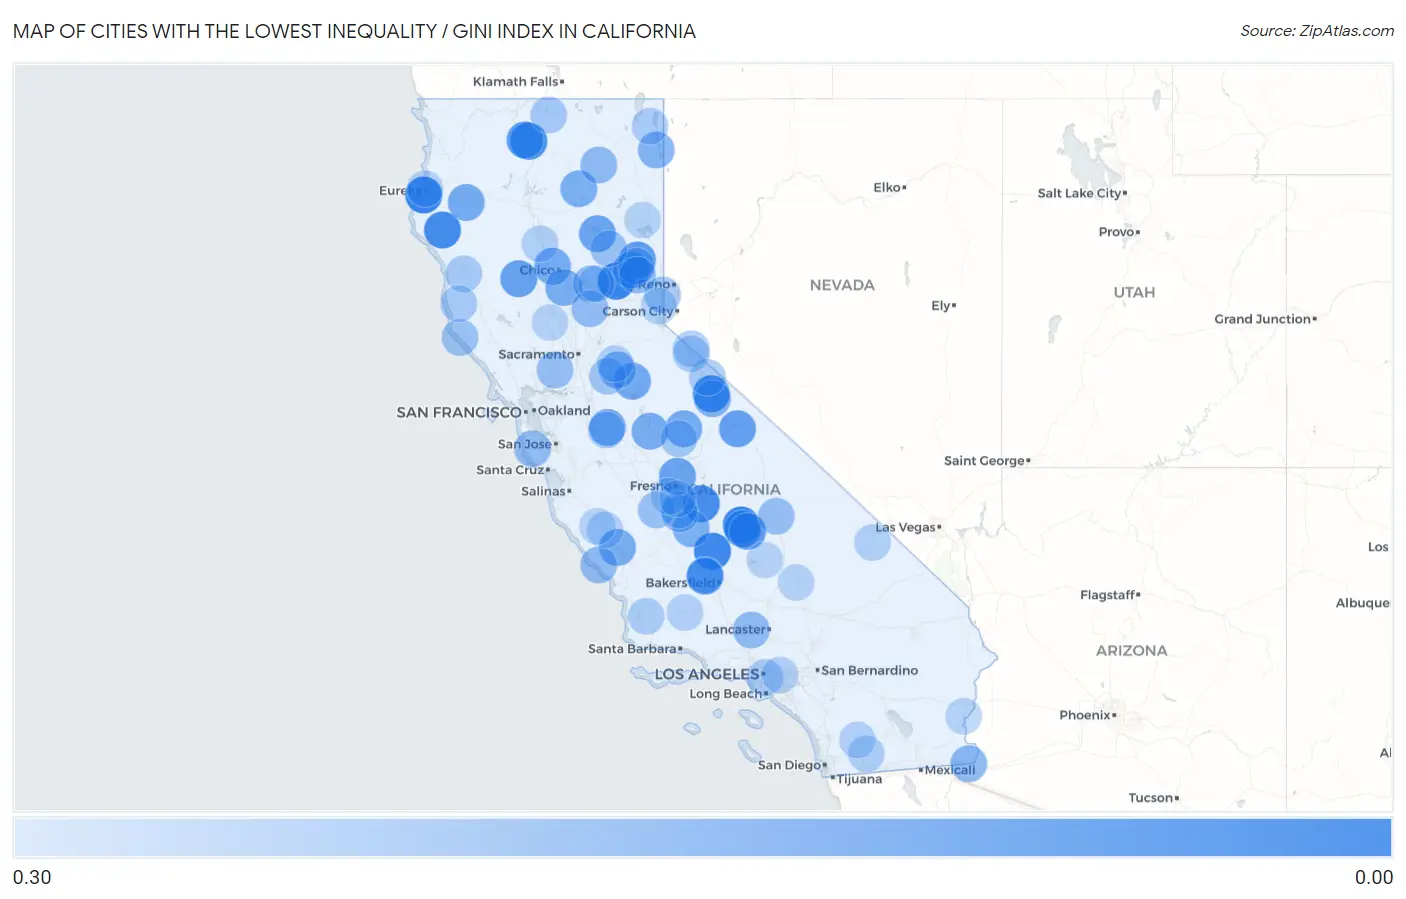
Map of Cities with the Lowest Inequality / Gini Index in California
0.30
0.00
Cities with the Lowest Inequality / Gini Index in California
| City | Inequality / Gini Index | vs State | vs National | |
| 1. | Downieville | 0.04 | 0.49(-0.450)#1 | 0.48(-0.443)#90 |
| 2. | Fields Landing | 0.04 | 0.49(-0.449)#2 | 0.48(-0.443)#91 |
| 3. | Sequoia Crest | 0.04 | 0.49(-0.449)#3 | 0.48(-0.442)#92 |
| 4. | Rodriguez Camp | 0.05 | 0.49(-0.442)#4 | 0.48(-0.436)#115 |
| 5. | Mono City | 0.06 | 0.49(-0.432)#5 | 0.48(-0.426)#152 |
| 6. | Myers Flat | 0.06 | 0.49(-0.430)#6 | 0.48(-0.423)#164 |
| 7. | Carrick | 0.06 | 0.49(-0.429)#7 | 0.48(-0.422)#170 |
| 8. | Monson | 0.07 | 0.49(-0.424)#8 | 0.48(-0.417)#181 |
| 9. | Camp Nelson | 0.09 | 0.49(-0.397)#9 | 0.48(-0.390)#276 |
| 10. | Lake Davis | 0.11 | 0.49(-0.383)#10 | 0.48(-0.377)#335 |
| 11. | Edgewood | 0.11 | 0.49(-0.382)#11 | 0.48(-0.375)#339 |
| 12. | Ponderosa | 0.11 | 0.49(-0.379)#12 | 0.48(-0.373)#345 |
| 13. | Choctaw Valley | 0.11 | 0.49(-0.376)#13 | 0.48(-0.369)#362 |
| 14. | Aspen Springs | 0.12 | 0.49(-0.370)#14 | 0.48(-0.363)#398 |
| 15. | Elk Creek | 0.12 | 0.49(-0.366)#15 | 0.48(-0.359)#420 |
| 16. | Prattville | 0.13 | 0.49(-0.358)#16 | 0.48(-0.352)#456 |
| 17. | Fort Washington | 0.13 | 0.49(-0.357)#17 | 0.48(-0.351)#457 |
| 18. | Whitehawk | 0.14 | 0.49(-0.354)#18 | 0.48(-0.347)#480 |
| 19. | Cowan | 0.14 | 0.49(-0.353)#19 | 0.48(-0.347)#484 |
| 20. | Mountain Ranch | 0.14 | 0.49(-0.348)#20 | 0.48(-0.342)#510 |
| 21. | Hyampom | 0.15 | 0.49(-0.342)#21 | 0.48(-0.335)#564 |
| 22. | Wawona | 0.15 | 0.49(-0.340)#22 | 0.48(-0.333)#581 |
| 23. | Nord | 0.15 | 0.49(-0.339)#23 | 0.48(-0.333)#584 |
| 24. | Bradley | 0.15 | 0.49(-0.338)#24 | 0.48(-0.332)#593 |
| 25. | Hornitos | 0.15 | 0.49(-0.338)#25 | 0.48(-0.331)#598 |
| 26. | Post Mountain | 0.16 | 0.49(-0.333)#26 | 0.48(-0.326)#638 |
| 27. | Franklin Cdp Sacramento County | 0.16 | 0.49(-0.332)#27 | 0.48(-0.325)#649 |
| 28. | Richvale | 0.16 | 0.49(-0.332)#28 | 0.48(-0.325)#651 |
| 29. | Stones Landing | 0.16 | 0.49(-0.332)#29 | 0.48(-0.325)#653 |
| 30. | Hat Creek | 0.16 | 0.49(-0.330)#30 | 0.48(-0.323)#670 |
| 31. | Martell | 0.16 | 0.49(-0.327)#31 | 0.48(-0.321)#683 |
| 32. | Waukena | 0.17 | 0.49(-0.324)#32 | 0.48(-0.317)#717 |
| 33. | Bear Valley Cdp Mariposa County | 0.17 | 0.49(-0.323)#33 | 0.48(-0.316)#732 |
| 34. | Lee Vining | 0.17 | 0.49(-0.319)#34 | 0.48(-0.312)#761 |
| 35. | Glennville | 0.17 | 0.49(-0.318)#35 | 0.48(-0.311)#773 |
| 36. | Dales | 0.17 | 0.49(-0.316)#36 | 0.48(-0.309)#786 |
| 37. | Eagleville | 0.17 | 0.49(-0.315)#37 | 0.48(-0.309)#795 |
| 38. | Mexican Colony | 0.18 | 0.49(-0.312)#38 | 0.48(-0.306)#828 |
| 39. | Winterhaven | 0.18 | 0.49(-0.308)#39 | 0.48(-0.301)#870 |
| 40. | El Adobe | 0.19 | 0.49(-0.300)#40 | 0.48(-0.294)#950 |
| 41. | Las Flores Cdp Tehama County | 0.19 | 0.49(-0.298)#41 | 0.48(-0.292)#966 |
| 42. | Grangeville | 0.19 | 0.49(-0.298)#42 | 0.48(-0.291)#968 |
| 43. | Iron Horse | 0.19 | 0.49(-0.297)#43 | 0.48(-0.291)#974 |
| 44. | Bieber | 0.20 | 0.49(-0.294)#44 | 0.48(-0.288)#1,007 |
| 45. | Lake Hughes | 0.20 | 0.49(-0.292)#45 | 0.48(-0.285)#1,028 |
| 46. | Forbestown | 0.20 | 0.49(-0.292)#46 | 0.48(-0.285)#1,035 |
| 47. | San Simeon | 0.20 | 0.49(-0.290)#47 | 0.48(-0.284)#1,052 |
| 48. | Smartsville | 0.20 | 0.49(-0.289)#48 | 0.48(-0.282)#1,070 |
| 49. | Calpine | 0.20 | 0.49(-0.288)#49 | 0.48(-0.282)#1,077 |
| 50. | Loma Mar | 0.20 | 0.49(-0.287)#50 | 0.48(-0.280)#1,097 |
| 51. | Elmira | 0.21 | 0.49(-0.282)#51 | 0.48(-0.275)#1,166 |
| 52. | El Centro Naval Air Facility | 0.21 | 0.49(-0.281)#52 | 0.48(-0.274)#1,174 |
| 53. | Cartago | 0.21 | 0.49(-0.278)#53 | 0.48(-0.272)#1,215 |
| 54. | Keddie | 0.22 | 0.49(-0.274)#54 | 0.48(-0.267)#1,274 |
| 55. | Westside | 0.22 | 0.49(-0.273)#55 | 0.48(-0.266)#1,290 |
| 56. | Anchor Bay | 0.22 | 0.49(-0.272)#56 | 0.48(-0.265)#1,313 |
| 57. | Smith Corner | 0.22 | 0.49(-0.272)#57 | 0.48(-0.265)#1,316 |
| 58. | Floriston | 0.22 | 0.49(-0.268)#58 | 0.48(-0.262)#1,364 |
| 59. | Camanche Village | 0.22 | 0.49(-0.266)#59 | 0.48(-0.260)#1,381 |
| 60. | Millerton | 0.22 | 0.49(-0.265)#60 | 0.48(-0.259)#1,396 |
| 61. | Williams Canyon | 0.22 | 0.49(-0.265)#61 | 0.48(-0.258)#1,400 |
| 62. | Cherokee Strip | 0.23 | 0.49(-0.262)#62 | 0.48(-0.255)#1,445 |
| 63. | Nipinnawasee | 0.23 | 0.49(-0.259)#63 | 0.48(-0.253)#1,487 |
| 64. | Woodville Farm Labor Camp | 0.23 | 0.49(-0.256)#64 | 0.48(-0.250)#1,546 |
| 65. | Laytonville | 0.23 | 0.49(-0.255)#65 | 0.48(-0.248)#1,572 |
| 66. | Mount Hebron | 0.24 | 0.49(-0.254)#66 | 0.48(-0.248)#1,583 |
| 67. | California Polytechnic State University | 0.24 | 0.49(-0.253)#67 | 0.48(-0.246)#1,600 |
| 68. | Yermo | 0.24 | 0.49(-0.252)#68 | 0.48(-0.246)#1,614 |
| 69. | Monterey Park Tract | 0.24 | 0.49(-0.252)#69 | 0.48(-0.245)#1,633 |
| 70. | Bridgeport | 0.24 | 0.49(-0.250)#70 | 0.48(-0.243)#1,667 |
| 71. | Topaz | 0.24 | 0.49(-0.250)#71 | 0.48(-0.243)#1,670 |
| 72. | Comptche | 0.24 | 0.49(-0.249)#72 | 0.48(-0.243)#1,683 |
| 73. | Coleville | 0.24 | 0.49(-0.247)#73 | 0.48(-0.240)#1,725 |
| 74. | Lake City | 0.24 | 0.49(-0.246)#74 | 0.48(-0.240)#1,734 |
| 75. | Vernon | 0.24 | 0.49(-0.245)#75 | 0.48(-0.238)#1,757 |
| 76. | Garey | 0.25 | 0.49(-0.243)#76 | 0.48(-0.237)#1,787 |
| 77. | Hardwick | 0.25 | 0.49(-0.243)#77 | 0.48(-0.236)#1,800 |
| 78. | Raisin City | 0.25 | 0.49(-0.242)#78 | 0.48(-0.236)#1,801 |
| 79. | Clipper Mills | 0.25 | 0.49(-0.240)#79 | 0.48(-0.234)#1,846 |
| 80. | Jovista | 0.25 | 0.49(-0.239)#80 | 0.48(-0.233)#1,873 |
| 81. | Mount Laguna | 0.25 | 0.49(-0.239)#81 | 0.48(-0.232)#1,881 |
| 82. | Monmouth | 0.25 | 0.49(-0.238)#82 | 0.48(-0.231)#1,903 |
| 83. | Shoshone | 0.25 | 0.49(-0.236)#83 | 0.48(-0.230)#1,935 |
| 84. | Drytown | 0.26 | 0.49(-0.234)#84 | 0.48(-0.228)#1,986 |
| 85. | Industry | 0.26 | 0.49(-0.234)#85 | 0.48(-0.227)#1,993 |
| 86. | Proberta | 0.26 | 0.49(-0.234)#86 | 0.48(-0.227)#1,996 |
| 87. | Julian | 0.26 | 0.49(-0.231)#87 | 0.48(-0.224)#2,053 |
| 88. | Petaluma Center | 0.26 | 0.49(-0.231)#88 | 0.48(-0.224)#2,055 |
| 89. | San Lucas | 0.26 | 0.49(-0.230)#89 | 0.48(-0.224)#2,069 |
| 90. | Cuyama | 0.26 | 0.49(-0.230)#90 | 0.48(-0.223)#2,091 |
| 91. | Randsburg | 0.26 | 0.49(-0.227)#91 | 0.48(-0.221)#2,147 |
| 92. | Pine Canyon | 0.26 | 0.49(-0.227)#92 | 0.48(-0.220)#2,156 |
| 93. | Litchfield | 0.26 | 0.49(-0.227)#93 | 0.48(-0.220)#2,162 |
| 94. | Palo Verde | 0.26 | 0.49(-0.226)#94 | 0.48(-0.220)#2,168 |
| 95. | College City | 0.26 | 0.49(-0.226)#95 | 0.48(-0.220)#2,172 |
| 96. | Samoa | 0.26 | 0.49(-0.226)#96 | 0.48(-0.219)#2,178 |
| 97. | Goodmanville | 0.26 | 0.49(-0.226)#97 | 0.48(-0.219)#2,190 |
| 98. | Carnelian Bay | 0.26 | 0.49(-0.226)#98 | 0.48(-0.219)#2,193 |
| 99. | Onyx | 0.26 | 0.49(-0.225)#99 | 0.48(-0.218)#2,216 |
| 100. | Stebbins | 0.27 | 0.49(-0.224)#100 | 0.48(-0.217)#2,253 |
Common Questions
What are the Top 10 Cities with the Lowest Inequality / Gini Index in California?
Top 10 Cities with the Lowest Inequality / Gini Index in California are:
#1
0.04
#2
0.04
#3
0.04
#4
0.05
#5
0.06
#6
0.06
#7
0.06
#8
0.07
#9
0.09
#10
0.11
What city has the Lowest Inequality / Gini Index in California?
Downieville has the Lowest Inequality / Gini Index in California with 0.04.
What is the Inequality / Gini Index in the State of California?
Inequality / Gini Index in California is 0.49.
What is the Inequality / Gini Index in the United States?
Inequality / Gini Index in the United States is 0.48.