Cities with the Highest Percentage of Panamanian Population in California
RELATED REPORTS & OPTIONS
Panamanian
California
Compare Cities
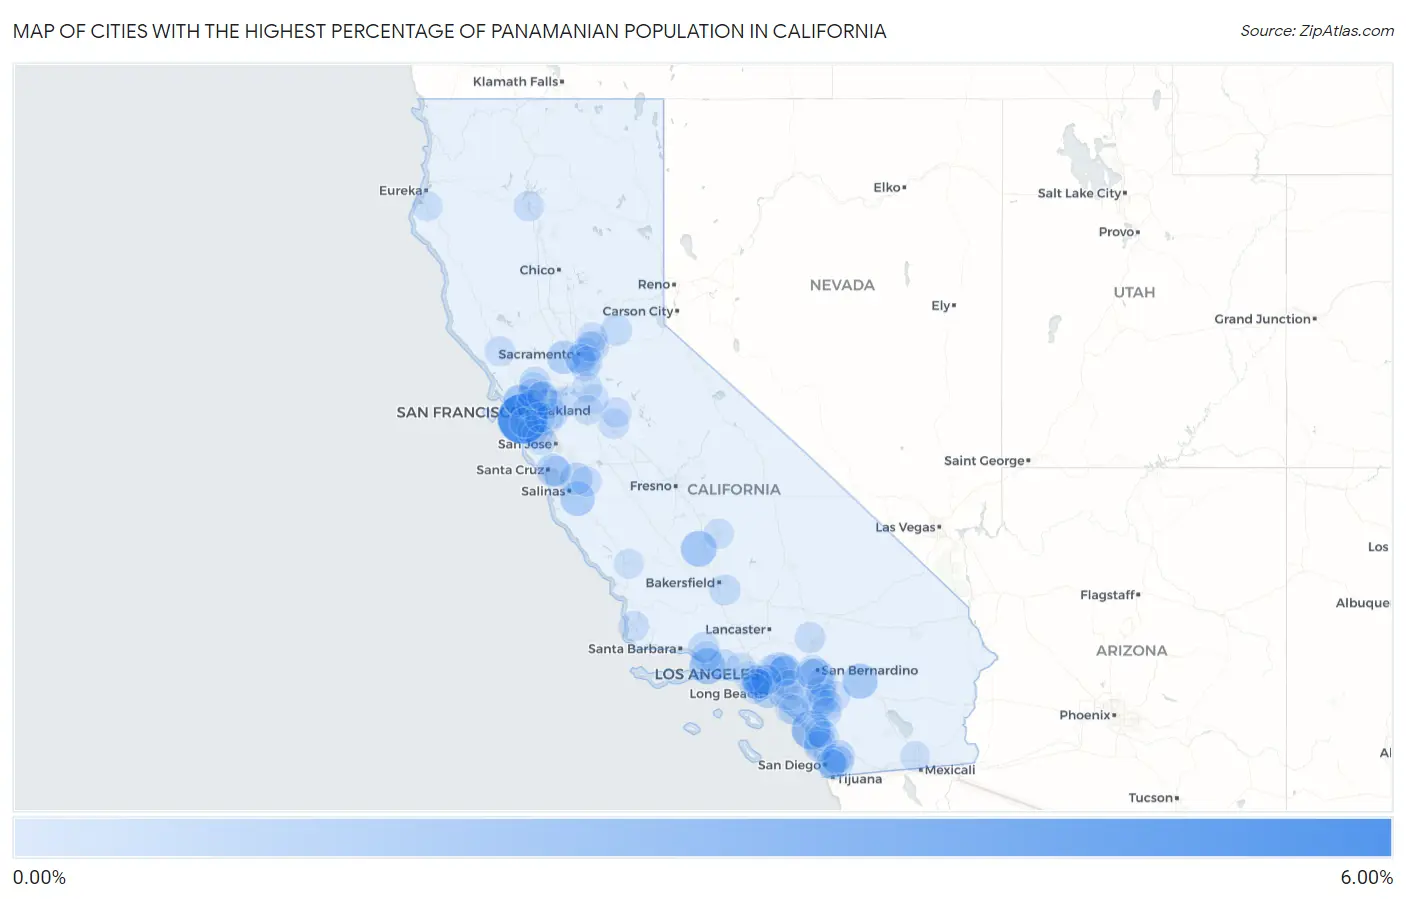
Map of Cities with the Highest Percentage of Panamanian Population in California
0.00%
6.00%
Cities with the Highest Percentage of Panamanian Population in California
| City | Panamanian | vs State | vs National | |
| 1. | Broadmoor | 6.00% | 0.055%(+5.94)#1 | 0.068%(+5.93)#20 |
| 2. | Camp Pendleton South | 2.74% | 0.055%(+2.69)#2 | 0.068%(+2.67)#49 |
| 3. | Channel Islands Beach | 1.85% | 0.055%(+1.79)#3 | 0.068%(+1.78)#86 |
| 4. | Allensworth | 1.74% | 0.055%(+1.69)#4 | 0.068%(+1.68)#93 |
| 5. | Highgrove | 1.63% | 0.055%(+1.57)#5 | 0.068%(+1.56)#100 |
| 6. | Desert Hot Springs | 1.58% | 0.055%(+1.53)#6 | 0.068%(+1.52)#103 |
| 7. | Chualar | 1.36% | 0.055%(+1.30)#7 | 0.068%(+1.29)#126 |
| 8. | Sonoma State University | 1.17% | 0.055%(+1.12)#8 | 0.068%(+1.10)#151 |
| 9. | Signal Hill | 1.10% | 0.055%(+1.05)#9 | 0.068%(+1.04)#164 |
| 10. | University Of California Davis | 1.05% | 0.055%(+0.990)#10 | 0.068%(+0.977)#182 |
| 11. | Alhambra Valley | 0.98% | 0.055%(+0.926)#11 | 0.068%(+0.914)#194 |
| 12. | Citrus | 0.97% | 0.055%(+0.919)#12 | 0.068%(+0.907)#195 |
| 13. | Capitola | 0.90% | 0.055%(+0.842)#13 | 0.068%(+0.829)#216 |
| 14. | San Juan Bautista | 0.76% | 0.055%(+0.704)#14 | 0.068%(+0.691)#274 |
| 15. | Corte Madera | 0.74% | 0.055%(+0.683)#15 | 0.068%(+0.671)#280 |
| 16. | Encinitas | 0.69% | 0.055%(+0.631)#16 | 0.068%(+0.618)#306 |
| 17. | Lakeside | 0.65% | 0.055%(+0.593)#17 | 0.068%(+0.580)#324 |
| 18. | Wildomar | 0.52% | 0.055%(+0.464)#18 | 0.068%(+0.451)#412 |
| 19. | American Canyon | 0.47% | 0.055%(+0.416)#19 | 0.068%(+0.403)#456 |
| 20. | Casa Conejo | 0.44% | 0.055%(+0.388)#20 | 0.068%(+0.375)#488 |
| 21. | Georgetown | 0.43% | 0.055%(+0.377)#21 | 0.068%(+0.364)#507 |
| 22. | Monrovia | 0.42% | 0.055%(+0.364)#22 | 0.068%(+0.352)#530 |
| 23. | Fairview | 0.40% | 0.055%(+0.342)#23 | 0.068%(+0.329)#550 |
| 24. | Brea | 0.39% | 0.055%(+0.336)#24 | 0.068%(+0.323)#562 |
| 25. | West Athens | 0.38% | 0.055%(+0.328)#25 | 0.068%(+0.316)#572 |
| 26. | Lamont | 0.36% | 0.055%(+0.302)#26 | 0.068%(+0.290)#601 |
| 27. | Mira Monte | 0.35% | 0.055%(+0.296)#27 | 0.068%(+0.283)#615 |
| 28. | Walnut Creek | 0.32% | 0.055%(+0.266)#28 | 0.068%(+0.253)#652 |
| 29. | Adelanto | 0.32% | 0.055%(+0.261)#29 | 0.068%(+0.248)#667 |
| 30. | Parkway | 0.31% | 0.055%(+0.253)#30 | 0.068%(+0.240)#679 |
| 31. | Rancho San Diego | 0.31% | 0.055%(+0.252)#31 | 0.068%(+0.240)#681 |
| 32. | Orangevale | 0.28% | 0.055%(+0.227)#32 | 0.068%(+0.214)#741 |
| 33. | La Mesa | 0.26% | 0.055%(+0.206)#33 | 0.068%(+0.193)#778 |
| 34. | Maywood | 0.26% | 0.055%(+0.205)#34 | 0.068%(+0.192)#781 |
| 35. | Highlands | 0.26% | 0.055%(+0.201)#35 | 0.068%(+0.189)#788 |
| 36. | Vandenberg Afb | 0.24% | 0.055%(+0.189)#36 | 0.068%(+0.177)#817 |
| 37. | Rio Del Mar | 0.24% | 0.055%(+0.189)#37 | 0.068%(+0.176)#819 |
| 38. | Kentfield | 0.24% | 0.055%(+0.188)#38 | 0.068%(+0.175)#821 |
| 39. | East San Gabriel | 0.24% | 0.055%(+0.188)#39 | 0.068%(+0.175)#823 |
| 40. | Solana Beach | 0.23% | 0.055%(+0.177)#40 | 0.068%(+0.164)#846 |
| 41. | Ridgemark | 0.23% | 0.055%(+0.176)#41 | 0.068%(+0.164)#847 |
| 42. | San Ramon | 0.23% | 0.055%(+0.176)#42 | 0.068%(+0.163)#850 |
| 43. | Rocklin | 0.23% | 0.055%(+0.175)#43 | 0.068%(+0.162)#853 |
| 44. | Lennox | 0.22% | 0.055%(+0.167)#44 | 0.068%(+0.155)#875 |
| 45. | Brentwood | 0.22% | 0.055%(+0.161)#45 | 0.068%(+0.148)#904 |
| 46. | Gardena | 0.22% | 0.055%(+0.160)#46 | 0.068%(+0.148)#906 |
| 47. | Arden Arcade | 0.21% | 0.055%(+0.158)#47 | 0.068%(+0.146)#913 |
| 48. | West Rancho Dominguez | 0.21% | 0.055%(+0.153)#48 | 0.068%(+0.140)#928 |
| 49. | Lake Elsinore | 0.20% | 0.055%(+0.149)#49 | 0.068%(+0.137)#942 |
| 50. | San Buenaventura Ventura | 0.20% | 0.055%(+0.149)#50 | 0.068%(+0.136)#943 |
| 51. | Hughson | 0.20% | 0.055%(+0.144)#51 | 0.068%(+0.132)#957 |
| 52. | Hemet | 0.20% | 0.055%(+0.142)#52 | 0.068%(+0.130)#969 |
| 53. | North Fair Oaks | 0.20% | 0.055%(+0.142)#53 | 0.068%(+0.129)#970 |
| 54. | Charter Oak | 0.19% | 0.055%(+0.138)#54 | 0.068%(+0.125)#983 |
| 55. | Belmont | 0.19% | 0.055%(+0.135)#55 | 0.068%(+0.123)#990 |
| 56. | Inglewood | 0.18% | 0.055%(+0.129)#56 | 0.068%(+0.117)#1,018 |
| 57. | Moreno Valley | 0.18% | 0.055%(+0.123)#57 | 0.068%(+0.111)#1,049 |
| 58. | Redding | 0.17% | 0.055%(+0.120)#58 | 0.068%(+0.107)#1,068 |
| 59. | Lake Forest | 0.17% | 0.055%(+0.119)#59 | 0.068%(+0.106)#1,071 |
| 60. | Perris | 0.17% | 0.055%(+0.117)#60 | 0.068%(+0.105)#1,077 |
| 61. | Oakdale | 0.17% | 0.055%(+0.114)#61 | 0.068%(+0.101)#1,092 |
| 62. | Vallejo | 0.17% | 0.055%(+0.113)#62 | 0.068%(+0.101)#1,093 |
| 63. | Elk Grove | 0.17% | 0.055%(+0.110)#63 | 0.068%(+0.097)#1,107 |
| 64. | Albany | 0.16% | 0.055%(+0.110)#64 | 0.068%(+0.097)#1,113 |
| 65. | Menifee | 0.16% | 0.055%(+0.108)#65 | 0.068%(+0.095)#1,120 |
| 66. | Lemon Hill | 0.16% | 0.055%(+0.107)#66 | 0.068%(+0.094)#1,126 |
| 67. | Porterville | 0.16% | 0.055%(+0.105)#67 | 0.068%(+0.092)#1,135 |
| 68. | Healdsburg | 0.16% | 0.055%(+0.102)#68 | 0.068%(+0.089)#1,144 |
| 69. | Covina | 0.16% | 0.055%(+0.101)#69 | 0.068%(+0.088)#1,146 |
| 70. | Rialto | 0.15% | 0.055%(+0.099)#70 | 0.068%(+0.086)#1,151 |
| 71. | Yorba Linda | 0.15% | 0.055%(+0.093)#71 | 0.068%(+0.081)#1,169 |
| 72. | San Bruno | 0.15% | 0.055%(+0.091)#72 | 0.068%(+0.078)#1,181 |
| 73. | Palo Alto | 0.14% | 0.055%(+0.089)#73 | 0.068%(+0.077)#1,184 |
| 74. | San Marcos | 0.14% | 0.055%(+0.085)#74 | 0.068%(+0.072)#1,203 |
| 75. | Garden Acres | 0.14% | 0.055%(+0.083)#75 | 0.068%(+0.071)#1,212 |
| 76. | San Leandro | 0.14% | 0.055%(+0.083)#76 | 0.068%(+0.070)#1,213 |
| 77. | Imperial | 0.14% | 0.055%(+0.082)#77 | 0.068%(+0.069)#1,217 |
| 78. | Hercules | 0.13% | 0.055%(+0.079)#78 | 0.068%(+0.067)#1,232 |
| 79. | Citrus Heights | 0.13% | 0.055%(+0.079)#79 | 0.068%(+0.067)#1,233 |
| 80. | French Valley | 0.13% | 0.055%(+0.078)#80 | 0.068%(+0.066)#1,240 |
| 81. | Santa Monica | 0.13% | 0.055%(+0.077)#81 | 0.068%(+0.065)#1,247 |
| 82. | Laguna Beach | 0.13% | 0.055%(+0.076)#82 | 0.068%(+0.063)#1,255 |
| 83. | Bloomington | 0.13% | 0.055%(+0.075)#83 | 0.068%(+0.062)#1,260 |
| 84. | Vista | 0.13% | 0.055%(+0.072)#84 | 0.068%(+0.059)#1,288 |
| 85. | Fortuna | 0.12% | 0.055%(+0.065)#85 | 0.068%(+0.052)#1,318 |
| 86. | Cudahy | 0.12% | 0.055%(+0.064)#86 | 0.068%(+0.051)#1,323 |
| 87. | La Presa | 0.12% | 0.055%(+0.064)#87 | 0.068%(+0.051)#1,324 |
| 88. | Vineyard | 0.12% | 0.055%(+0.062)#88 | 0.068%(+0.049)#1,337 |
| 89. | Calabasas | 0.12% | 0.055%(+0.062)#89 | 0.068%(+0.049)#1,340 |
| 90. | Tustin | 0.12% | 0.055%(+0.061)#90 | 0.068%(+0.048)#1,347 |
| 91. | Lodi | 0.11% | 0.055%(+0.059)#91 | 0.068%(+0.046)#1,357 |
| 92. | Temecula | 0.11% | 0.055%(+0.057)#92 | 0.068%(+0.044)#1,371 |
| 93. | Torrance | 0.11% | 0.055%(+0.056)#93 | 0.068%(+0.044)#1,373 |
| 94. | El Cajon | 0.11% | 0.055%(+0.056)#94 | 0.068%(+0.043)#1,376 |
| 95. | Martinez | 0.11% | 0.055%(+0.053)#95 | 0.068%(+0.040)#1,391 |
| 96. | Laguna Niguel | 0.11% | 0.055%(+0.051)#96 | 0.068%(+0.038)#1,398 |
| 97. | Lemon Grove | 0.11% | 0.055%(+0.050)#97 | 0.068%(+0.038)#1,399 |
| 98. | Hawthorne | 0.10% | 0.055%(+0.049)#98 | 0.068%(+0.037)#1,405 |
| 99. | Lathrop | 0.10% | 0.055%(+0.049)#99 | 0.068%(+0.037)#1,406 |
| 100. | El Paso De Robles Paso Robles | 0.10% | 0.055%(+0.049)#100 | 0.068%(+0.037)#1,408 |
Common Questions
What are the Top 10 Cities with the Highest Percentage of Panamanian Population in California?
Top 10 Cities with the Highest Percentage of Panamanian Population in California are:
#1
6.00%
#2
2.74%
#3
1.85%
#4
1.74%
#5
1.63%
#6
1.58%
#7
1.36%
#8
1.10%
#9
1.05%
#10
0.98%
What city has the Highest Percentage of Panamanian Population in California?
Broadmoor has the Highest Percentage of Panamanian Population in California with 6.00%.
What is the Percentage of Panamanian Population in the State of California?
Percentage of Panamanian Population in California is 0.055%.
What is the Percentage of Panamanian Population in the United States?
Percentage of Panamanian Population in the United States is 0.068%.