Zip Codes with the Highest Percentage of Population Employed in Installation, Maintenance & Repair in Desert Hot Springs, CA
RELATED REPORTS & OPTIONS
Installation, Maintenance & Repair
Desert Hot Springs
Compare Zip Codes
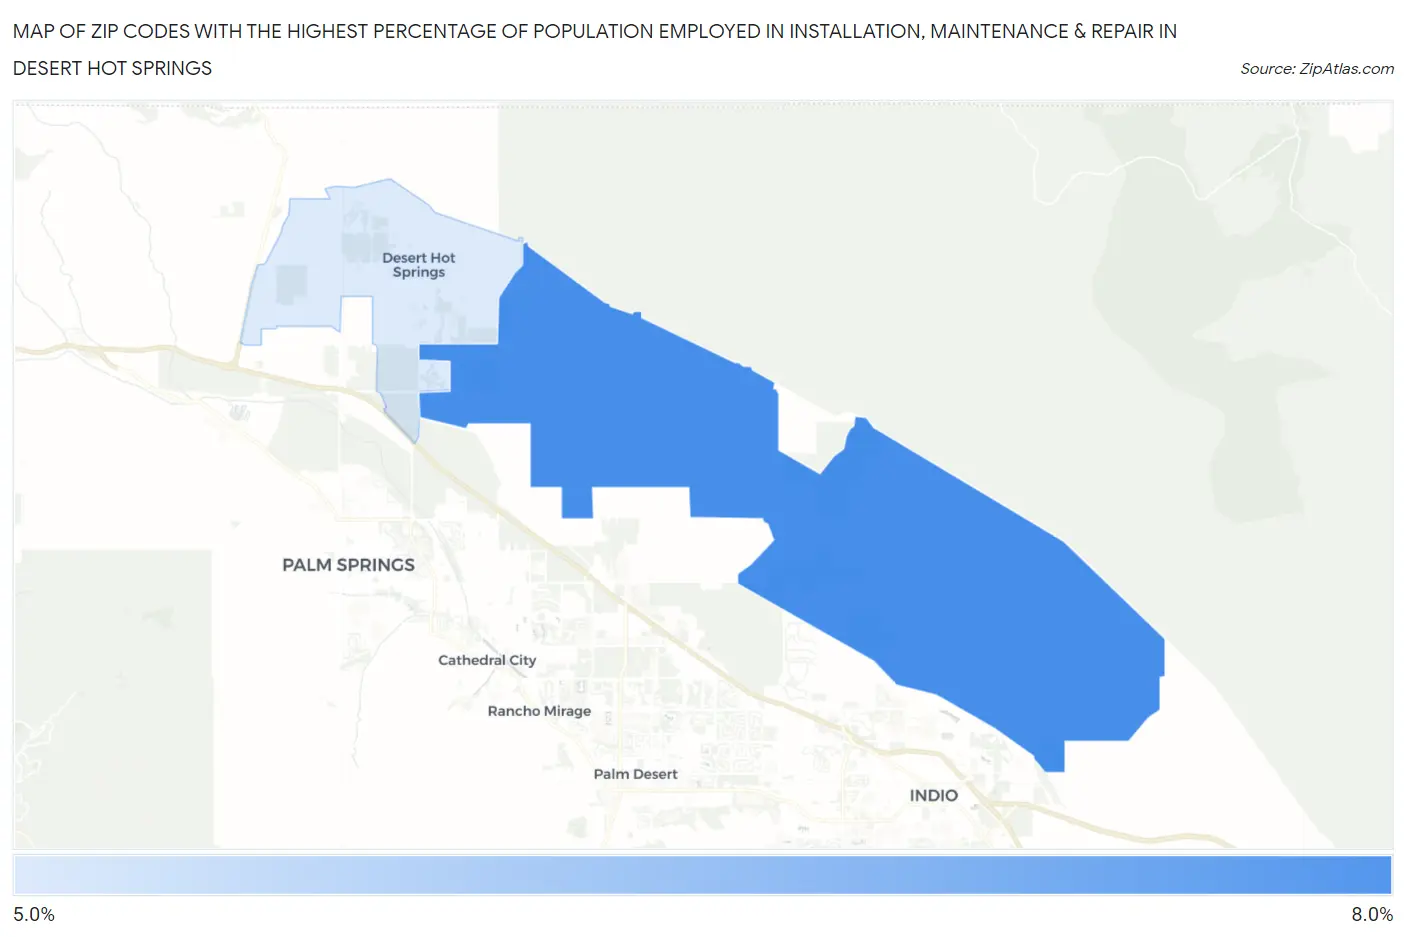
Map of Zip Codes with the Highest Percentage of Population Employed in Installation, Maintenance & Repair in Desert Hot Springs
5.2%
7.0%
Zip Codes with the Highest Percentage of Population Employed in Installation, Maintenance & Repair in Desert Hot Springs, CA
| Zip Code | % Employed | vs State | vs National | |
| 1. | 92241 | 7.0% | 2.6%(+4.43)#103 | 3.1%(+3.92)#4,456 |
| 2. | 92240 | 5.2% | 2.6%(+2.60)#186 | 3.1%(+2.09)#8,229 |
1
Common Questions
What are the Top Zip Codes with the Highest Percentage of Population Employed in Installation, Maintenance & Repair in Desert Hot Springs, CA?
Top Zip Codes with the Highest Percentage of Population Employed in Installation, Maintenance & Repair in Desert Hot Springs, CA are:
What zip code has the Highest Percentage of Population Employed in Installation, Maintenance & Repair in Desert Hot Springs, CA?
92241 has the Highest Percentage of Population Employed in Installation, Maintenance & Repair in Desert Hot Springs, CA with 7.0%.
What is the Percentage of Population Employed in Installation, Maintenance & Repair in Desert Hot Springs, CA?
Percentage of Population Employed in Installation, Maintenance & Repair in Desert Hot Springs is 5.8%.
What is the Percentage of Population Employed in Installation, Maintenance & Repair in California?
Percentage of Population Employed in Installation, Maintenance & Repair in California is 2.6%.
What is the Percentage of Population Employed in Installation, Maintenance & Repair in the United States?
Percentage of Population Employed in Installation, Maintenance & Repair in the United States is 3.1%.