Cities with the Highest Percentage of Households Residing in Condos/Apartments in California
RELATED REPORTS & OPTIONS
Condo/Apartment Residency
California
Compare Cities
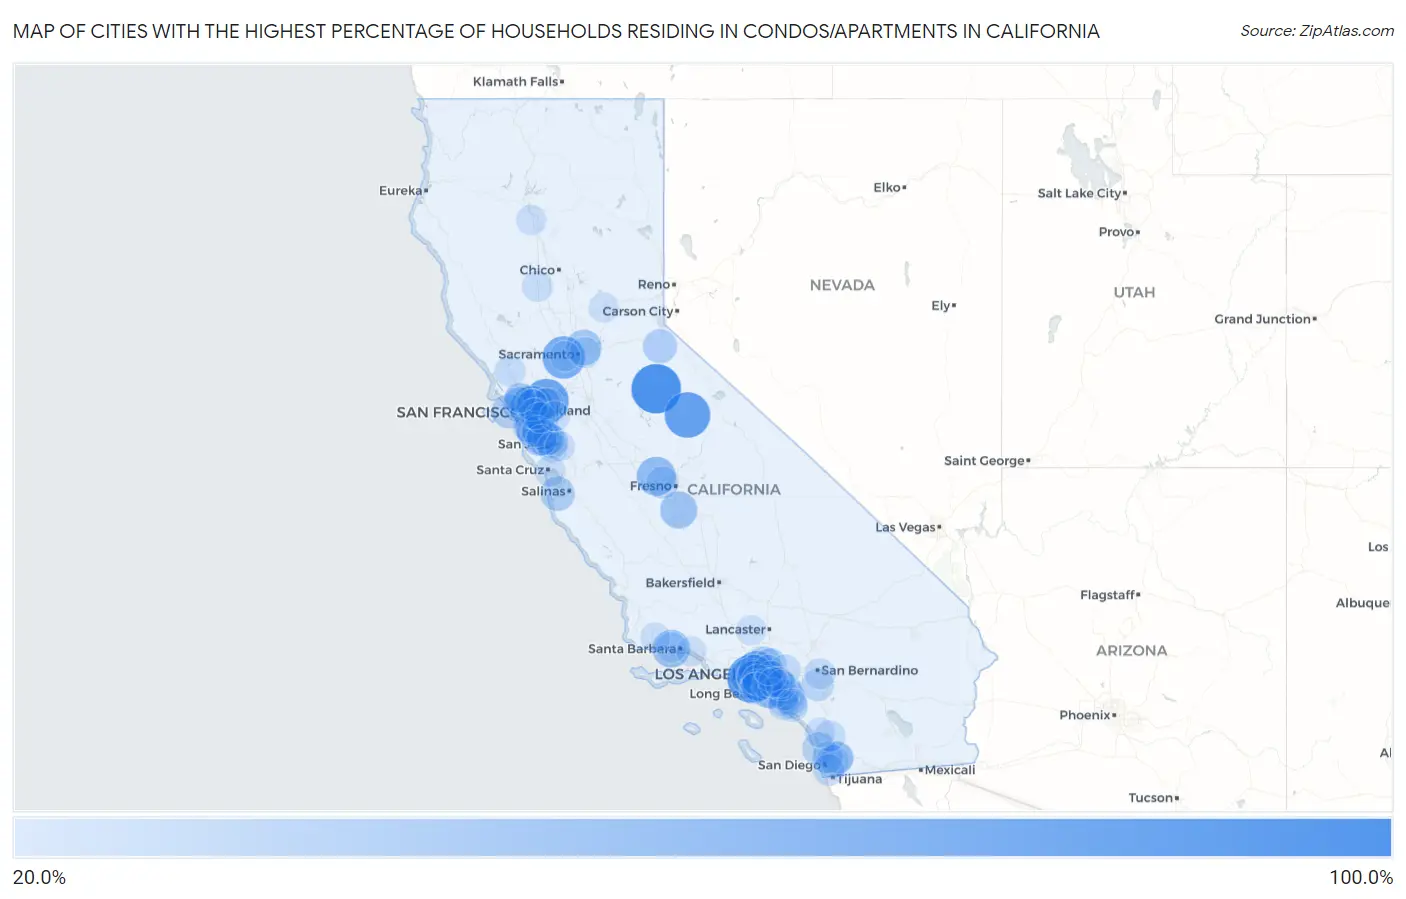
Map of Cities with the Highest Percentage of Households Residing in Condos/Apartments in California
0.0%
100.0%
Cities with the Highest Percentage of Households Residing in Condos/Apartments in California
| City | Detached Home Residency | vs State | vs National | |
| 1. | Long Barn | 100.0% | 17.8%(+82.2)#1 | 13.8%(+86.2)#5 |
| 2. | Marina Del Rey | 92.7% | 17.8%(+74.9)#2 | 13.8%(+78.9)#11 |
| 3. | Yosemite Valley | 83.8% | 17.8%(+66.0)#3 | 13.8%(+70.0)#24 |
| 4. | Contra Costa Centre | 79.9% | 17.8%(+62.1)#4 | 13.8%(+66.1)#27 |
| 5. | Strawberry Cdp Tuolumne County | 75.4% | 17.8%(+57.6)#5 | 13.8%(+61.6)#37 |
| 6. | Emeryville | 73.6% | 17.8%(+55.8)#6 | 13.8%(+59.8)#39 |
| 7. | University Of California Davis | 70.9% | 17.8%(+53.1)#7 | 13.8%(+57.1)#43 |
| 8. | West Hollywood | 63.2% | 17.8%(+45.4)#8 | 13.8%(+49.4)#56 |
| 9. | La Vina | 56.7% | 17.8%(+38.9)#9 | 13.8%(+42.9)#81 |
| 10. | Isla Vista | 51.5% | 17.8%(+33.7)#10 | 13.8%(+37.7)#119 |
| 11. | Vernon | 49.5% | 17.8%(+31.7)#11 | 13.8%(+35.7)#130 |
| 12. | Hardwick | 48.9% | 17.8%(+31.1)#12 | 13.8%(+35.1)#135 |
| 13. | Stanford | 48.6% | 17.8%(+30.8)#13 | 13.8%(+34.8)#138 |
| 14. | Santa Monica | 46.0% | 17.8%(+28.2)#14 | 13.8%(+32.2)#162 |
| 15. | Mcclellan Park | 43.5% | 17.8%(+25.7)#15 | 13.8%(+29.7)#195 |
| 16. | Marin City | 40.7% | 17.8%(+22.9)#16 | 13.8%(+26.9)#244 |
| 17. | Hawthorne | 40.3% | 17.8%(+22.5)#17 | 13.8%(+26.5)#250 |
| 18. | Mountain View | 39.2% | 17.8%(+21.4)#18 | 13.8%(+25.4)#271 |
| 19. | Glendale | 39.1% | 17.8%(+21.3)#19 | 13.8%(+25.3)#274 |
| 20. | Sand City | 38.4% | 17.8%(+20.6)#20 | 13.8%(+24.6)#291 |
| 21. | Los Angeles | 38.1% | 17.8%(+20.3)#21 | 13.8%(+24.3)#298 |
| 22. | Edison | 38.1% | 17.8%(+20.3)#22 | 13.8%(+24.3)#300 |
| 23. | San Francisco | 37.5% | 17.8%(+19.7)#23 | 13.8%(+23.7)#313 |
| 24. | Kirkwood | 37.3% | 17.8%(+19.5)#24 | 13.8%(+23.5)#319 |
| 25. | El Cajon | 35.5% | 17.8%(+17.7)#25 | 13.8%(+21.7)#370 |
| 26. | Woodville Farm Labor Camp | 35.4% | 17.8%(+17.6)#26 | 13.8%(+21.6)#377 |
| 27. | Santa Clara | 34.6% | 17.8%(+16.8)#27 | 13.8%(+20.8)#395 |
| 28. | Pasadena | 34.3% | 17.8%(+16.5)#28 | 13.8%(+20.5)#402 |
| 29. | Del Mar | 32.7% | 17.8%(+14.9)#29 | 13.8%(+18.9)#453 |
| 30. | Foster City | 32.5% | 17.8%(+14.7)#30 | 13.8%(+18.7)#465 |
| 31. | Culver City | 32.2% | 17.8%(+14.4)#31 | 13.8%(+18.4)#474 |
| 32. | Beverly Hills | 32.2% | 17.8%(+14.4)#32 | 13.8%(+18.4)#475 |
| 33. | San Mateo | 31.9% | 17.8%(+14.1)#33 | 13.8%(+18.1)#481 |
| 34. | La Mesa | 31.6% | 17.8%(+13.8)#34 | 13.8%(+17.8)#495 |
| 35. | Ashland | 31.6% | 17.8%(+13.8)#35 | 13.8%(+17.8)#498 |
| 36. | Signal Hill | 31.3% | 17.8%(+13.5)#36 | 13.8%(+17.5)#512 |
| 37. | Irvine | 30.5% | 17.8%(+12.7)#37 | 13.8%(+16.7)#547 |
| 38. | March Arb | 30.5% | 17.8%(+12.7)#38 | 13.8%(+16.7)#553 |
| 39. | Larkspur | 29.8% | 17.8%(+12.0)#39 | 13.8%(+16.0)#579 |
| 40. | East Palo Alto | 29.5% | 17.8%(+11.7)#40 | 13.8%(+15.7)#595 |
| 41. | Biola | 29.5% | 17.8%(+11.7)#41 | 13.8%(+15.7)#598 |
| 42. | Sunnyvale | 29.0% | 17.8%(+11.2)#42 | 13.8%(+15.2)#624 |
| 43. | Burlingame | 29.0% | 17.8%(+11.2)#43 | 13.8%(+15.2)#626 |
| 44. | Strawberry Cdp Marin County | 28.7% | 17.8%(+10.9)#44 | 13.8%(+14.9)#645 |
| 45. | Albany | 28.6% | 17.8%(+10.8)#45 | 13.8%(+14.8)#650 |
| 46. | Bostonia | 28.5% | 17.8%(+10.7)#46 | 13.8%(+14.7)#658 |
| 47. | Long Beach | 28.1% | 17.8%(+10.3)#47 | 13.8%(+14.3)#682 |
| 48. | Walnut Creek | 28.1% | 17.8%(+10.3)#48 | 13.8%(+14.3)#683 |
| 49. | Belmont | 28.1% | 17.8%(+10.3)#49 | 13.8%(+14.3)#684 |
| 50. | Tustin | 27.7% | 17.8%(+9.90)#50 | 13.8%(+13.9)#709 |
| 51. | Anaheim | 27.5% | 17.8%(+9.70)#51 | 13.8%(+13.7)#727 |
| 52. | Bellflower | 27.4% | 17.8%(+9.60)#52 | 13.8%(+13.6)#736 |
| 53. | National City | 27.4% | 17.8%(+9.60)#53 | 13.8%(+13.6)#737 |
| 54. | Oakland | 27.2% | 17.8%(+9.40)#54 | 13.8%(+13.4)#751 |
| 55. | Stanton | 27.2% | 17.8%(+9.40)#55 | 13.8%(+13.4)#752 |
| 56. | San Diego | 27.1% | 17.8%(+9.30)#56 | 13.8%(+13.3)#765 |
| 57. | Torrance | 27.1% | 17.8%(+9.30)#57 | 13.8%(+13.3)#766 |
| 58. | Saranap | 26.6% | 17.8%(+8.80)#58 | 13.8%(+12.8)#803 |
| 59. | East Whittier | 26.3% | 17.8%(+8.50)#59 | 13.8%(+12.5)#816 |
| 60. | Berkeley | 26.1% | 17.8%(+8.30)#60 | 13.8%(+12.3)#825 |
| 61. | Alondra Park | 25.9% | 17.8%(+8.10)#61 | 13.8%(+12.1)#844 |
| 62. | Escondido | 25.4% | 17.8%(+7.60)#62 | 13.8%(+11.6)#880 |
| 63. | Downey | 25.3% | 17.8%(+7.50)#63 | 13.8%(+11.5)#891 |
| 64. | Costa Mesa | 25.3% | 17.8%(+7.50)#64 | 13.8%(+11.5)#892 |
| 65. | Arden Arcade | 25.3% | 17.8%(+7.50)#65 | 13.8%(+11.5)#893 |
| 66. | Aliso Viejo | 25.3% | 17.8%(+7.50)#66 | 13.8%(+11.5)#895 |
| 67. | Loma Linda | 25.3% | 17.8%(+7.50)#67 | 13.8%(+11.5)#896 |
| 68. | Redwood City | 25.1% | 17.8%(+7.30)#68 | 13.8%(+11.3)#909 |
| 69. | Rohnert Park | 24.9% | 17.8%(+7.10)#69 | 13.8%(+11.1)#929 |
| 70. | Charter Oak | 24.9% | 17.8%(+7.10)#70 | 13.8%(+11.1)#938 |
| 71. | Inglewood | 24.8% | 17.8%(+7.00)#71 | 13.8%(+11.0)#939 |
| 72. | Santa Ana | 24.2% | 17.8%(+6.40)#72 | 13.8%(+10.4)#1,016 |
| 73. | Paramount | 24.1% | 17.8%(+6.30)#73 | 13.8%(+10.3)#1,028 |
| 74. | Willows | 24.1% | 17.8%(+6.30)#74 | 13.8%(+10.3)#1,034 |
| 75. | Seal Beach | 23.8% | 17.8%(+6.00)#75 | 13.8%(+10.00)#1,061 |
| 76. | Newport Beach | 23.7% | 17.8%(+5.90)#76 | 13.8%(+9.90)#1,065 |
| 77. | Alameda | 23.7% | 17.8%(+5.90)#77 | 13.8%(+9.90)#1,066 |
| 78. | Campbell | 23.7% | 17.8%(+5.90)#78 | 13.8%(+9.90)#1,067 |
| 79. | Twin Lakes | 23.6% | 17.8%(+5.80)#79 | 13.8%(+9.80)#1,086 |
| 80. | La Habra | 23.1% | 17.8%(+5.30)#80 | 13.8%(+9.30)#1,137 |
| 81. | Goleta | 23.1% | 17.8%(+5.30)#81 | 13.8%(+9.30)#1,139 |
| 82. | Montebello | 23.0% | 17.8%(+5.20)#82 | 13.8%(+9.20)#1,148 |
| 83. | Palo Alto | 22.7% | 17.8%(+4.90)#83 | 13.8%(+8.90)#1,185 |
| 84. | Fullerton | 22.5% | 17.8%(+4.70)#84 | 13.8%(+8.70)#1,203 |
| 85. | San Leandro | 22.5% | 17.8%(+4.70)#85 | 13.8%(+8.70)#1,205 |
| 86. | Davis | 22.5% | 17.8%(+4.70)#86 | 13.8%(+8.70)#1,206 |
| 87. | San Rafael | 22.4% | 17.8%(+4.60)#87 | 13.8%(+8.60)#1,221 |
| 88. | Redondo Beach | 22.3% | 17.8%(+4.50)#88 | 13.8%(+8.50)#1,232 |
| 89. | Cottonwood | 22.2% | 17.8%(+4.40)#89 | 13.8%(+8.40)#1,258 |
| 90. | Vista | 22.1% | 17.8%(+4.30)#90 | 13.8%(+8.30)#1,264 |
| 91. | South Pasadena | 22.1% | 17.8%(+4.30)#91 | 13.8%(+8.30)#1,269 |
| 92. | San Jose | 21.9% | 17.8%(+4.10)#92 | 13.8%(+8.10)#1,284 |
| 93. | Santa Fe Springs | 21.8% | 17.8%(+4.00)#93 | 13.8%(+8.00)#1,305 |
| 94. | Post Mountain | 21.8% | 17.8%(+4.00)#94 | 13.8%(+8.00)#1,314 |
| 95. | Grass Valley | 21.7% | 17.8%(+3.90)#95 | 13.8%(+7.90)#1,318 |
| 96. | Dublin | 21.5% | 17.8%(+3.70)#96 | 13.8%(+7.70)#1,344 |
| 97. | Solvang | 21.4% | 17.8%(+3.60)#97 | 13.8%(+7.60)#1,363 |
| 98. | Lake Hughes | 21.4% | 17.8%(+3.60)#98 | 13.8%(+7.60)#1,368 |
| 99. | Laguna Woods | 21.3% | 17.8%(+3.50)#99 | 13.8%(+7.50)#1,374 |
| 100. | Carpinteria | 21.3% | 17.8%(+3.50)#100 | 13.8%(+7.50)#1,376 |
Common Questions
What are the Top 10 Cities with the Highest Percentage of Households Residing in Condos/Apartments in California?
Top 10 Cities with the Highest Percentage of Households Residing in Condos/Apartments in California are:
#1
100.0%
#2
92.7%
#3
83.8%
#4
79.9%
#5
73.6%
#6
70.9%
#7
63.2%
#8
56.7%
#9
51.5%
#10
49.5%
What city has the Highest Percentage of Households Residing in Condos/Apartments in California?
Long Barn has the Highest Percentage of Households Residing in Condos/Apartments in California with 100.0%.
What is the Percentage of Households Residing in Condos/Apartments in the State of California?
Percentage of Households Residing in Condos/Apartments in California is 17.8%.
What is the Percentage of Households Residing in Condos/Apartments in the United States?
Percentage of Households Residing in Condos/Apartments in the United States is 13.8%.