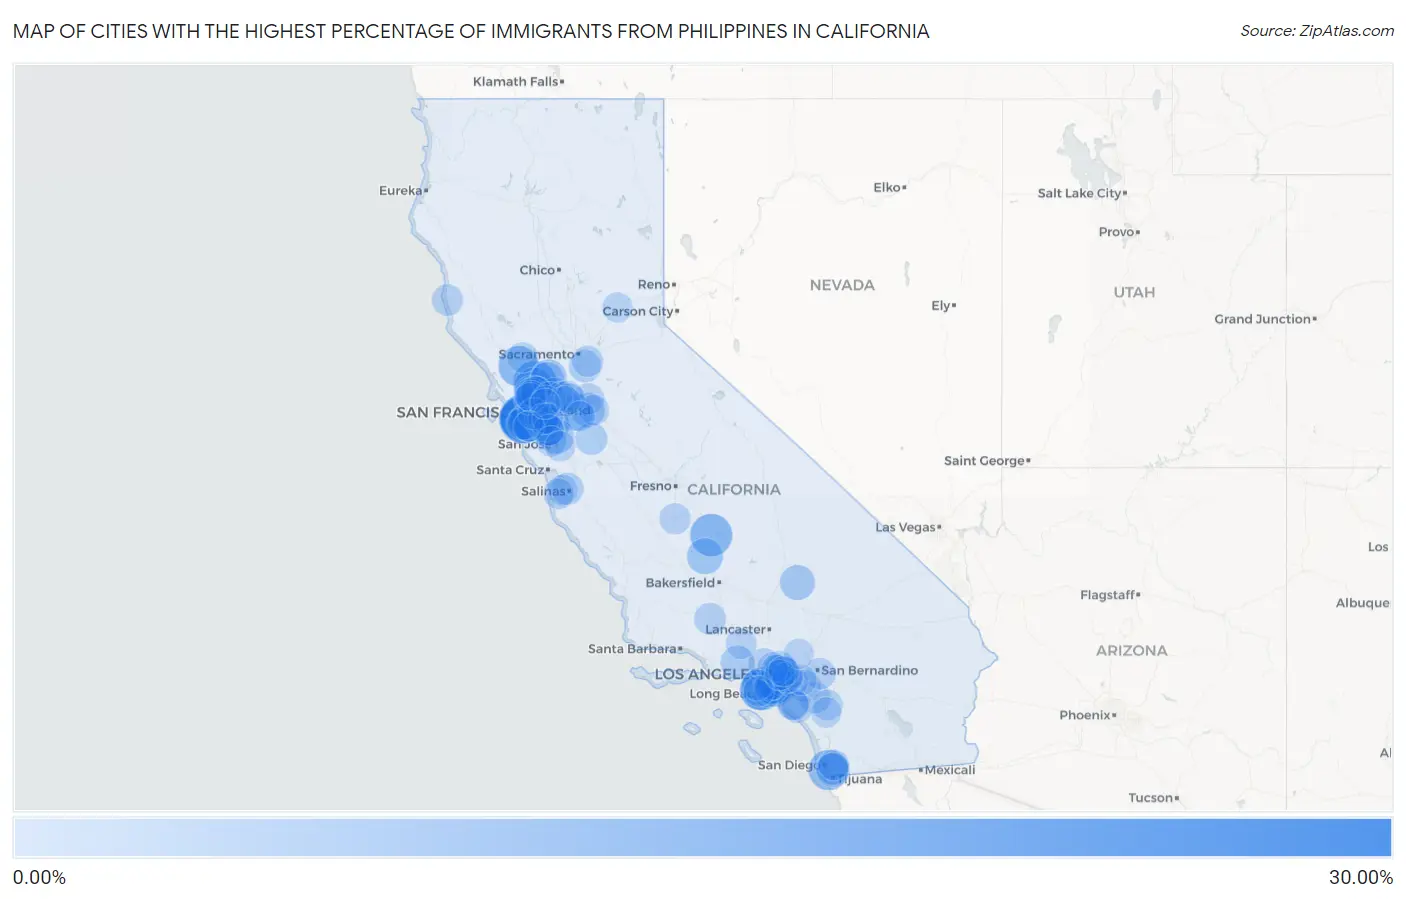
Cities with the Highest Percentage of Immigrants from Philippines in California
RELATED REPORTS & OPTIONS
Philippines
California
Compare Cities
Map of Cities with the Highest Percentage of Immigrants from Philippines in California
0.00%
30.00%
Cities with the Highest Percentage of Immigrants from Philippines in California
| City | Philippines | vs State | vs National | |
| 1. | Knights Ferry | 27.78% | 2.08%(+25.7)#-1 | 0.60%(+27.2)#0 |
| 2. | Daly City | 20.26% | 2.08%(+18.2)#85 | 0.60%(+19.7)#475 |
| 3. | Colma | 19.04% | 2.08%(+17.0)#86 | 0.60%(+18.4)#476 |
| 4. | Broadmoor | 15.91% | 2.08%(+13.8)#87 | 0.60%(+15.3)#477 |
| 5. | American Canyon | 14.78% | 2.08%(+12.7)#211 | 0.60%(+14.2)#1,098 |
| 6. | Carson | 14.22% | 2.08%(+12.1)#212 | 0.60%(+13.6)#1,099 |
| 7. | Poplar Cotton Center | 13.71% | 2.08%(+11.6)#213 | 0.60%(+13.1)#1,100 |
| 8. | South San Francisco | 12.39% | 2.08%(+10.3)#214 | 0.60%(+11.8)#1,101 |
| 9. | Kenwood | 12.32% | 2.08%(+10.2)#215 | 0.60%(+11.7)#1,102 |
| 10. | Union City | 12.29% | 2.08%(+10.2)#216 | 0.60%(+11.7)#1,103 |
| 11. | West Carson | 11.95% | 2.08%(+9.87)#217 | 0.60%(+11.4)#1,104 |
| 12. | National City | 11.92% | 2.08%(+9.84)#218 | 0.60%(+11.3)#1,105 |
| 13. | Vallejo | 11.55% | 2.08%(+9.47)#219 | 0.60%(+11.0)#1,114 |
| 14. | Artesia | 11.04% | 2.08%(+8.96)#220 | 0.60%(+10.4)#1,115 |
| 15. | La Palma | 10.40% | 2.08%(+8.33)#221 | 0.60%(+9.80)#1,116 |
| 16. | Cerritos | 9.33% | 2.08%(+7.25)#222 | 0.60%(+8.73)#1,117 |
| 17. | Hercules | 9.01% | 2.08%(+6.93)#223 | 0.60%(+8.41)#1,118 |
| 18. | Mountain House | 8.36% | 2.08%(+6.28)#224 | 0.60%(+7.76)#1,119 |
| 19. | Delano | 8.28% | 2.08%(+6.20)#225 | 0.60%(+7.68)#1,120 |
| 20. | Suisun City | 8.18% | 2.08%(+6.10)#226 | 0.60%(+7.58)#1,121 |
| 21. | San Lorenzo | 8.12% | 2.08%(+6.04)#227 | 0.60%(+7.52)#1,122 |
| 22. | Milpitas | 7.83% | 2.08%(+5.75)#228 | 0.60%(+7.23)#1,123 |
| 23. | Hayward | 7.75% | 2.08%(+5.67)#229 | 0.60%(+7.15)#1,124 |
| 24. | Rodeo | 7.52% | 2.08%(+5.44)#230 | 0.60%(+6.92)#1,125 |
| 25. | Walnut | 7.49% | 2.08%(+5.41)#231 | 0.60%(+6.89)#1,126 |
| 26. | Johannesburg | 7.45% | 2.08%(+5.37)#232 | 0.60%(+6.85)#1,127 |
| 27. | Lathrop | 7.02% | 2.08%(+4.94)#233 | 0.60%(+6.42)#1,128 |
| 28. | San Leandro | 7.02% | 2.08%(+4.94)#234 | 0.60%(+6.42)#1,129 |
| 29. | San Bruno | 7.00% | 2.08%(+4.92)#235 | 0.60%(+6.40)#1,130 |
| 30. | Pittsburg | 6.81% | 2.08%(+4.73)#236 | 0.60%(+6.21)#1,131 |
| 31. | Ashland | 6.33% | 2.08%(+4.25)#237 | 0.60%(+5.73)#1,132 |
| 32. | Pinole | 6.18% | 2.08%(+4.10)#238 | 0.60%(+5.58)#1,133 |
| 33. | Bell Canyon | 6.17% | 2.08%(+4.09)#239 | 0.60%(+5.57)#1,134 |
| 34. | Chula Vista | 6.12% | 2.08%(+4.04)#240 | 0.60%(+5.52)#1,135 |
| 35. | Fairfield | 5.99% | 2.08%(+3.91)#241 | 0.60%(+5.39)#1,136 |
| 36. | West Covina | 5.79% | 2.08%(+3.71)#242 | 0.60%(+5.19)#1,137 |
| 37. | Newark | 5.71% | 2.08%(+3.63)#243 | 0.60%(+5.11)#1,138 |
| 38. | Lakewood | 5.69% | 2.08%(+3.61)#244 | 0.60%(+5.09)#1,139 |
| 39. | Valinda | 5.29% | 2.08%(+3.21)#245 | 0.60%(+4.69)#1,140 |
| 40. | Buena Park | 5.26% | 2.08%(+3.18)#246 | 0.60%(+4.66)#1,141 |
| 41. | Diablo Grande | 5.17% | 2.08%(+3.09)#247 | 0.60%(+4.57)#1,142 |
| 42. | Elk Grove | 5.16% | 2.08%(+3.08)#248 | 0.60%(+4.56)#1,143 |
| 43. | Vincent | 5.02% | 2.08%(+2.94)#249 | 0.60%(+4.42)#1,144 |
| 44. | Bonita | 4.81% | 2.08%(+2.73)#250 | 0.60%(+4.21)#1,145 |
| 45. | Boronda | 4.72% | 2.08%(+2.64)#251 | 0.60%(+4.12)#1,146 |
| 46. | Rowland Heights | 4.64% | 2.08%(+2.56)#252 | 0.60%(+4.04)#1,147 |
| 47. | Signal Hill | 4.62% | 2.08%(+2.54)#253 | 0.60%(+4.02)#1,148 |
| 48. | Home Gardens | 4.58% | 2.08%(+2.50)#254 | 0.60%(+3.98)#1,149 |
| 49. | Crockett | 4.48% | 2.08%(+2.40)#255 | 0.60%(+3.88)#1,150 |
| 50. | Pine Mountain Club | 4.46% | 2.08%(+2.39)#256 | 0.60%(+3.86)#1,151 |
| 51. | Pacifica | 4.44% | 2.08%(+2.36)#257 | 0.60%(+3.84)#1,152 |
| 52. | San Pablo | 4.40% | 2.08%(+2.32)#258 | 0.60%(+3.80)#1,153 |
| 53. | Antioch | 4.35% | 2.08%(+2.27)#259 | 0.60%(+3.75)#1,154 |
| 54. | Warm Springs | 4.32% | 2.08%(+2.24)#260 | 0.60%(+3.72)#1,155 |
| 55. | Norwalk | 4.27% | 2.08%(+2.19)#261 | 0.60%(+3.67)#1,156 |
| 56. | Loma Linda | 4.24% | 2.08%(+2.16)#262 | 0.60%(+3.64)#1,157 |
| 57. | Mendocino | 4.24% | 2.08%(+2.16)#263 | 0.60%(+3.64)#1,158 |
| 58. | Laguna Woods | 4.19% | 2.08%(+2.12)#264 | 0.60%(+3.59)#1,159 |
| 59. | Bellflower | 4.15% | 2.08%(+2.07)#265 | 0.60%(+3.55)#1,215 |
| 60. | Oakley | 4.13% | 2.08%(+2.05)#266 | 0.60%(+3.53)#1,216 |
| 61. | Vineyard | 4.10% | 2.08%(+2.02)#267 | 0.60%(+3.50)#1,217 |
| 62. | Chino Hills | 4.09% | 2.08%(+2.01)#268 | 0.60%(+3.49)#1,218 |
| 63. | Lemoore | 4.07% | 2.08%(+1.99)#269 | 0.60%(+3.47)#1,219 |
| 64. | Contra Costa Centre | 4.01% | 2.08%(+1.93)#270 | 0.60%(+3.41)#1,220 |
| 65. | Glendale | 3.91% | 2.08%(+1.83)#271 | 0.60%(+3.31)#1,221 |
| 66. | Stockton | 3.89% | 2.08%(+1.81)#272 | 0.60%(+3.29)#1,222 |
| 67. | Concord | 3.87% | 2.08%(+1.79)#273 | 0.60%(+3.27)#1,223 |
| 68. | Alameda | 3.85% | 2.08%(+1.77)#274 | 0.60%(+3.25)#1,224 |
| 69. | Tara Hills | 3.83% | 2.08%(+1.75)#275 | 0.60%(+3.23)#1,225 |
| 70. | Ladera Ranch | 3.82% | 2.08%(+1.74)#276 | 0.60%(+3.22)#1,226 |
| 71. | Duarte | 3.80% | 2.08%(+1.72)#277 | 0.60%(+3.20)#1,227 |
| 72. | East Pasadena | 3.74% | 2.08%(+1.67)#278 | 0.60%(+3.15)#1,228 |
| 73. | Alondra Park | 3.74% | 2.08%(+1.66)#279 | 0.60%(+3.14)#1,229 |
| 74. | Laguna Hills | 3.67% | 2.08%(+1.59)#280 | 0.60%(+3.07)#1,230 |
| 75. | French Valley | 3.66% | 2.08%(+1.58)#281 | 0.60%(+3.06)#1,231 |
| 76. | Marina | 3.63% | 2.08%(+1.55)#282 | 0.60%(+3.03)#1,232 |
| 77. | Cherryland | 3.62% | 2.08%(+1.54)#283 | 0.60%(+3.02)#1,233 |
| 78. | Castaic | 3.60% | 2.08%(+1.52)#284 | 0.60%(+3.00)#1,234 |
| 79. | North El Monte | 3.59% | 2.08%(+1.51)#285 | 0.60%(+2.99)#1,235 |
| 80. | La Presa | 3.59% | 2.08%(+1.51)#286 | 0.60%(+2.99)#1,236 |
| 81. | Seaside | 3.54% | 2.08%(+1.46)#287 | 0.60%(+2.94)#1,237 |
| 82. | Manteca | 3.53% | 2.08%(+1.45)#288 | 0.60%(+2.93)#1,238 |
| 83. | Fairview | 3.52% | 2.08%(+1.44)#289 | 0.60%(+2.92)#1,239 |
| 84. | Fremont | 3.48% | 2.08%(+1.40)#290 | 0.60%(+2.88)#1,240 |
| 85. | Brentwood | 3.45% | 2.08%(+1.37)#291 | 0.60%(+2.85)#1,241 |
| 86. | Lomita | 3.44% | 2.08%(+1.36)#292 | 0.60%(+2.84)#1,242 |
| 87. | Eastvale | 3.43% | 2.08%(+1.35)#293 | 0.60%(+2.83)#1,243 |
| 88. | Burlingame | 3.41% | 2.08%(+1.33)#294 | 0.60%(+2.81)#1,244 |
| 89. | Knightsen | 3.40% | 2.08%(+1.32)#295 | 0.60%(+2.80)#1,245 |
| 90. | Santa Clara | 3.34% | 2.08%(+1.26)#296 | 0.60%(+2.74)#1,246 |
| 91. | Temecula | 3.32% | 2.08%(+1.24)#297 | 0.60%(+2.72)#1,247 |
| 92. | Diamond Bar | 3.31% | 2.08%(+1.23)#298 | 0.60%(+2.71)#1,248 |
| 93. | Saranap | 3.31% | 2.08%(+1.23)#299 | 0.60%(+2.71)#1,249 |
| 94. | Tracy | 3.30% | 2.08%(+1.22)#300 | 0.60%(+2.70)#1,250 |
| 95. | San Jose | 3.27% | 2.08%(+1.19)#301 | 0.60%(+2.67)#1,251 |
| 96. | Deer Park | 3.23% | 2.08%(+1.15)#302 | 0.60%(+2.63)#1,252 |
| 97. | Wrightwood | 3.23% | 2.08%(+1.15)#303 | 0.60%(+2.63)#1,253 |
| 98. | La Puente | 3.22% | 2.08%(+1.14)#304 | 0.60%(+2.62)#1,254 |
| 99. | Alta | 3.22% | 2.08%(+1.14)#305 | 0.60%(+2.62)#1,255 |
| 100. | Covina | 3.22% | 2.08%(+1.14)#306 | 0.60%(+2.62)#1,256 |
Common Questions
What are the Top 10 Cities with the Highest Percentage of Immigrants from Philippines in California?
Top 10 Cities with the Highest Percentage of Immigrants from Philippines in California are:
#1
20.26%
#2
19.04%
#3
15.91%
#4
14.78%
#5
14.22%
#6
13.71%
#7
12.39%
#8
12.32%
#9
12.29%
#10
11.95%
What city has the Highest Percentage of Immigrants from Philippines in California?
Daly City has the Highest Percentage of Immigrants from Philippines in California with 20.26%.
What is the Percentage of Immigrants from Philippines in the State of California?
Percentage of Immigrants from Philippines in California is 2.08%.
What is the Percentage of Immigrants from Philippines in the United States?
Percentage of Immigrants from Philippines in the United States is 0.60%.