Zip Codes with the Highest Percentage of Population Employed in Installation, Maintenance & Repair in San Jose, CA
RELATED REPORTS & OPTIONS
Installation, Maintenance & Repair
San Jose
Compare Zip Codes
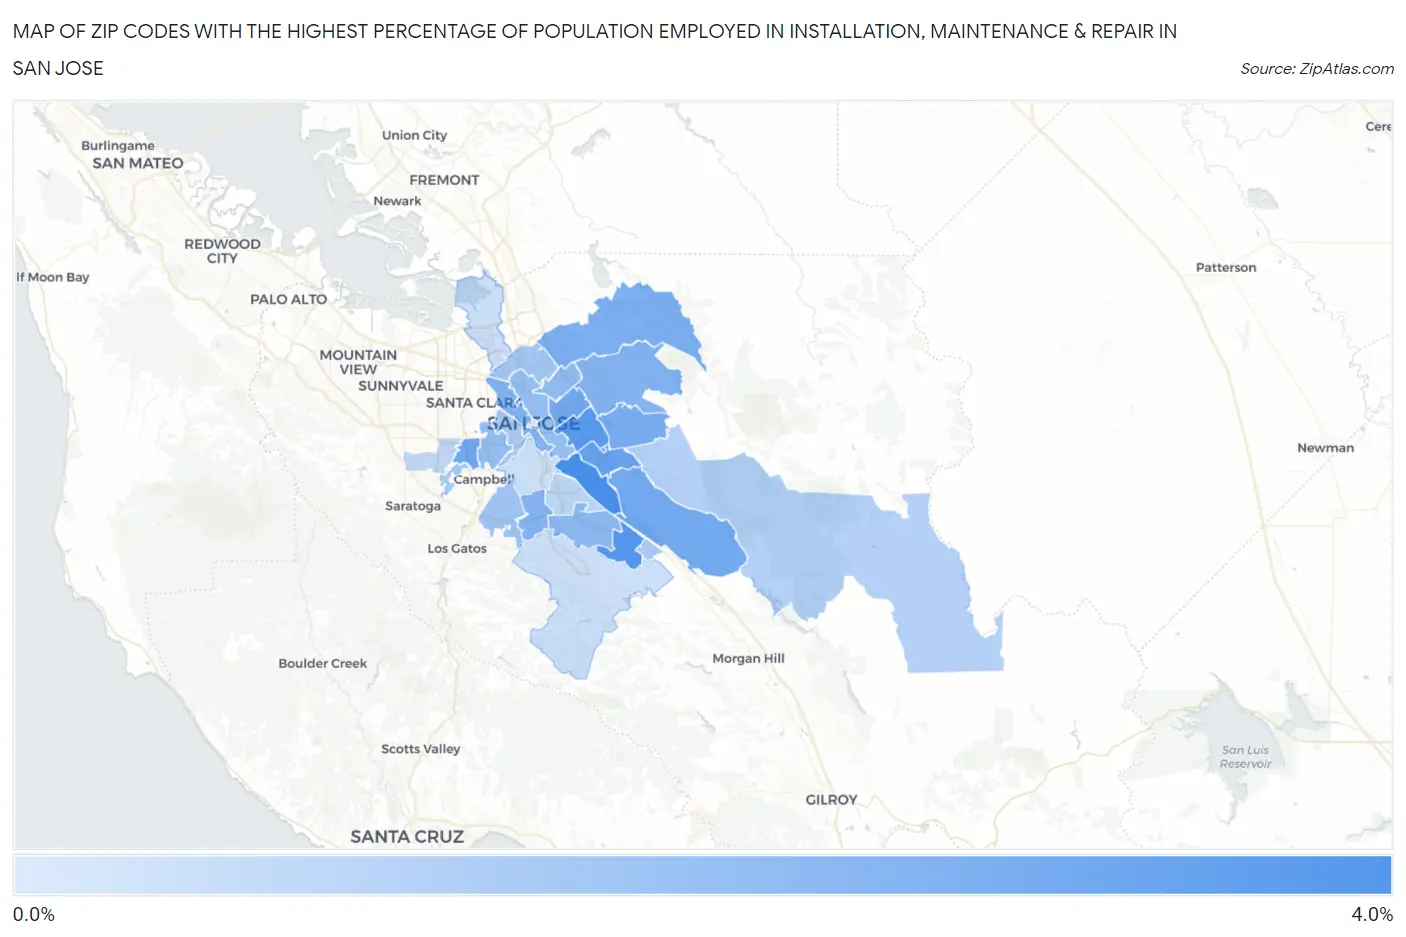
Map of Zip Codes with the Highest Percentage of Population Employed in Installation, Maintenance & Repair in San Jose
0.29%
3.7%
Zip Codes with the Highest Percentage of Population Employed in Installation, Maintenance & Repair in San Jose, CA
| Zip Code | % Employed | vs State | vs National | |
| 1. | 95111 | 3.7% | 2.6%(+1.19)#390 | 3.1%(+0.678)#13,480 |
| 2. | 95119 | 3.4% | 2.6%(+0.881)#471 | 3.1%(+0.369)#14,915 |
| 3. | 95122 | 3.3% | 2.6%(+0.788)#490 | 3.1%(+0.277)#15,345 |
| 4. | 95121 | 3.0% | 2.6%(+0.412)#608 | 3.1%(-0.100)#17,149 |
| 5. | 95117 | 2.8% | 2.6%(+0.243)#667 | 3.1%(-0.269)#18,014 |
| 6. | 95116 | 2.7% | 2.6%(+0.177)#696 | 3.1%(-0.334)#18,362 |
| 7. | 95138 | 2.7% | 2.6%(+0.153)#709 | 3.1%(-0.358)#18,493 |
| 8. | 95148 | 2.6% | 2.6%(+0.068)#740 | 3.1%(-0.443)#18,957 |
| 9. | 95132 | 2.5% | 2.6%(-0.048)#785 | 3.1%(-0.560)#19,512 |
| 10. | 95127 | 2.3% | 2.6%(-0.211)#854 | 3.1%(-0.722)#20,346 |
| 11. | 95110 | 2.3% | 2.6%(-0.238)#865 | 3.1%(-0.750)#20,489 |
| 12. | 95118 | 2.3% | 2.6%(-0.264)#872 | 3.1%(-0.775)#20,612 |
| 13. | 95123 | 2.1% | 2.6%(-0.436)#930 | 3.1%(-0.947)#21,441 |
| 14. | 95133 | 2.0% | 2.6%(-0.521)#962 | 3.1%(-1.03)#21,848 |
| 15. | 95112 | 1.9% | 2.6%(-0.609)#991 | 3.1%(-1.12)#22,258 |
| 16. | 95128 | 1.9% | 2.6%(-0.649)#1,004 | 3.1%(-1.16)#22,434 |
| 17. | 95124 | 1.6% | 2.6%(-0.923)#1,085 | 3.1%(-1.43)#23,629 |
| 18. | 95131 | 1.6% | 2.6%(-0.966)#1,100 | 3.1%(-1.48)#23,807 |
| 19. | 95130 | 1.5% | 2.6%(-1.03)#1,114 | 3.1%(-1.54)#24,069 |
| 20. | 95126 | 1.5% | 2.6%(-1.10)#1,126 | 3.1%(-1.61)#24,313 |
| 21. | 95139 | 1.4% | 2.6%(-1.12)#1,134 | 3.1%(-1.63)#24,433 |
| 22. | 95135 | 1.2% | 2.6%(-1.34)#1,194 | 3.1%(-1.85)#25,194 |
| 23. | 95136 | 1.00% | 2.6%(-1.56)#1,250 | 3.1%(-2.07)#25,932 |
| 24. | 95129 | 0.93% | 2.6%(-1.62)#1,267 | 3.1%(-2.14)#26,104 |
| 25. | 95134 | 0.72% | 2.6%(-1.83)#1,319 | 3.1%(-2.34)#26,717 |
| 26. | 95120 | 0.66% | 2.6%(-1.89)#1,339 | 3.1%(-2.40)#26,878 |
| 27. | 95125 | 0.61% | 2.6%(-1.95)#1,350 | 3.1%(-2.46)#26,984 |
| 28. | 95113 | 0.29% | 2.6%(-2.27)#1,416 | 3.1%(-2.78)#27,582 |
1
Common Questions
What are the Top 10 Zip Codes with the Highest Percentage of Population Employed in Installation, Maintenance & Repair in San Jose, CA?
Top 10 Zip Codes with the Highest Percentage of Population Employed in Installation, Maintenance & Repair in San Jose, CA are:
What zip code has the Highest Percentage of Population Employed in Installation, Maintenance & Repair in San Jose, CA?
95111 has the Highest Percentage of Population Employed in Installation, Maintenance & Repair in San Jose, CA with 3.7%.
What is the Percentage of Population Employed in Installation, Maintenance & Repair in San Jose, CA?
Percentage of Population Employed in Installation, Maintenance & Repair in San Jose is 2.0%.
What is the Percentage of Population Employed in Installation, Maintenance & Repair in California?
Percentage of Population Employed in Installation, Maintenance & Repair in California is 2.6%.
What is the Percentage of Population Employed in Installation, Maintenance & Repair in the United States?
Percentage of Population Employed in Installation, Maintenance & Repair in the United States is 3.1%.