Cities with the Highest Percentage of Subsaharan African Population in California
RELATED REPORTS & OPTIONS
Subsaharan African
California
Compare Cities
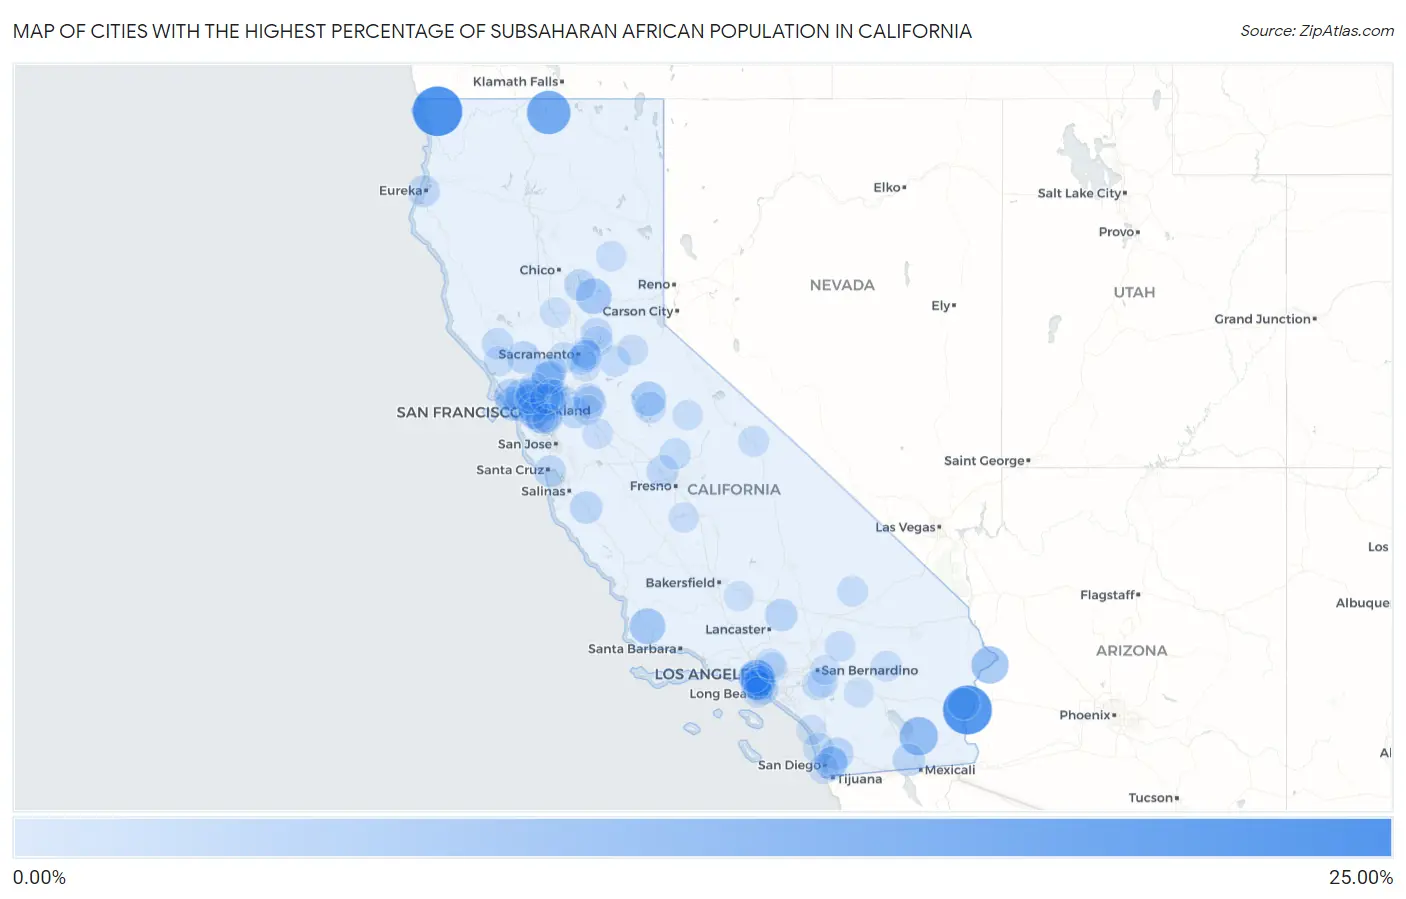
Map of Cities with the Highest Percentage of Subsaharan African Population in California
0.00%
25.00%
Cities with the Highest Percentage of Subsaharan African Population in California
| City | Subsaharan African | vs State | vs National | |
| 1. | Gasquet | 20.77% | 0.77%(+20.0)#1 | 1.22%(+19.5)#47 |
| 2. | Ripley | 20.03% | 0.77%(+19.3)#2 | 1.22%(+18.8)#52 |
| 3. | Macdoel | 14.69% | 0.77%(+13.9)#3 | 1.22%(+13.5)#104 |
| 4. | Calipatria | 9.44% | 0.77%(+8.67)#4 | 1.22%(+8.22)#232 |
| 5. | Bluewater | 8.38% | 0.77%(+7.61)#5 | 1.22%(+7.17)#283 |
| 6. | Bakersfield Country Club | 7.33% | 0.77%(+6.56)#6 | 1.22%(+6.11)#363 |
| 7. | Ladera Heights | 7.06% | 0.77%(+6.29)#7 | 1.22%(+5.85)#381 |
| 8. | Shell Ridge | 6.92% | 0.77%(+6.15)#8 | 1.22%(+5.70)#392 |
| 9. | Los Alamos | 6.83% | 0.77%(+6.07)#9 | 1.22%(+5.62)#397 |
| 10. | Dobbins | 6.67% | 0.77%(+5.90)#10 | 1.22%(+5.45)#408 |
| 11. | Camp Pendleton Mainside | 6.19% | 0.77%(+5.42)#11 | 1.22%(+4.97)#458 |
| 12. | Tuolumne City | 5.78% | 0.77%(+5.01)#12 | 1.22%(+4.57)#508 |
| 13. | Pacheco | 5.73% | 0.77%(+4.96)#13 | 1.22%(+4.52)#513 |
| 14. | View Park Windsor Hills | 5.65% | 0.77%(+4.88)#14 | 1.22%(+4.44)#525 |
| 15. | El Centro Naval Air Facility | 5.19% | 0.77%(+4.43)#15 | 1.22%(+3.98)#602 |
| 16. | Stinson Beach | 5.12% | 0.77%(+4.35)#16 | 1.22%(+3.91)#620 |
| 17. | Suisun City | 4.56% | 0.77%(+3.79)#17 | 1.22%(+3.34)#727 |
| 18. | Marin City | 4.24% | 0.77%(+3.47)#18 | 1.22%(+3.03)#796 |
| 19. | Hawthorne | 4.16% | 0.77%(+3.39)#19 | 1.22%(+2.94)#819 |
| 20. | West Athens | 4.08% | 0.77%(+3.32)#20 | 1.22%(+2.87)#836 |
| 21. | Ashland | 3.94% | 0.77%(+3.17)#21 | 1.22%(+2.72)#884 |
| 22. | Hercules | 3.92% | 0.77%(+3.16)#22 | 1.22%(+2.71)#887 |
| 23. | Lemon Grove | 3.81% | 0.77%(+3.04)#23 | 1.22%(+2.59)#921 |
| 24. | St Helena | 3.80% | 0.77%(+3.03)#24 | 1.22%(+2.58)#927 |
| 25. | Edwards Afb | 3.79% | 0.77%(+3.02)#25 | 1.22%(+2.57)#930 |
| 26. | Seeley | 3.76% | 0.77%(+2.99)#26 | 1.22%(+2.54)#939 |
| 27. | Soledad | 3.68% | 0.77%(+2.91)#27 | 1.22%(+2.47)#965 |
| 28. | Eucalyptus Hills | 3.67% | 0.77%(+2.90)#28 | 1.22%(+2.45)#969 |
| 29. | Inglewood | 3.64% | 0.77%(+2.87)#29 | 1.22%(+2.43)#976 |
| 30. | Fairfield | 3.61% | 0.77%(+2.84)#30 | 1.22%(+2.39)#988 |
| 31. | Santa Venetia | 3.59% | 0.77%(+2.82)#31 | 1.22%(+2.38)#990 |
| 32. | Taft Mosswood | 3.55% | 0.77%(+2.78)#32 | 1.22%(+2.33)#1,009 |
| 33. | Lagunitas Forest Knolls | 3.49% | 0.77%(+2.72)#33 | 1.22%(+2.28)#1,024 |
| 34. | Carson | 3.27% | 0.77%(+2.50)#34 | 1.22%(+2.06)#1,101 |
| 35. | Penryn | 3.24% | 0.77%(+2.47)#35 | 1.22%(+2.02)#1,126 |
| 36. | Blythe | 3.23% | 0.77%(+2.46)#36 | 1.22%(+2.01)#1,133 |
| 37. | Fairhaven | 3.23% | 0.77%(+2.46)#37 | 1.22%(+2.01)#1,135 |
| 38. | Parksdale | 3.16% | 0.77%(+2.39)#38 | 1.22%(+1.94)#1,162 |
| 39. | Twin Lakes | 3.14% | 0.77%(+2.37)#39 | 1.22%(+1.93)#1,176 |
| 40. | Kelly Ridge | 3.09% | 0.77%(+2.32)#40 | 1.22%(+1.88)#1,198 |
| 41. | Spring Valley Cdp San Diego County | 3.06% | 0.77%(+2.29)#41 | 1.22%(+1.85)#1,210 |
| 42. | Mountain House | 3.04% | 0.77%(+2.27)#42 | 1.22%(+1.82)#1,225 |
| 43. | Oakland | 2.99% | 0.77%(+2.22)#43 | 1.22%(+1.78)#1,247 |
| 44. | Castro Valley | 2.79% | 0.77%(+2.02)#44 | 1.22%(+1.57)#1,346 |
| 45. | Geyserville | 2.75% | 0.77%(+1.98)#45 | 1.22%(+1.53)#1,374 |
| 46. | Groveland | 2.71% | 0.77%(+1.94)#46 | 1.22%(+1.49)#1,395 |
| 47. | Yosemite Lakes | 2.60% | 0.77%(+1.83)#47 | 1.22%(+1.38)#1,457 |
| 48. | Rosemont | 2.58% | 0.77%(+1.81)#48 | 1.22%(+1.37)#1,468 |
| 49. | Del Mar | 2.50% | 0.77%(+1.73)#49 | 1.22%(+1.29)#1,524 |
| 50. | University Of California Davis | 2.49% | 0.77%(+1.72)#50 | 1.22%(+1.28)#1,529 |
| 51. | Plymouth | 2.47% | 0.77%(+1.70)#51 | 1.22%(+1.25)#1,546 |
| 52. | Gardena | 2.40% | 0.77%(+1.63)#52 | 1.22%(+1.19)#1,588 |
| 53. | Stockton | 2.39% | 0.77%(+1.62)#53 | 1.22%(+1.17)#1,598 |
| 54. | Vacaville | 2.31% | 0.77%(+1.55)#54 | 1.22%(+1.10)#1,663 |
| 55. | Twentynine Palms | 2.20% | 0.77%(+1.43)#55 | 1.22%(+0.981)#1,768 |
| 56. | Grizzly Flats | 2.18% | 0.77%(+1.41)#56 | 1.22%(+0.968)#1,782 |
| 57. | Fort Irwin | 2.17% | 0.77%(+1.41)#57 | 1.22%(+0.960)#1,795 |
| 58. | Bishop | 2.16% | 0.77%(+1.39)#58 | 1.22%(+0.942)#1,813 |
| 59. | Pinole | 2.14% | 0.77%(+1.37)#59 | 1.22%(+0.923)#1,828 |
| 60. | Alameda | 2.04% | 0.77%(+1.27)#60 | 1.22%(+0.821)#1,933 |
| 61. | Lucerne Valley | 2.01% | 0.77%(+1.24)#61 | 1.22%(+0.797)#1,960 |
| 62. | March Arb | 1.96% | 0.77%(+1.19)#62 | 1.22%(+0.742)#2,018 |
| 63. | San Leandro | 1.92% | 0.77%(+1.15)#63 | 1.22%(+0.707)#2,059 |
| 64. | Westmont | 1.90% | 0.77%(+1.13)#64 | 1.22%(+0.686)#2,081 |
| 65. | Lawndale | 1.88% | 0.77%(+1.11)#65 | 1.22%(+0.664)#2,103 |
| 66. | Coronado | 1.87% | 0.77%(+1.10)#66 | 1.22%(+0.650)#2,123 |
| 67. | Pittsburg | 1.86% | 0.77%(+1.09)#67 | 1.22%(+0.643)#2,132 |
| 68. | La Mesa | 1.85% | 0.77%(+1.09)#68 | 1.22%(+0.639)#2,138 |
| 69. | East Quincy | 1.83% | 0.77%(+1.06)#69 | 1.22%(+0.619)#2,169 |
| 70. | Granite Bay | 1.83% | 0.77%(+1.06)#70 | 1.22%(+0.615)#2,176 |
| 71. | Patterson | 1.83% | 0.77%(+1.06)#71 | 1.22%(+0.614)#2,178 |
| 72. | Culver City | 1.83% | 0.77%(+1.06)#72 | 1.22%(+0.614)#2,179 |
| 73. | Altadena | 1.82% | 0.77%(+1.05)#73 | 1.22%(+0.601)#2,194 |
| 74. | Emeryville | 1.79% | 0.77%(+1.02)#74 | 1.22%(+0.576)#2,224 |
| 75. | Elk Grove | 1.77% | 0.77%(+1.00)#75 | 1.22%(+0.558)#2,248 |
| 76. | Petaluma Center | 1.77% | 0.77%(+0.998)#76 | 1.22%(+0.552)#2,256 |
| 77. | Richmond | 1.75% | 0.77%(+0.986)#77 | 1.22%(+0.540)#2,273 |
| 78. | Pepperdine University | 1.75% | 0.77%(+0.982)#78 | 1.22%(+0.536)#2,278 |
| 79. | Rolling Hills Estates | 1.73% | 0.77%(+0.960)#79 | 1.22%(+0.514)#2,317 |
| 80. | Yosemite Valley | 1.73% | 0.77%(+0.958)#80 | 1.22%(+0.512)#2,318 |
| 81. | Home Garden | 1.72% | 0.77%(+0.952)#81 | 1.22%(+0.506)#2,330 |
| 82. | La Riviera | 1.72% | 0.77%(+0.947)#82 | 1.22%(+0.501)#2,336 |
| 83. | Forestville | 1.71% | 0.77%(+0.938)#83 | 1.22%(+0.492)#2,345 |
| 84. | Green Valley Cdp Solano County | 1.70% | 0.77%(+0.933)#84 | 1.22%(+0.487)#2,352 |
| 85. | Vallejo | 1.70% | 0.77%(+0.927)#85 | 1.22%(+0.481)#2,360 |
| 86. | Lathrop | 1.69% | 0.77%(+0.918)#86 | 1.22%(+0.472)#2,377 |
| 87. | Moreno Valley | 1.68% | 0.77%(+0.914)#87 | 1.22%(+0.468)#2,379 |
| 88. | Palm Springs | 1.66% | 0.77%(+0.895)#88 | 1.22%(+0.450)#2,410 |
| 89. | East Pasadena | 1.66% | 0.77%(+0.893)#89 | 1.22%(+0.447)#2,413 |
| 90. | Bay Point | 1.66% | 0.77%(+0.886)#90 | 1.22%(+0.440)#2,426 |
| 91. | Camp Pendleton South | 1.65% | 0.77%(+0.881)#91 | 1.22%(+0.435)#2,436 |
| 92. | Arden Arcade | 1.63% | 0.77%(+0.863)#92 | 1.22%(+0.417)#2,462 |
| 93. | Parkway | 1.63% | 0.77%(+0.856)#93 | 1.22%(+0.410)#2,469 |
| 94. | Pleasant Hill | 1.61% | 0.77%(+0.839)#94 | 1.22%(+0.393)#2,496 |
| 95. | Meridian | 1.60% | 0.77%(+0.827)#95 | 1.22%(+0.381)#2,514 |
| 96. | Fairview | 1.59% | 0.77%(+0.818)#96 | 1.22%(+0.372)#2,525 |
| 97. | Sonoma State University | 1.58% | 0.77%(+0.813)#97 | 1.22%(+0.367)#2,536 |
| 98. | Bear Valley Springs | 1.54% | 0.77%(+0.767)#98 | 1.22%(+0.321)#2,593 |
| 99. | Highland | 1.51% | 0.77%(+0.738)#99 | 1.22%(+0.292)#2,638 |
| 100. | Brentwood | 1.51% | 0.77%(+0.736)#100 | 1.22%(+0.290)#2,643 |
Common Questions
What are the Top 10 Cities with the Highest Percentage of Subsaharan African Population in California?
Top 10 Cities with the Highest Percentage of Subsaharan African Population in California are:
#1
20.77%
#2
20.03%
#3
14.69%
#4
9.44%
#5
8.38%
#6
7.06%
#7
6.92%
#8
6.83%
#9
6.67%
#10
5.78%
What city has the Highest Percentage of Subsaharan African Population in California?
Gasquet has the Highest Percentage of Subsaharan African Population in California with 20.77%.
What is the Percentage of Subsaharan African Population in the State of California?
Percentage of Subsaharan African Population in California is 0.77%.
What is the Percentage of Subsaharan African Population in the United States?
Percentage of Subsaharan African Population in the United States is 1.22%.