Cities with the Highest Percentage of Population Employed in Installation, Maintenance & Repair in Ohio
RELATED REPORTS & OPTIONS
Installation, Maintenance & Repair
Ohio
Compare Cities
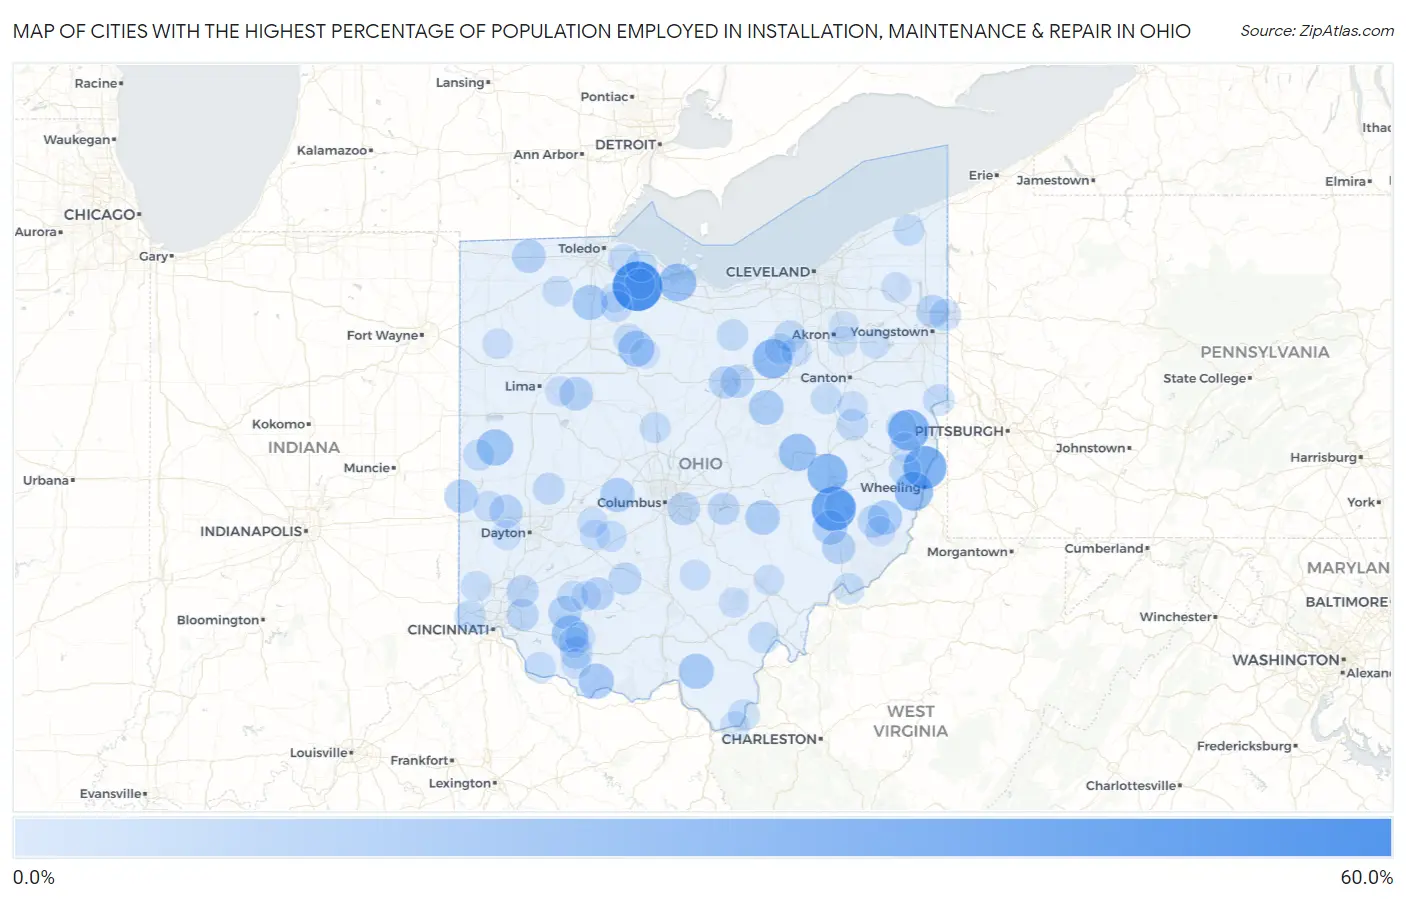
Map of Cities with the Highest Percentage of Population Employed in Installation, Maintenance & Repair in Ohio
0.0%
60.0%
Cities with the Highest Percentage of Population Employed in Installation, Maintenance & Repair in Ohio
| City | % Employed | vs State | vs National | |
| 1. | Hessville | 51.2% | 3.1%(+48.2)#1 | 3.1%(+48.2)#68 |
| 2. | Buffalo | 39.5% | 3.1%(+36.4)#2 | 3.1%(+36.4)#148 |
| 3. | Connorville | 36.6% | 3.1%(+33.5)#3 | 3.1%(+33.5)#183 |
| 4. | East Springfield | 32.5% | 3.1%(+29.4)#4 | 3.1%(+29.4)#246 |
| 5. | Petersburg | 32.2% | 3.1%(+29.2)#5 | 3.1%(+29.1)#249 |
| 6. | Kimbolton | 30.2% | 3.1%(+27.2)#6 | 3.1%(+27.2)#279 |
| 7. | Congress | 29.0% | 3.1%(+26.0)#7 | 3.1%(+26.0)#306 |
| 8. | Neffs | 27.8% | 3.1%(+24.8)#8 | 3.1%(+24.8)#336 |
| 9. | Medway | 26.6% | 3.1%(+23.6)#9 | 3.1%(+23.6)#362 |
| 10. | Lloydsville | 26.5% | 3.1%(+23.4)#10 | 3.1%(+23.4)#366 |
| 11. | Whites Landing | 25.4% | 3.1%(+22.3)#11 | 3.1%(+22.3)#396 |
| 12. | Canal Lewisville | 24.6% | 3.1%(+21.5)#12 | 3.1%(+21.5)#442 |
| 13. | Ai | 23.7% | 3.1%(+20.6)#13 | 3.1%(+20.6)#474 |
| 14. | Buford | 22.9% | 3.1%(+19.9)#14 | 3.1%(+19.9)#506 |
| 15. | Yorkshire | 22.7% | 3.1%(+19.7)#15 | 3.1%(+19.7)#514 |
| 16. | Mccutchenville | 21.8% | 3.1%(+18.7)#16 | 3.1%(+18.7)#555 |
| 17. | Bentonville | 20.5% | 3.1%(+17.5)#17 | 3.1%(+17.4)#635 |
| 18. | South Webster | 20.1% | 3.1%(+17.0)#18 | 3.1%(+17.0)#668 |
| 19. | Rudolph | 19.6% | 3.1%(+16.6)#19 | 3.1%(+16.6)#697 |
| 20. | Bolton | 19.5% | 3.1%(+16.4)#20 | 3.1%(+16.4)#704 |
| 21. | Nashville | 19.0% | 3.1%(+15.9)#21 | 3.1%(+15.9)#733 |
| 22. | Fultonham | 18.8% | 3.1%(+15.8)#22 | 3.1%(+15.8)#741 |
| 23. | Belle Valley | 18.6% | 3.1%(+15.5)#23 | 3.1%(+15.5)#762 |
| 24. | Wilson | 18.2% | 3.1%(+15.1)#24 | 3.1%(+15.1)#798 |
| 25. | Plumwood | 18.1% | 3.1%(+15.0)#25 | 3.1%(+15.0)#814 |
| 26. | Hollansburg | 16.9% | 3.1%(+13.9)#26 | 3.1%(+13.9)#908 |
| 27. | Mcguffey | 16.7% | 3.1%(+13.6)#27 | 3.1%(+13.6)#933 |
| 28. | Tedrow | 16.7% | 3.1%(+13.6)#28 | 3.1%(+13.6)#935 |
| 29. | St Martin | 16.3% | 3.1%(+13.2)#29 | 3.1%(+13.2)#990 |
| 30. | Mifflin | 15.9% | 3.1%(+12.8)#30 | 3.1%(+12.8)#1,034 |
| 31. | Phillipsburg | 15.8% | 3.1%(+12.8)#31 | 3.1%(+12.8)#1,037 |
| 32. | Dexter City | 15.8% | 3.1%(+12.7)#32 | 3.1%(+12.7)#1,043 |
| 33. | Jacksontown | 15.2% | 3.1%(+12.2)#33 | 3.1%(+12.1)#1,117 |
| 34. | Highland | 15.1% | 3.1%(+12.0)#34 | 3.1%(+12.0)#1,148 |
| 35. | Vienna Center | 14.9% | 3.1%(+11.8)#35 | 3.1%(+11.8)#1,176 |
| 36. | Lawrenceville | 14.9% | 3.1%(+11.8)#36 | 3.1%(+11.8)#1,178 |
| 37. | Brice | 14.9% | 3.1%(+11.8)#37 | 3.1%(+11.8)#1,180 |
| 38. | Lake Waynoka | 14.5% | 3.1%(+11.5)#38 | 3.1%(+11.5)#1,226 |
| 39. | Miltonsburg | 14.3% | 3.1%(+11.2)#39 | 3.1%(+11.2)#1,278 |
| 40. | Lincoln Heights | 14.1% | 3.1%(+11.1)#40 | 3.1%(+11.1)#1,306 |
| 41. | Good Hope | 14.1% | 3.1%(+11.1)#41 | 3.1%(+11.1)#1,309 |
| 42. | Fairfield Beach | 13.8% | 3.1%(+10.8)#42 | 3.1%(+10.8)#1,372 |
| 43. | Mulberry | 13.8% | 3.1%(+10.7)#43 | 3.1%(+10.7)#1,384 |
| 44. | Kings Mills | 13.6% | 3.1%(+10.5)#44 | 3.1%(+10.5)#1,427 |
| 45. | Christiansburg | 13.2% | 3.1%(+10.2)#45 | 3.1%(+10.2)#1,506 |
| 46. | Harrisville | 13.2% | 3.1%(+10.2)#46 | 3.1%(+10.2)#1,508 |
| 47. | Roswell | 12.9% | 3.1%(+9.87)#47 | 3.1%(+9.86)#1,590 |
| 48. | Masury | 12.8% | 3.1%(+9.73)#48 | 3.1%(+9.72)#1,632 |
| 49. | Risingsun | 12.8% | 3.1%(+9.69)#49 | 3.1%(+9.69)#1,642 |
| 50. | Chippewa Lake | 12.7% | 3.1%(+9.61)#50 | 3.1%(+9.61)#1,651 |
| 51. | New London | 12.6% | 3.1%(+9.50)#51 | 3.1%(+9.49)#1,680 |
| 52. | La Croft | 12.4% | 3.1%(+9.35)#52 | 3.1%(+9.34)#1,724 |
| 53. | Athalia | 12.4% | 3.1%(+9.34)#53 | 3.1%(+9.33)#1,727 |
| 54. | Clay Center | 12.4% | 3.1%(+9.33)#54 | 3.1%(+9.32)#1,728 |
| 55. | Rutland | 12.4% | 3.1%(+9.29)#55 | 3.1%(+9.29)#1,737 |
| 56. | Austinburg | 12.3% | 3.1%(+9.22)#56 | 3.1%(+9.21)#1,753 |
| 57. | Grandview | 12.3% | 3.1%(+9.20)#57 | 3.1%(+9.19)#1,762 |
| 58. | Senecaville | 12.1% | 3.1%(+9.07)#58 | 3.1%(+9.07)#1,790 |
| 59. | Rossburg | 12.1% | 3.1%(+9.04)#59 | 3.1%(+9.03)#1,797 |
| 60. | Rocky Ridge | 12.1% | 3.1%(+9.01)#60 | 3.1%(+9.00)#1,805 |
| 61. | Reno | 11.8% | 3.1%(+8.76)#61 | 3.1%(+8.76)#1,880 |
| 62. | Felicity | 11.8% | 3.1%(+8.70)#62 | 3.1%(+8.70)#1,891 |
| 63. | Sullivan | 11.7% | 3.1%(+8.63)#63 | 3.1%(+8.63)#1,918 |
| 64. | Burbank | 11.7% | 3.1%(+8.62)#64 | 3.1%(+8.61)#1,922 |
| 65. | Waldo | 11.6% | 3.1%(+8.54)#65 | 3.1%(+8.53)#1,940 |
| 66. | Midway | 11.5% | 3.1%(+8.44)#66 | 3.1%(+8.44)#1,980 |
| 67. | Woodworth | 11.5% | 3.1%(+8.43)#67 | 3.1%(+8.43)#1,982 |
| 68. | Beach City | 11.4% | 3.1%(+8.33)#68 | 3.1%(+8.32)#2,022 |
| 69. | Martinsville | 11.3% | 3.1%(+8.24)#69 | 3.1%(+8.24)#2,051 |
| 70. | Amsterdam | 11.0% | 3.1%(+7.90)#70 | 3.1%(+7.89)#2,155 |
| 71. | Ithaca | 11.0% | 3.1%(+7.90)#71 | 3.1%(+7.89)#2,157 |
| 72. | Laurelville | 10.8% | 3.1%(+7.78)#72 | 3.1%(+7.78)#2,198 |
| 73. | Sardinia | 10.8% | 3.1%(+7.76)#73 | 3.1%(+7.75)#2,208 |
| 74. | New Riegel | 10.8% | 3.1%(+7.71)#74 | 3.1%(+7.70)#2,221 |
| 75. | Mcclure | 10.7% | 3.1%(+7.64)#75 | 3.1%(+7.63)#2,251 |
| 76. | Millville | 10.7% | 3.1%(+7.62)#76 | 3.1%(+7.61)#2,254 |
| 77. | Guilford Lake | 10.6% | 3.1%(+7.58)#77 | 3.1%(+7.57)#2,268 |
| 78. | Mowrystown | 10.6% | 3.1%(+7.49)#78 | 3.1%(+7.48)#2,305 |
| 79. | South Solon | 10.4% | 3.1%(+7.34)#79 | 3.1%(+7.34)#2,366 |
| 80. | Millfield | 10.4% | 3.1%(+7.32)#80 | 3.1%(+7.31)#2,377 |
| 81. | Grover Hill | 10.3% | 3.1%(+7.26)#81 | 3.1%(+7.25)#2,408 |
| 82. | Mineral City | 10.3% | 3.1%(+7.23)#82 | 3.1%(+7.22)#2,426 |
| 83. | West Farmington | 10.3% | 3.1%(+7.20)#83 | 3.1%(+7.19)#2,438 |
| 84. | Russellville | 10.2% | 3.1%(+7.19)#84 | 3.1%(+7.18)#2,448 |
| 85. | South Charleston | 10.2% | 3.1%(+7.13)#85 | 3.1%(+7.12)#2,472 |
| 86. | Sterling | 10.2% | 3.1%(+7.11)#86 | 3.1%(+7.10)#2,480 |
| 87. | Hopedale | 10.1% | 3.1%(+7.08)#87 | 3.1%(+7.07)#2,494 |
| 88. | Harrod | 10.0% | 3.1%(+6.98)#88 | 3.1%(+6.97)#2,531 |
| 89. | Zaleski | 10.0% | 3.1%(+6.94)#89 | 3.1%(+6.93)#2,549 |
| 90. | Lindsey | 10.0% | 3.1%(+6.94)#90 | 3.1%(+6.93)#2,550 |
| 91. | Woodsfield | 9.9% | 3.1%(+6.84)#91 | 3.1%(+6.83)#2,612 |
| 92. | North Lima | 9.9% | 3.1%(+6.83)#92 | 3.1%(+6.83)#2,614 |
| 93. | Bradner | 9.9% | 3.1%(+6.80)#93 | 3.1%(+6.80)#2,635 |
| 94. | New Vienna | 9.7% | 3.1%(+6.68)#94 | 3.1%(+6.67)#2,708 |
| 95. | New Lebanon | 9.7% | 3.1%(+6.62)#95 | 3.1%(+6.61)#2,740 |
| 96. | Atwater | 9.6% | 3.1%(+6.58)#96 | 3.1%(+6.58)#2,769 |
| 97. | Munroe Falls | 9.6% | 3.1%(+6.57)#97 | 3.1%(+6.56)#2,776 |
| 98. | Sawyerwood | 9.6% | 3.1%(+6.53)#98 | 3.1%(+6.52)#2,796 |
| 99. | Sycamore | 9.5% | 3.1%(+6.49)#99 | 3.1%(+6.48)#2,813 |
| 100. | Proctorville | 9.5% | 3.1%(+6.41)#100 | 3.1%(+6.41)#2,852 |
Common Questions
What are the Top 10 Cities with the Highest Percentage of Population Employed in Installation, Maintenance & Repair in Ohio?
Top 10 Cities with the Highest Percentage of Population Employed in Installation, Maintenance & Repair in Ohio are:
#1
51.2%
#2
39.5%
#3
36.6%
#4
32.5%
#5
30.2%
#6
29.0%
#7
27.8%
#8
25.4%
#9
24.6%
#10
22.9%
What city has the Highest Percentage of Population Employed in Installation, Maintenance & Repair in Ohio?
Hessville has the Highest Percentage of Population Employed in Installation, Maintenance & Repair in Ohio with 51.2%.
What is the Percentage of Population Employed in Installation, Maintenance & Repair in the State of Ohio?
Percentage of Population Employed in Installation, Maintenance & Repair in Ohio is 3.1%.
What is the Percentage of Population Employed in Installation, Maintenance & Repair in the United States?
Percentage of Population Employed in Installation, Maintenance & Repair in the United States is 3.1%.