Cities with the Highest Percentage of Central American Indian Population in California
RELATED REPORTS & OPTIONS
Central American Indian
California
Compare Cities
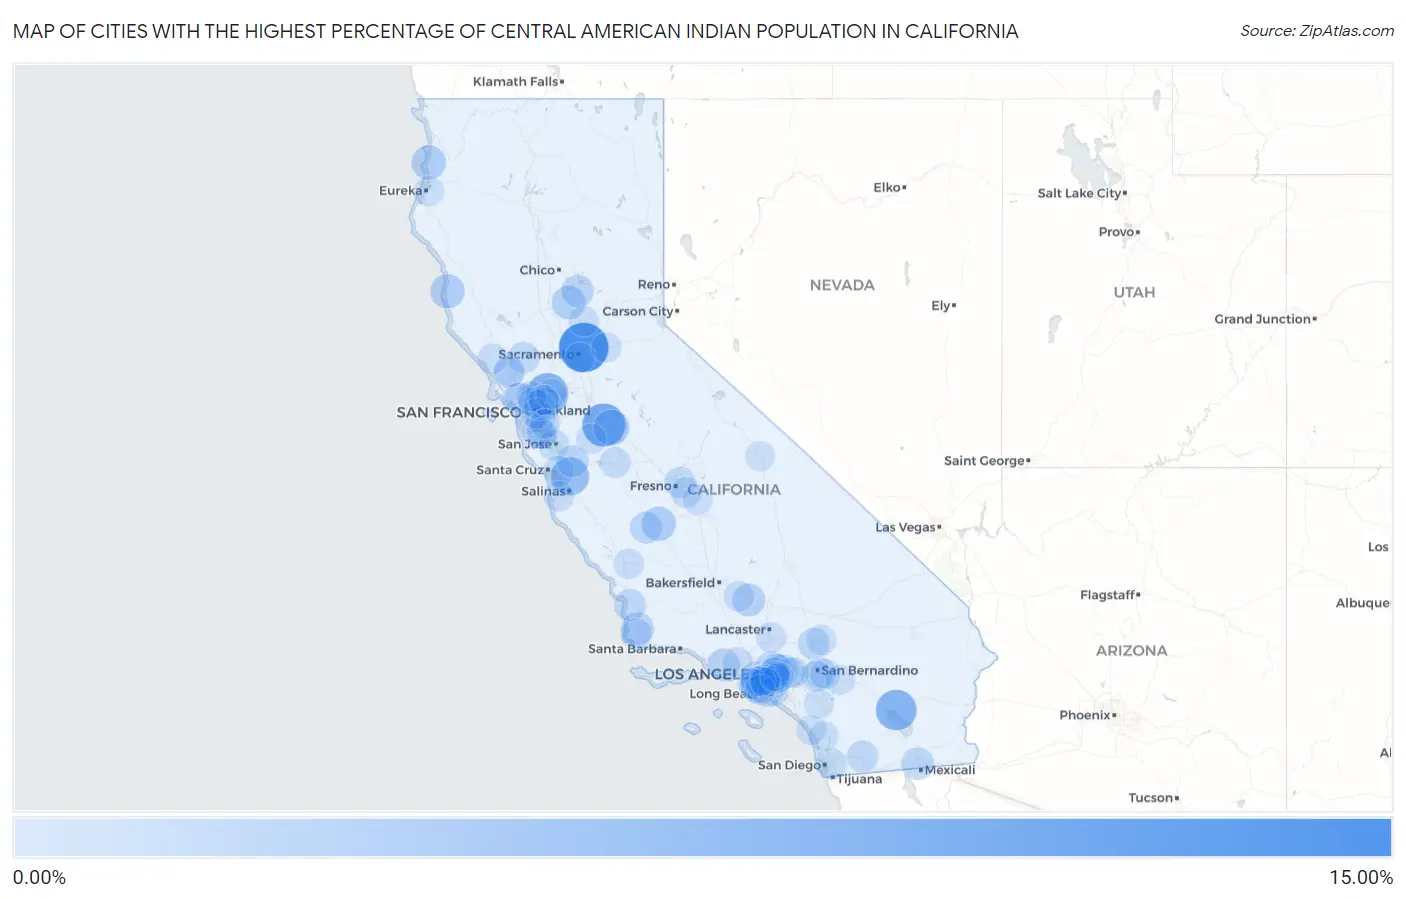
Map of Cities with the Highest Percentage of Central American Indian Population in California
0.00%
15.00%
Cities with the Highest Percentage of Central American Indian Population in California
| City | Central American Indian | vs State | vs National | |
| 1. | Mcclellan Park | 12.32% | 0.20%(+12.1)#1 | 0.11%(+12.2)#16 |
| 2. | Riverdale Park | 8.30% | 0.20%(+8.10)#2 | 0.11%(+8.19)#28 |
| 3. | Clyde | 7.21% | 0.20%(+7.01)#3 | 0.11%(+7.10)#34 |
| 4. | North Shore | 6.74% | 0.20%(+6.54)#4 | 0.11%(+6.63)#36 |
| 5. | Aromas | 5.21% | 0.20%(+5.01)#5 | 0.11%(+5.10)#49 |
| 6. | Keyes | 3.69% | 0.20%(+3.49)#6 | 0.11%(+3.58)#81 |
| 7. | Alondra Park | 3.48% | 0.20%(+3.28)#7 | 0.11%(+3.36)#85 |
| 8. | Big Lagoon | 2.88% | 0.20%(+2.68)#8 | 0.11%(+2.77)#102 |
| 9. | Fort Bragg | 2.88% | 0.20%(+2.68)#9 | 0.11%(+2.77)#103 |
| 10. | Huron | 2.83% | 0.20%(+2.63)#10 | 0.11%(+2.71)#109 |
| 11. | Live Oak | 2.55% | 0.20%(+2.35)#11 | 0.11%(+2.44)#124 |
| 12. | Bayview Cdp Contra Costa County | 2.45% | 0.20%(+2.25)#12 | 0.11%(+2.34)#128 |
| 13. | Tehachapi | 2.12% | 0.20%(+1.92)#13 | 0.11%(+2.01)#149 |
| 14. | Vandenberg Village | 2.03% | 0.20%(+1.83)#14 | 0.11%(+1.92)#160 |
| 15. | Casa Conejo | 2.03% | 0.20%(+1.83)#15 | 0.11%(+1.92)#161 |
| 16. | Heber | 1.86% | 0.20%(+1.66)#16 | 0.11%(+1.75)#177 |
| 17. | Johnson Park | 1.84% | 0.20%(+1.64)#17 | 0.11%(+1.73)#181 |
| 18. | Palermo | 1.78% | 0.20%(+1.58)#18 | 0.11%(+1.66)#192 |
| 19. | San Pasqual | 1.76% | 0.20%(+1.56)#19 | 0.11%(+1.65)#195 |
| 20. | Coalinga | 1.61% | 0.20%(+1.41)#20 | 0.11%(+1.49)#228 |
| 21. | San Martin | 1.54% | 0.20%(+1.34)#21 | 0.11%(+1.43)#241 |
| 22. | Callender | 1.51% | 0.20%(+1.31)#22 | 0.11%(+1.40)#249 |
| 23. | Saranap | 1.43% | 0.20%(+1.23)#23 | 0.11%(+1.32)#266 |
| 24. | Pine Valley | 1.41% | 0.20%(+1.21)#24 | 0.11%(+1.29)#269 |
| 25. | West Athens | 1.39% | 0.20%(+1.19)#25 | 0.11%(+1.28)#272 |
| 26. | Ladera Heights | 1.37% | 0.20%(+1.17)#26 | 0.11%(+1.26)#277 |
| 27. | Mountain View Acres | 1.36% | 0.20%(+1.16)#27 | 0.11%(+1.25)#278 |
| 28. | Ross | 1.34% | 0.20%(+1.14)#28 | 0.11%(+1.23)#286 |
| 29. | Signal Hill | 1.34% | 0.20%(+1.14)#29 | 0.11%(+1.22)#287 |
| 30. | West Rancho Dominguez | 1.21% | 0.20%(+1.01)#30 | 0.11%(+1.10)#319 |
| 31. | St Helena | 1.18% | 0.20%(+0.980)#31 | 0.11%(+1.07)#329 |
| 32. | Tarpey Village | 1.17% | 0.20%(+0.975)#32 | 0.11%(+1.06)#332 |
| 33. | Irwindale | 1.12% | 0.20%(+0.917)#33 | 0.11%(+1.00)#362 |
| 34. | Citrus | 1.07% | 0.20%(+0.866)#34 | 0.11%(+0.953)#381 |
| 35. | Commerce | 1.04% | 0.20%(+0.837)#35 | 0.11%(+0.923)#385 |
| 36. | Lemon Grove | 1.01% | 0.20%(+0.812)#36 | 0.11%(+0.899)#391 |
| 37. | South El Monte | 1.01% | 0.20%(+0.806)#37 | 0.11%(+0.892)#394 |
| 38. | Burbank | 0.99% | 0.20%(+0.794)#38 | 0.11%(+0.881)#400 |
| 39. | Santa Fe Springs | 0.99% | 0.20%(+0.787)#39 | 0.11%(+0.874)#402 |
| 40. | Loma Linda | 0.98% | 0.20%(+0.777)#40 | 0.11%(+0.864)#409 |
| 41. | Lompoc | 0.97% | 0.20%(+0.769)#41 | 0.11%(+0.856)#413 |
| 42. | Redwood City | 0.96% | 0.20%(+0.757)#42 | 0.11%(+0.844)#419 |
| 43. | Highgrove | 0.95% | 0.20%(+0.748)#43 | 0.11%(+0.835)#423 |
| 44. | Del Rey | 0.94% | 0.20%(+0.739)#44 | 0.11%(+0.826)#426 |
| 45. | Los Banos | 0.93% | 0.20%(+0.733)#45 | 0.11%(+0.820)#430 |
| 46. | East Palo Alto | 0.90% | 0.20%(+0.705)#46 | 0.11%(+0.791)#444 |
| 47. | Aptos Hills Larkin Valley | 0.86% | 0.20%(+0.659)#47 | 0.11%(+0.746)#461 |
| 48. | Rohnert Park | 0.80% | 0.20%(+0.596)#48 | 0.11%(+0.683)#494 |
| 49. | Bear Valley Springs | 0.77% | 0.20%(+0.568)#49 | 0.11%(+0.655)#511 |
| 50. | Cotati | 0.76% | 0.20%(+0.556)#50 | 0.11%(+0.642)#525 |
| 51. | South Gate | 0.74% | 0.20%(+0.538)#51 | 0.11%(+0.625)#530 |
| 52. | Brisbane | 0.74% | 0.20%(+0.536)#52 | 0.11%(+0.623)#532 |
| 53. | Montclair | 0.73% | 0.20%(+0.529)#53 | 0.11%(+0.616)#538 |
| 54. | Maywood | 0.70% | 0.20%(+0.496)#54 | 0.11%(+0.583)#560 |
| 55. | Apple Valley | 0.69% | 0.20%(+0.491)#55 | 0.11%(+0.577)#561 |
| 56. | Del Rey Oaks | 0.68% | 0.20%(+0.483)#56 | 0.11%(+0.570)#564 |
| 57. | Lawndale | 0.67% | 0.20%(+0.466)#57 | 0.11%(+0.553)#576 |
| 58. | Florence Graham | 0.65% | 0.20%(+0.453)#58 | 0.11%(+0.540)#587 |
| 59. | Diablo Grande | 0.64% | 0.20%(+0.437)#59 | 0.11%(+0.523)#600 |
| 60. | Bell Canyon | 0.62% | 0.20%(+0.422)#60 | 0.11%(+0.509)#620 |
| 61. | Wheatland | 0.62% | 0.20%(+0.421)#61 | 0.11%(+0.508)#622 |
| 62. | Mayflower Village | 0.60% | 0.20%(+0.395)#62 | 0.11%(+0.482)#640 |
| 63. | El Paso De Robles Paso Robles | 0.60% | 0.20%(+0.395)#63 | 0.11%(+0.482)#641 |
| 64. | Guerneville | 0.57% | 0.20%(+0.367)#64 | 0.11%(+0.454)#664 |
| 65. | Redlands | 0.57% | 0.20%(+0.365)#65 | 0.11%(+0.452)#668 |
| 66. | San Leandro | 0.55% | 0.20%(+0.354)#66 | 0.11%(+0.441)#676 |
| 67. | San Rafael | 0.55% | 0.20%(+0.352)#67 | 0.11%(+0.439)#678 |
| 68. | El Monte | 0.55% | 0.20%(+0.349)#68 | 0.11%(+0.436)#682 |
| 69. | Palmdale | 0.54% | 0.20%(+0.341)#69 | 0.11%(+0.428)#693 |
| 70. | San Marcos | 0.53% | 0.20%(+0.333)#70 | 0.11%(+0.420)#703 |
| 71. | Menlo Park | 0.53% | 0.20%(+0.328)#71 | 0.11%(+0.415)#708 |
| 72. | Downey | 0.51% | 0.20%(+0.315)#72 | 0.11%(+0.402)#723 |
| 73. | Kensington | 0.51% | 0.20%(+0.309)#73 | 0.11%(+0.396)#729 |
| 74. | Oakland | 0.50% | 0.20%(+0.301)#74 | 0.11%(+0.388)#735 |
| 75. | Fruitridge Pocket | 0.50% | 0.20%(+0.301)#75 | 0.11%(+0.387)#739 |
| 76. | Lennox | 0.50% | 0.20%(+0.298)#76 | 0.11%(+0.385)#741 |
| 77. | Los Alamitos | 0.49% | 0.20%(+0.295)#77 | 0.11%(+0.382)#747 |
| 78. | Walnut Park | 0.49% | 0.20%(+0.288)#78 | 0.11%(+0.374)#754 |
| 79. | Myrtletown | 0.49% | 0.20%(+0.285)#79 | 0.11%(+0.372)#756 |
| 80. | Pomona | 0.48% | 0.20%(+0.285)#80 | 0.11%(+0.372)#757 |
| 81. | El Segundo | 0.48% | 0.20%(+0.280)#81 | 0.11%(+0.367)#763 |
| 82. | Whittier | 0.47% | 0.20%(+0.274)#82 | 0.11%(+0.361)#771 |
| 83. | Cameron Park | 0.47% | 0.20%(+0.272)#83 | 0.11%(+0.359)#775 |
| 84. | Banning | 0.47% | 0.20%(+0.268)#84 | 0.11%(+0.355)#782 |
| 85. | West Carson | 0.47% | 0.20%(+0.268)#85 | 0.11%(+0.355)#783 |
| 86. | Wildomar | 0.46% | 0.20%(+0.265)#86 | 0.11%(+0.351)#791 |
| 87. | Orinda | 0.46% | 0.20%(+0.257)#87 | 0.11%(+0.344)#807 |
| 88. | Hacienda Heights | 0.46% | 0.20%(+0.256)#88 | 0.11%(+0.343)#810 |
| 89. | East Bakersfield | 0.46% | 0.20%(+0.256)#89 | 0.11%(+0.343)#811 |
| 90. | Montalvin Manor | 0.46% | 0.20%(+0.256)#90 | 0.11%(+0.343)#812 |
| 91. | Big Pine | 0.45% | 0.20%(+0.248)#91 | 0.11%(+0.335)#827 |
| 92. | Westmont | 0.45% | 0.20%(+0.247)#92 | 0.11%(+0.334)#830 |
| 93. | Bay Point | 0.45% | 0.20%(+0.247)#93 | 0.11%(+0.334)#831 |
| 94. | El Sobrante Cdp Riverside County | 0.45% | 0.20%(+0.245)#94 | 0.11%(+0.332)#832 |
| 95. | Dinuba | 0.45% | 0.20%(+0.245)#95 | 0.11%(+0.332)#833 |
| 96. | Rose Hills | 0.44% | 0.20%(+0.242)#96 | 0.11%(+0.328)#837 |
| 97. | Reliez Valley | 0.44% | 0.20%(+0.239)#97 | 0.11%(+0.326)#844 |
| 98. | Hayward | 0.44% | 0.20%(+0.238)#98 | 0.11%(+0.325)#846 |
| 99. | Lynwood | 0.44% | 0.20%(+0.237)#99 | 0.11%(+0.324)#848 |
| 100. | Camp Pendleton South | 0.43% | 0.20%(+0.231)#100 | 0.11%(+0.318)#855 |
Common Questions
What are the Top 10 Cities with the Highest Percentage of Central American Indian Population in California?
Top 10 Cities with the Highest Percentage of Central American Indian Population in California are:
#1
12.32%
#2
8.30%
#3
7.21%
#4
6.74%
#5
5.21%
#6
3.69%
#7
3.48%
#8
2.88%
#9
2.88%
#10
2.83%
What city has the Highest Percentage of Central American Indian Population in California?
McClellan Park has the Highest Percentage of Central American Indian Population in California with 12.32%.
What is the Percentage of Central American Indian Population in the State of California?
Percentage of Central American Indian Population in California is 0.20%.
What is the Percentage of Central American Indian Population in the United States?
Percentage of Central American Indian Population in the United States is 0.11%.