Rhode Island Map & Demographics
Rhode Island Map
Rhode Island Overview
May 29, 1790
INCORPORATED
1,545
TOTAL AREA [ SQ MI ]
1,034
LAND AREA [ SQ MI ]
511
WATER AREA [ SQ MI ]
200
ELEVATION AVG [ FT ]
812
ELEVATION HIGH [ FT ]
Sea Level
ELEVATION LOW [ FT ]
1,058.3
POP DENSITY [ PPL / SQ MI ]
$43,324
PER CAPITA INCOME
$104,033
AVG FAMILY INCOME
$81,370
AVG HOUSEHOLD INCOME
26.1%
WAGE / INCOME GAP [ % ]
73.9¢/ $1
WAGE / INCOME GAP [ $ ]
$10,868
FAMILY INCOME DEFICIT
0.46
INEQUALITY / GINI INDEX
02860
LARGEST ZIP CODE
Providence
LARGEST CITY
Providence County
LARGEST COUNTY
1,094,250
TOTAL POPULATION
537,221
MALE POPULATION
557,029
FEMALE POPULATION
96.44
MALES / 100 FEMALES
103.69
FEMALES / 100 MALES
40.1
MEDIAN AGE
3.0
AVG FAMILY SIZE
2.4
AVG HOUSEHOLD SIZE
592,223
LABOR FORCE [ PEOPLE ]
64.9%
PERCENT IN LABOR FORCE
5.9%
UNEMPLOYMENT RATE
Rhode Island Area Codes
Income in Rhode Island
Income Overview in Rhode Island
Per Capita Income in Rhode Island is $43,324, while median incomes of families and households are $104,033 and $81,370 respectively.
| Characteristic | Number | Measure |
| Per Capita Income | 1,094,250 | $43,324 |
| Median Family Income | 265,601 | $104,033 |
| Mean Family Income | 265,601 | $129,686 |
| Median Household Income | 432,219 | $81,370 |
| Mean Household Income | 432,219 | $106,511 |
| Income Deficit | 265,601 | $10,868 |
| Wage / Income Gap (%) | 1,094,250 | 26.11% |
| Wage / Income Gap ($) | 1,094,250 | 73.89¢ per $1 |
| Gini / Inequality Index | 1,094,250 | 0.46 |
Earnings by Sex in Rhode Island
Average Earnings in Rhode Island are $45,347, $52,663 for men and $38,912 for women, a difference of 26.1%.
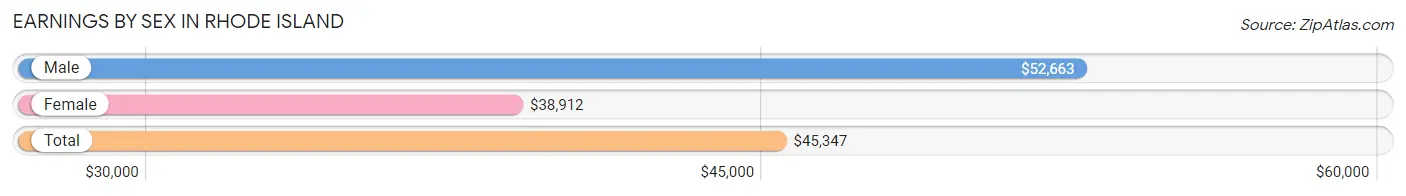
| Sex | Number | Average Earnings |
| Male | 318,079 (51.3%) | $52,663 |
| Female | 301,329 (48.6%) | $38,912 |
| Total | 619,408 (100.0%) | $45,347 |
Earnings by Sex by Income Bracket in Rhode Island
The most common earnings brackets in Rhode Island are $100,000+ for men (61,558 | 19.4%) and $75,000 to $99,999 for women (31,133 | 10.3%).
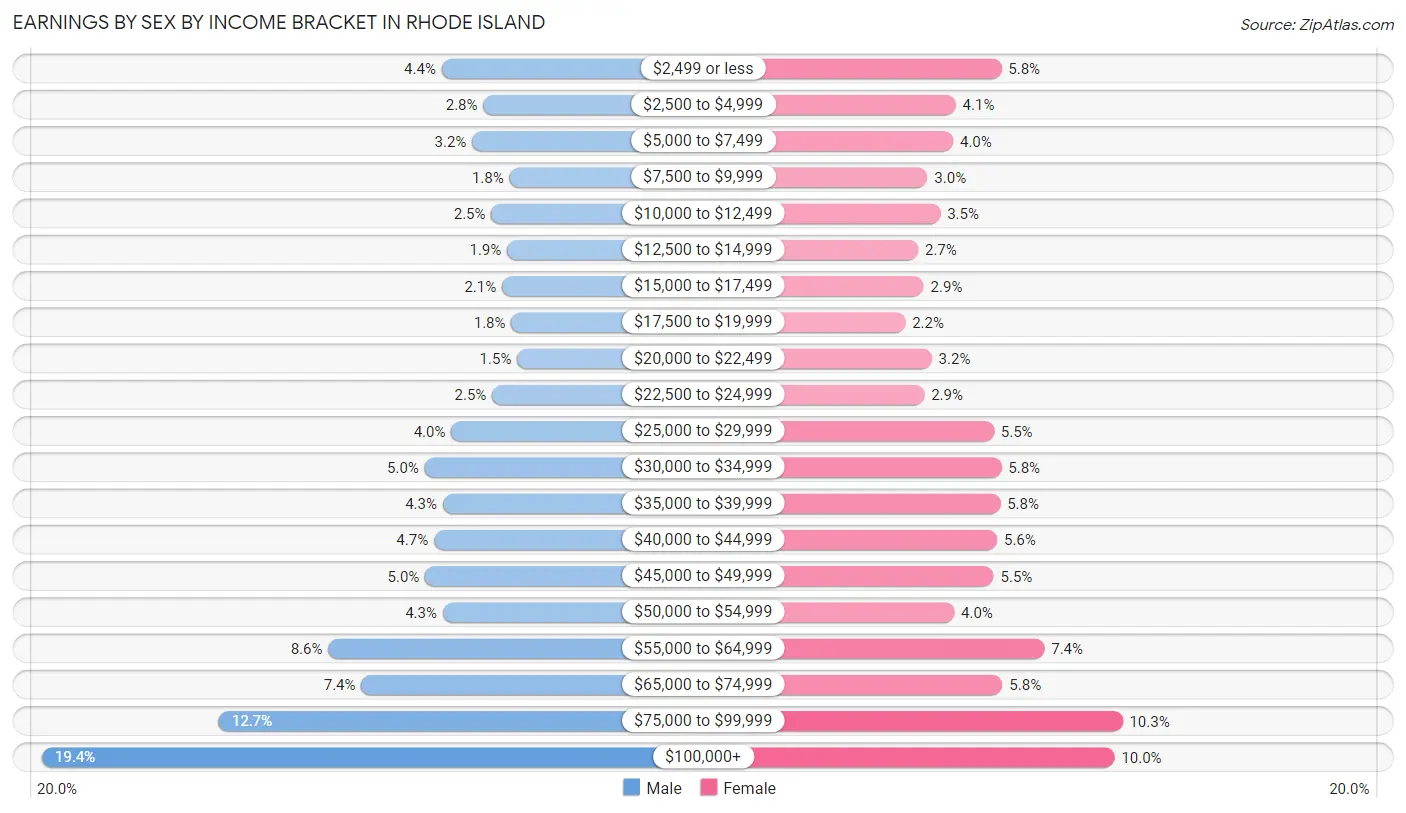
| Income | Male | Female |
| $2,499 or less | 13,912 (4.4%) | 17,461 (5.8%) |
| $2,500 to $4,999 | 8,944 (2.8%) | 12,309 (4.1%) |
| $5,000 to $7,499 | 10,286 (3.2%) | 11,982 (4.0%) |
| $7,500 to $9,999 | 5,827 (1.8%) | 9,113 (3.0%) |
| $10,000 to $12,499 | 7,995 (2.5%) | 10,543 (3.5%) |
| $12,500 to $14,999 | 6,111 (1.9%) | 8,060 (2.7%) |
| $15,000 to $17,499 | 6,709 (2.1%) | 8,689 (2.9%) |
| $17,500 to $19,999 | 5,596 (1.8%) | 6,605 (2.2%) |
| $20,000 to $22,499 | 4,910 (1.5%) | 9,574 (3.2%) |
| $22,500 to $24,999 | 7,879 (2.5%) | 8,745 (2.9%) |
| $25,000 to $29,999 | 12,762 (4.0%) | 16,601 (5.5%) |
| $30,000 to $34,999 | 15,950 (5.0%) | 17,432 (5.8%) |
| $35,000 to $39,999 | 13,774 (4.3%) | 17,328 (5.8%) |
| $40,000 to $44,999 | 14,830 (4.7%) | 16,961 (5.6%) |
| $45,000 to $49,999 | 15,882 (5.0%) | 16,586 (5.5%) |
| $50,000 to $54,999 | 13,784 (4.3%) | 12,121 (4.0%) |
| $55,000 to $64,999 | 27,419 (8.6%) | 22,285 (7.4%) |
| $65,000 to $74,999 | 23,476 (7.4%) | 17,575 (5.8%) |
| $75,000 to $99,999 | 40,475 (12.7%) | 31,133 (10.3%) |
| $100,000+ | 61,558 (19.4%) | 30,226 (10.0%) |
| Total | 318,079 (100.0%) | 301,329 (100.0%) |
Earnings by Sex by Educational Attainment in Rhode Island
Average earnings in Rhode Island are $59,927 for men and $45,667 for women, a difference of 23.8%. Men with an educational attainment of graduate degree enjoy the highest average annual earnings of $99,362, while those with less than high school education earn the least with $40,825. Women with an educational attainment of graduate degree earn the most with the average annual earnings of $78,806, while those with less than high school education have the smallest earnings of $28,259.
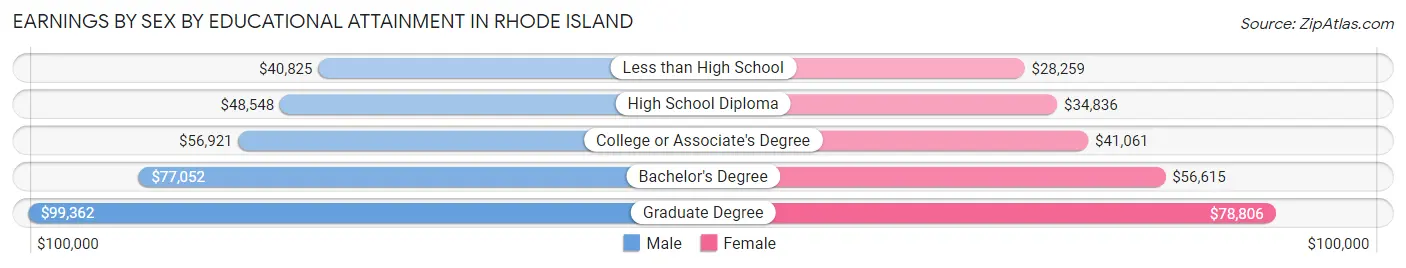
| Educational Attainment | Male Income | Female Income |
| Less than High School | $40,825 | $28,259 |
| High School Diploma | $48,548 | $34,836 |
| College or Associate's Degree | $56,921 | $41,061 |
| Bachelor's Degree | $77,052 | $56,615 |
| Graduate Degree | $99,362 | $78,806 |
| Total | $59,927 | $45,667 |
Family Income in Rhode Island
Family Income Brackets in Rhode Island
According to the Rhode Island family income data, there are 61,885 families falling into the $100,000 to $149,999 income range, which is the most common income bracket and makes up 23.3% of all families. Conversely, the $10,000 to $14,999 income bracket is the least frequent group with only 4,781 families (1.8%) belonging to this category.
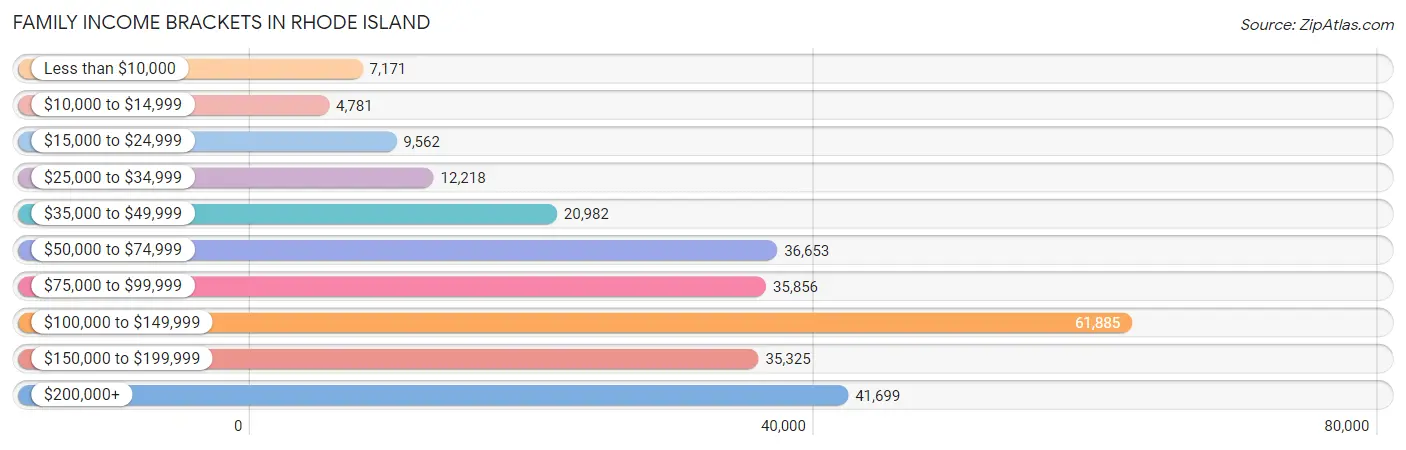
| Income Bracket | # Families | % Families |
| Less than $10,000 | 7,171 | 2.7% |
| $10,000 to $14,999 | 4,781 | 1.8% |
| $15,000 to $24,999 | 9,562 | 3.6% |
| $25,000 to $34,999 | 12,218 | 4.6% |
| $35,000 to $49,999 | 20,982 | 7.9% |
| $50,000 to $74,999 | 36,653 | 13.8% |
| $75,000 to $99,999 | 35,856 | 13.5% |
| $100,000 to $149,999 | 61,885 | 23.3% |
| $150,000 to $199,999 | 35,325 | 13.3% |
| $200,000+ | 41,699 | 15.7% |
Family Income by Famaliy Size in Rhode Island
7+ person families (2,487 | 0.9%) account for the highest median family income in Rhode Island with $137,052 per family, while 2-person families (127,292 | 47.9%) have the highest median income of $45,378 per family member.
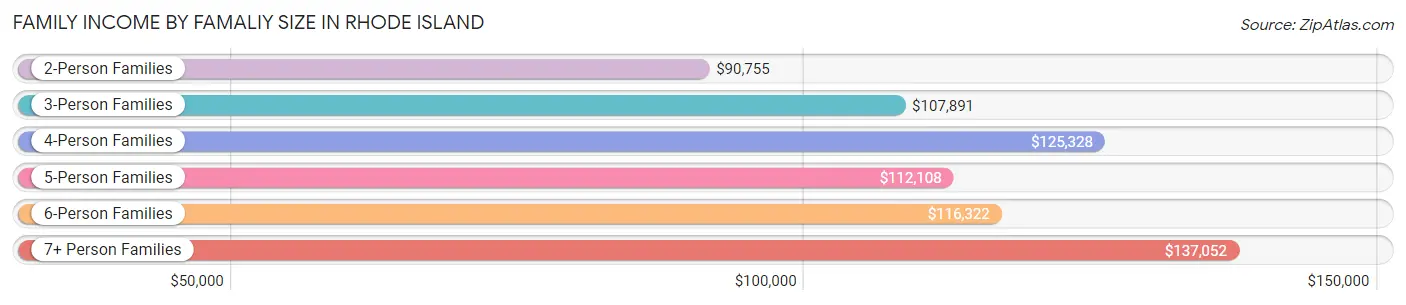
| Income Bracket | # Families | Median Income |
| 2-Person Families | 127,292 (47.9%) | $90,755 |
| 3-Person Families | 61,975 (23.3%) | $107,891 |
| 4-Person Families | 49,672 (18.7%) | $125,328 |
| 5-Person Families | 18,906 (7.1%) | $112,108 |
| 6-Person Families | 5,269 (2.0%) | $116,322 |
| 7+ Person Families | 2,487 (0.9%) | $137,052 |
| Total | 265,601 (100.0%) | $104,033 |
Family Income by Number of Earners in Rhode Island
The median family income in Rhode Island is $104,033, with families comprising 3+ earners (36,108) having the highest median family income of $160,600, while families with no earners (35,832) have the lowest median family income of $49,957, accounting for 13.6% and 13.5% of families, respectively.
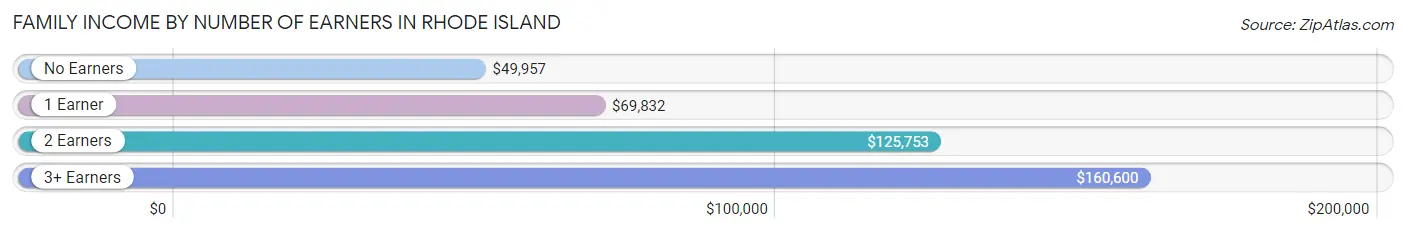
| Number of Earners | # Families | Median Income |
| No Earners | 35,832 (13.5%) | $49,957 |
| 1 Earner | 80,933 (30.5%) | $69,832 |
| 2 Earners | 112,728 (42.4%) | $125,753 |
| 3+ Earners | 36,108 (13.6%) | $160,600 |
| Total | 265,601 (100.0%) | $104,033 |
Household Income in Rhode Island
Household Income Brackets in Rhode Island
With 82,986 households falling in the category, the $100,000 to $149,999 income range is the most frequent in Rhode Island, accounting for 19.2% of all households. In contrast, only 19,882 households (4.6%) fall into the less than $10,000 income bracket, making it the least populous group.
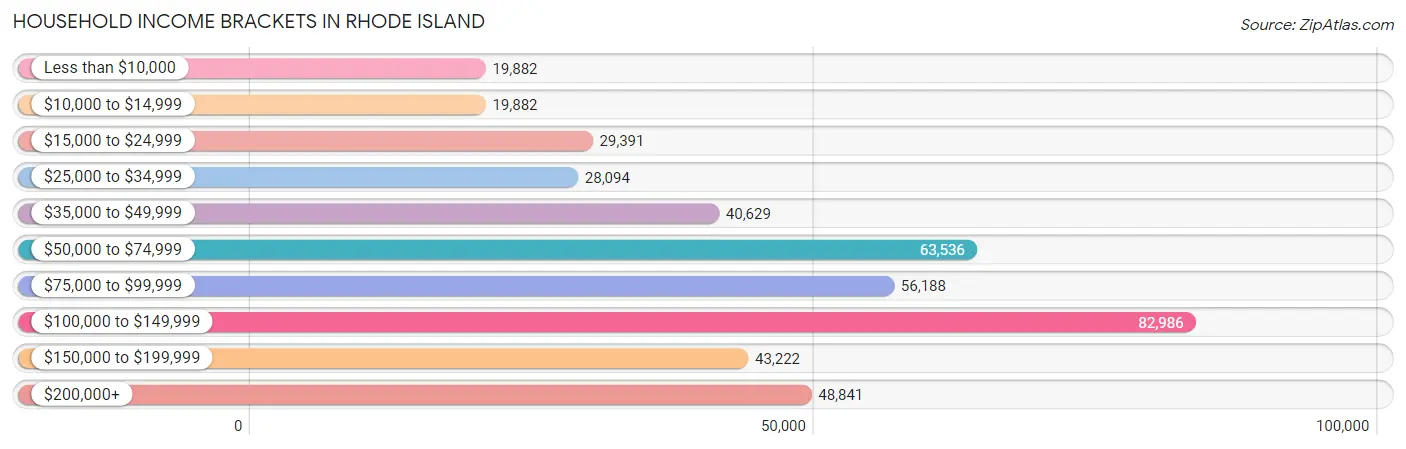
| Income Bracket | # Households | % Households |
| Less than $10,000 | 19,882 | 4.6% |
| $10,000 to $14,999 | 19,882 | 4.6% |
| $15,000 to $24,999 | 29,391 | 6.8% |
| $25,000 to $34,999 | 28,094 | 6.5% |
| $35,000 to $49,999 | 40,629 | 9.4% |
| $50,000 to $74,999 | 63,536 | 14.7% |
| $75,000 to $99,999 | 56,188 | 13.0% |
| $100,000 to $149,999 | 82,986 | 19.2% |
| $150,000 to $199,999 | 43,222 | 10.0% |
| $200,000+ | 48,841 | 11.3% |
Household Income by Householder Age in Rhode Island
The median household income in Rhode Island is $81,370, with the highest median household income of $100,530 found in the 45 to 64 years age bracket for the primary householder. A total of 167,582 households (38.8%) fall into this category. Meanwhile, the 15 to 24 years age bracket for the primary householder has the lowest median household income of $43,688, with 10,762 households (2.5%) in this group.
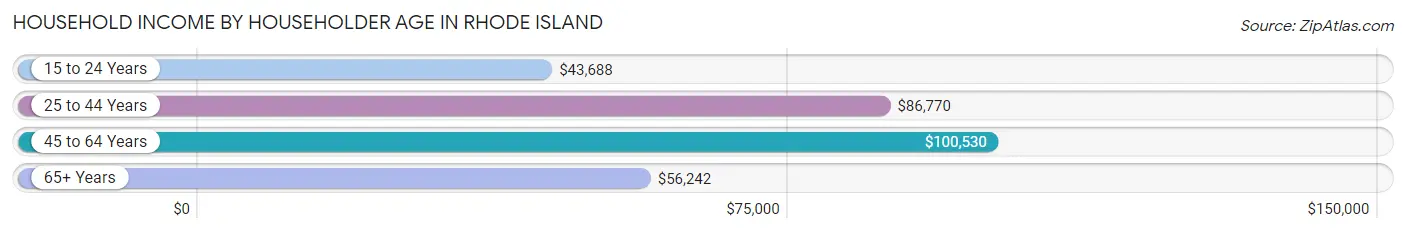
| Income Bracket | # Households | Median Income |
| 15 to 24 Years | 10,762 (2.5%) | $43,688 |
| 25 to 44 Years | 133,140 (30.8%) | $86,770 |
| 45 to 64 Years | 167,582 (38.8%) | $100,530 |
| 65+ Years | 120,735 (27.9%) | $56,242 |
| Total | 432,219 (100.0%) | $81,370 |
Poverty in Rhode Island
Income Below Poverty by Sex and Age in Rhode Island
With 10.1% poverty level for males and 12.3% for females among the residents of Rhode Island, under 5 year old males and 18 to 24 year old females are the most vulnerable to poverty, with 4,087 males (15.0%) and 8,586 females (19.6%) in their respective age groups living below the poverty level.
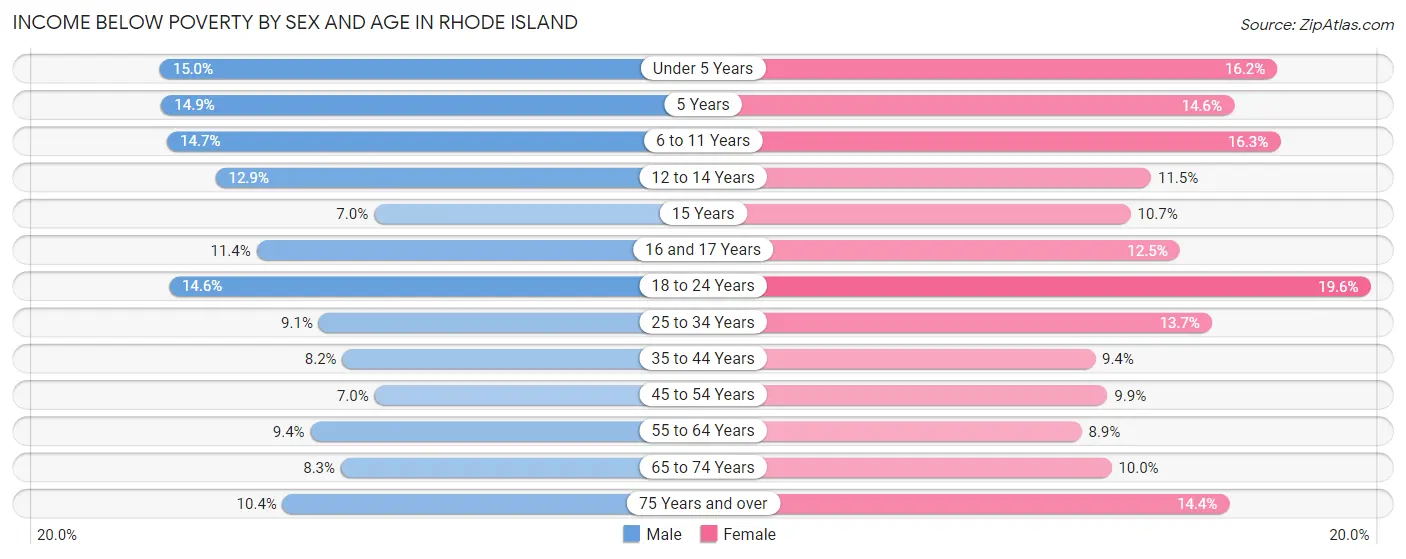
| Age Bracket | Male | Female |
| Under 5 Years | 4,087 (15.0%) | 4,205 (16.2%) |
| 5 Years | 799 (14.9%) | 843 (14.5%) |
| 6 to 11 Years | 5,055 (14.7%) | 5,233 (16.3%) |
| 12 to 14 Years | 2,403 (12.9%) | 1,994 (11.5%) |
| 15 Years | 410 (7.0%) | 607 (10.7%) |
| 16 and 17 Years | 1,567 (11.4%) | 1,571 (12.5%) |
| 18 to 24 Years | 6,514 (14.6%) | 8,586 (19.6%) |
| 25 to 34 Years | 6,953 (9.1%) | 10,105 (13.7%) |
| 35 to 44 Years | 5,450 (8.2%) | 6,161 (9.4%) |
| 45 to 54 Years | 4,731 (7.0%) | 6,795 (9.9%) |
| 55 to 64 Years | 6,935 (9.4%) | 6,995 (8.9%) |
| 65 to 74 Years | 4,330 (8.3%) | 5,863 (10.0%) |
| 75 Years and over | 3,154 (10.4%) | 6,687 (14.4%) |
| Total | 52,388 (10.1%) | 65,645 (12.3%) |
Income Above Poverty by Sex and Age in Rhode Island
According to the poverty statistics in Rhode Island, males aged 45 to 54 years and females aged 55 to 64 years are the age groups that are most secure financially, with 93.0% of males and 91.1% of females in these age groups living above the poverty line.
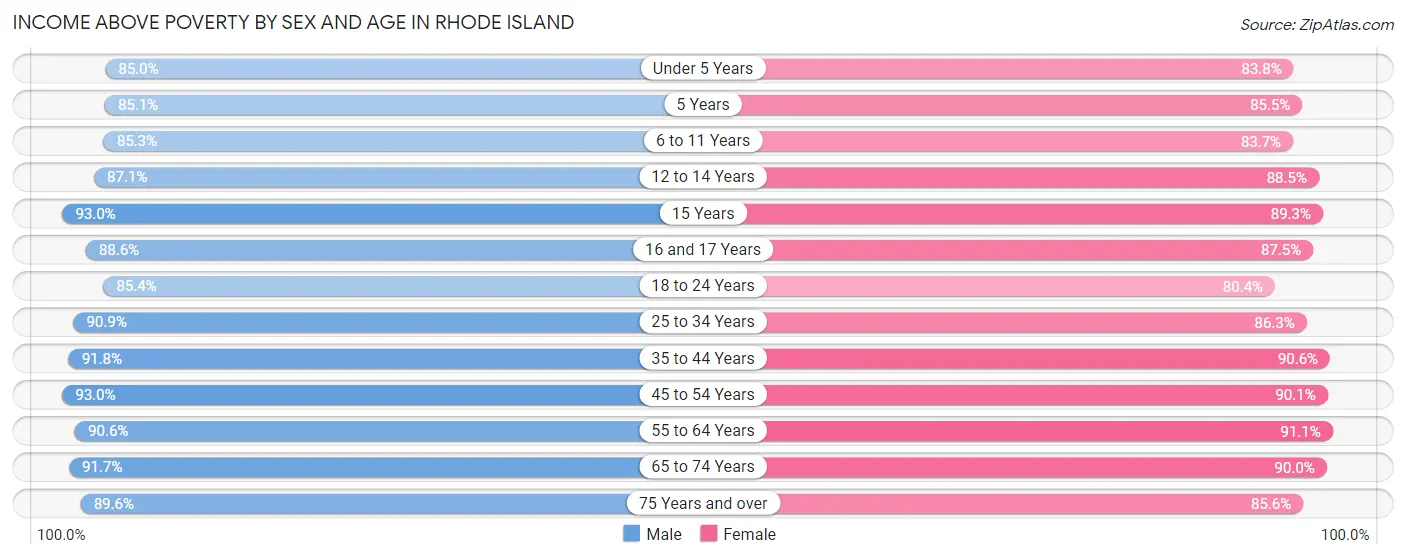
| Age Bracket | Male | Female |
| Under 5 Years | 23,205 (85.0%) | 21,809 (83.8%) |
| 5 Years | 4,557 (85.1%) | 4,950 (85.5%) |
| 6 to 11 Years | 29,300 (85.3%) | 26,928 (83.7%) |
| 12 to 14 Years | 16,215 (87.1%) | 15,376 (88.5%) |
| 15 Years | 5,424 (93.0%) | 5,055 (89.3%) |
| 16 and 17 Years | 12,191 (88.6%) | 10,952 (87.5%) |
| 18 to 24 Years | 37,975 (85.4%) | 35,174 (80.4%) |
| 25 to 34 Years | 69,631 (90.9%) | 63,505 (86.3%) |
| 35 to 44 Years | 61,043 (91.8%) | 59,356 (90.6%) |
| 45 to 54 Years | 62,726 (93.0%) | 62,103 (90.1%) |
| 55 to 64 Years | 66,946 (90.6%) | 71,643 (91.1%) |
| 65 to 74 Years | 48,063 (91.7%) | 52,700 (90.0%) |
| 75 Years and over | 27,112 (89.6%) | 39,817 (85.6%) |
| Total | 464,388 (89.9%) | 469,368 (87.7%) |
Income Below Poverty Among Married-Couple Families in Rhode Island
The poverty statistics for married-couple families in Rhode Island show that 3.3% or 6,147 of the total 188,597 families live below the poverty line. Families with 5 or more children have the highest poverty rate of 11.7%, comprising of 48 families. On the other hand, families with no children have the lowest poverty rate of 2.8%, which includes 3,295 families.
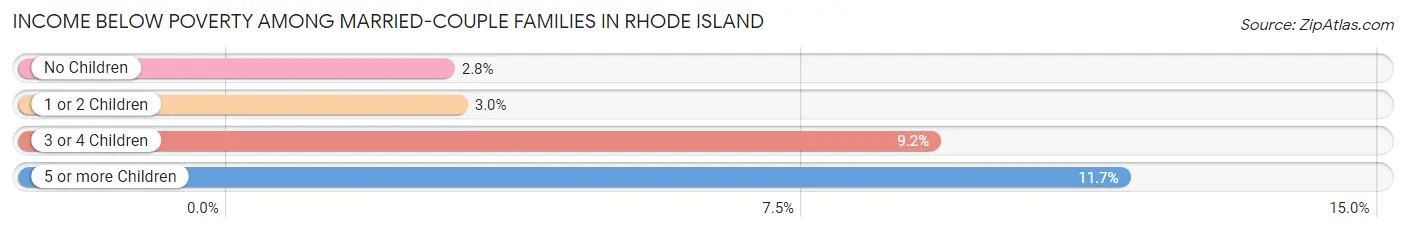
| Children | Above Poverty | Below Poverty |
| No Children | 113,031 (97.2%) | 3,295 (2.8%) |
| 1 or 2 Children | 59,503 (97.0%) | 1,839 (3.0%) |
| 3 or 4 Children | 9,552 (90.8%) | 965 (9.2%) |
| 5 or more Children | 364 (88.3%) | 48 (11.7%) |
| Total | 182,450 (96.7%) | 6,147 (3.3%) |
Income Below Poverty Among Single-Parent Households in Rhode Island
According to the poverty data in Rhode Island, 12.1% or 2,716 single-father households and 18.9% or 10,333 single-mother households are living below the poverty line. Among single-father households, those with 3 or 4 children have the highest poverty rate, with 601 households (36.9%) experiencing poverty. Likewise, among single-mother households, those with 5 or more children have the highest poverty rate, with 102 households (57.0%) falling below the poverty line.
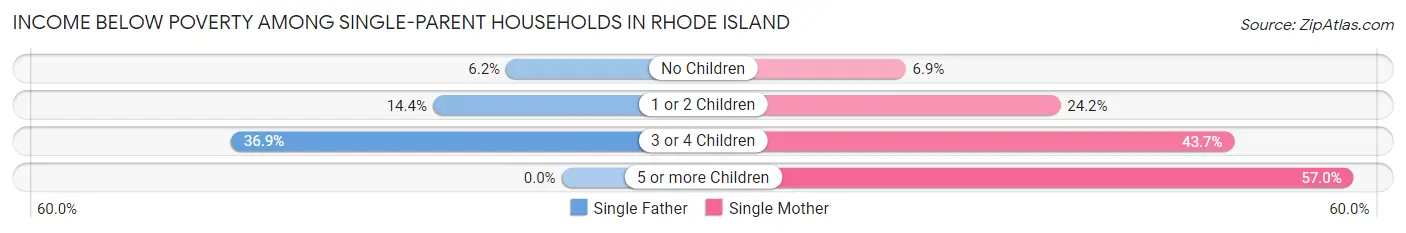
| Children | Single Father | Single Mother |
| No Children | 658 (6.2%) | 1,550 (6.9%) |
| 1 or 2 Children | 1,457 (14.4%) | 6,626 (24.2%) |
| 3 or 4 Children | 601 (36.9%) | 2,055 (43.6%) |
| 5 or more Children | 0 (0.0%) | 102 (57.0%) |
| Total | 2,716 (12.1%) | 10,333 (18.9%) |
Income Below Poverty Among Married-Couple vs Single-Parent Households in Rhode Island
The poverty data for Rhode Island shows that 6,147 of the married-couple family households (3.3%) and 13,049 of the single-parent households (17.0%) are living below the poverty level. Within the married-couple family households, those with 5 or more children have the highest poverty rate, with 48 households (11.7%) falling below the poverty line. Among the single-parent households, those with 5 or more children have the highest poverty rate, with 102 household (57.0%) living below poverty.
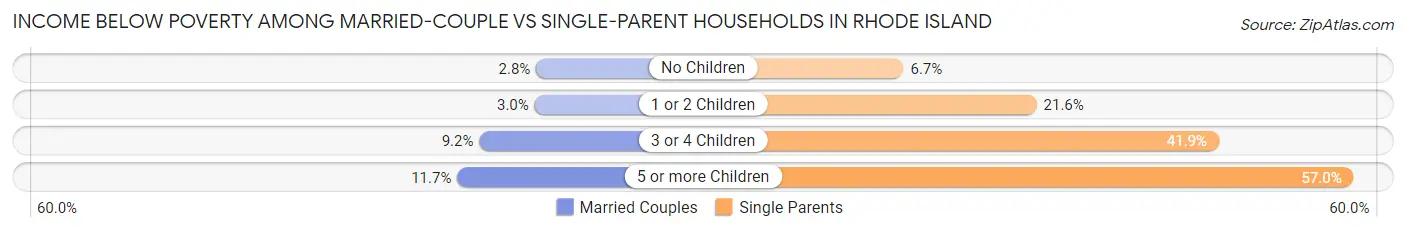
| Children | Married-Couple Families | Single-Parent Households |
| No Children | 3,295 (2.8%) | 2,208 (6.7%) |
| 1 or 2 Children | 1,839 (3.0%) | 8,083 (21.6%) |
| 3 or 4 Children | 965 (9.2%) | 2,656 (41.9%) |
| 5 or more Children | 48 (11.7%) | 102 (57.0%) |
| Total | 6,147 (3.3%) | 13,049 (17.0%) |
Largest Zip Codes by Population in Rhode Island
The largest zip codes in Rhode Island by population are 02860 (47,677), 02895 (43,163), 02909 (42,629), 02908 (39,099), and 02920 (36,907).
1.02860
47,677 (4.36%)
2.02895
43,163 (3.94%)
3.02909
42,629 (3.90%)
4.02908
39,099 (3.57%)
5.02920
36,907 (3.37%)
6.02864
36,142 (3.30%)
7.02816
33,148 (3.03%)
8.02907
32,697 (2.99%)
9.02904
31,214 (2.85%)
10.02893
30,909 (2.82%)
11.02886
30,540 (2.79%)
12.02919
29,453 (2.69%)
13.02889
28,209 (2.58%)
14.02861
27,527 (2.52%)
15.02906
26,437 (2.42%)
16.02905
25,674 (2.35%)
17.02840
23,847 (2.18%)
18.02910
23,598 (2.16%)
19.02852
23,382 (2.14%)
20.02809
22,420 (2.05%)
21.02879
22,369 (2.04%)
22.02863
22,359 (2.04%)
23.02891
22,026 (2.01%)
24.02914
21,742 (1.99%)
25.02818
19,876 (1.82%)
26.02888
18,443 (1.69%)
27.02865
18,306 (1.67%)
28.02871
17,748 (1.62%)
29.02806
17,121 (1.56%)
30.02842
17,009 (1.55%)
Largest Cities by Population in Rhode Island
The largest cities in Rhode Island by population are Providence (189,715), Warwick (82,783), Cranston (82,691), Pawtucket (75,176), and East Providence (47,012).
189,715 (17.34%)
2.Warwick
82,783 (7.57%)
3.Cranston
82,691 (7.56%)
75,176 (6.87%)
47,012 (4.30%)
43,029 (3.93%)
7.Newport
25,087 (2.29%)
22,359 (2.04%)
9.Westerly
18,272 (1.67%)
10.Valley Falls
12,072 (1.10%)
11.Newport East
11,644 (1.06%)
9,966 (0.91%)
8,866 (0.81%)
14.Greenville
8,777 (0.80%)
15.Tiverton
8,101 (0.74%)
16.Kingston
6,560 (0.60%)
17.Pascoag
4,527 (0.41%)
2,805 (0.26%)
19.Hope Valley
2,209 (0.20%)
20.Melville
1,918 (0.18%)
21.Chepachet
1,755 (0.16%)
22.Charlestown
1,702 (0.16%)
23.Ashaway
1,662 (0.15%)
24.Harrisville
1,515 (0.14%)
25.Harmony
1,442 (0.13%)
26.Bradford
1,189 (0.11%)
27.Carolina
1,165 (0.11%)
28.Greene
1,070 (0.10%)
29.Weekapaug
522 (0.05%)
452 (0.04%)
Largest Counties by Population in Rhode Island
The largest counties in Rhode Island by population are Providence County (657,984), Kent County (170,168), Washington County (129,998), Newport County (85,442), and Bristol County (50,658).
Race in Rhode Island
The most populous races in Rhode Island are White / Caucasian (816,308 | 74.6%), Hispanic or Latino (183,196 | 16.7%), and Two or more Races (91,944 | 8.4%).
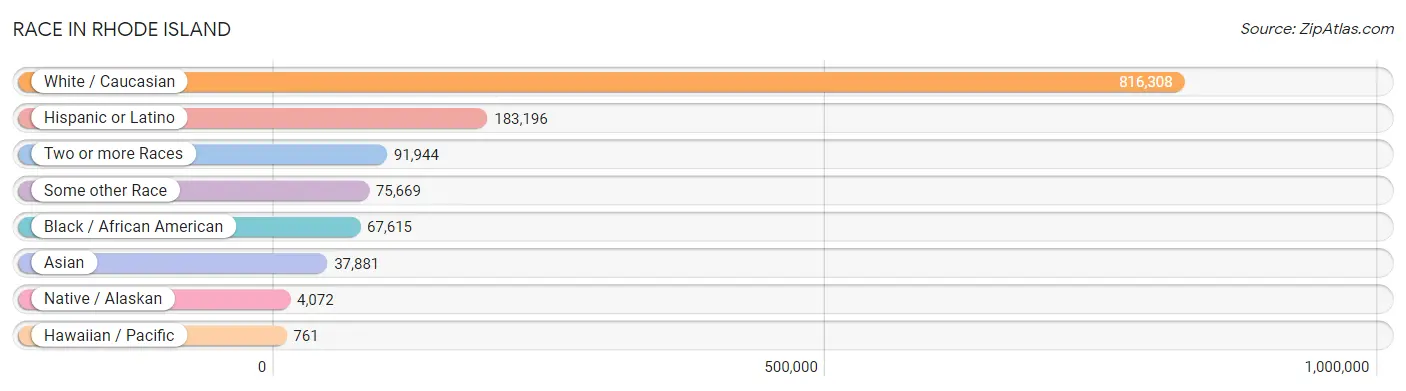
| Race | # Population | % Population |
| Asian | 37,881 | 3.5% |
| Black / African American | 67,615 | 6.2% |
| Hawaiian / Pacific | 761 | 0.1% |
| Hispanic or Latino | 183,196 | 16.7% |
| Native / Alaskan | 4,072 | 0.4% |
| White / Caucasian | 816,308 | 74.6% |
| Two or more Races | 91,944 | 8.4% |
| Some other Race | 75,669 | 6.9% |
| Total | 1,094,250 | 100.0% |
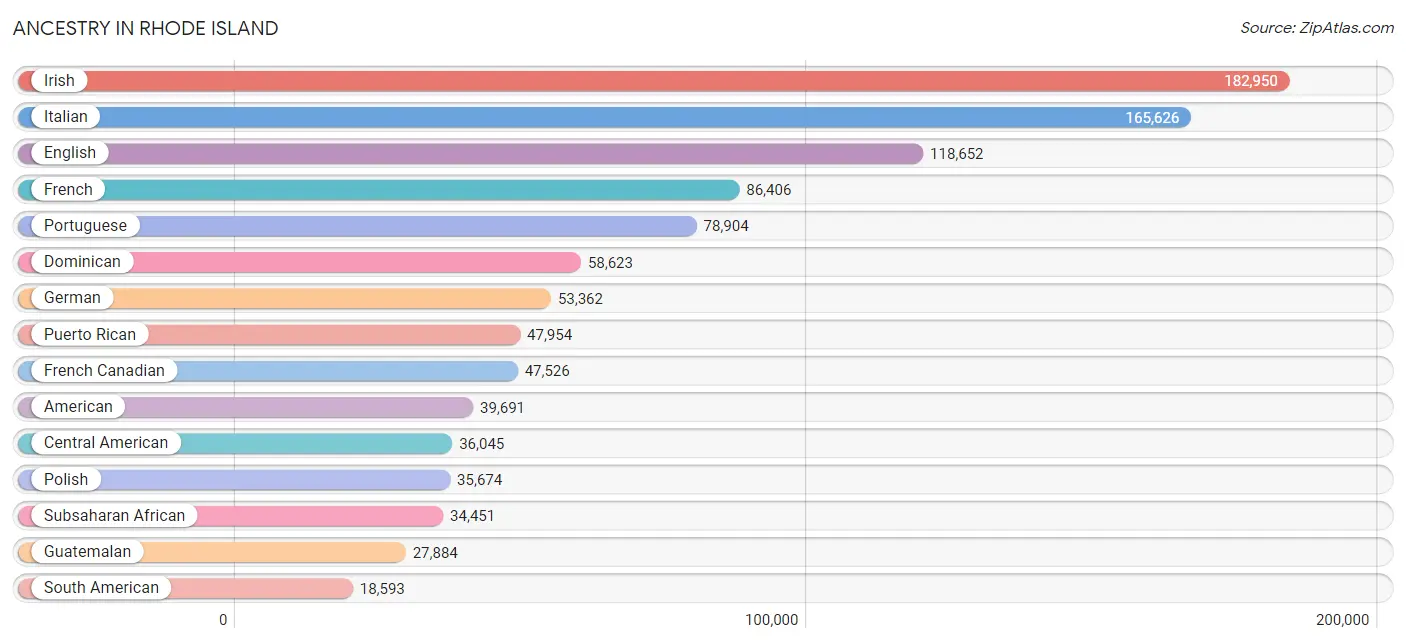
Ancestry in Rhode Island
The most populous ancestries reported in Rhode Island are Irish (182,950 | 16.7%), Italian (165,626 | 15.1%), English (118,652 | 10.8%), French (86,406 | 7.9%), and Portuguese (78,904 | 7.2%), together accounting for 57.8% of all Rhode Island residents.
| Ancestry | # Population | % Population |
| Afghan | 4 | 0.0% |
| African | 6,269 | 0.6% |
| Albanian | 756 | 0.1% |
| Alsatian | 31 | 0.0% |
| American | 39,691 | 3.6% |
| Apache | 64 | 0.0% |
| Arab | 9,304 | 0.9% |
| Arapaho | 10 | 0.0% |
| Argentinean | 638 | 0.1% |
| Armenian | 5,056 | 0.5% |
| Assyrian / Chaldean / Syriac | 267 | 0.0% |
| Australian | 208 | 0.0% |
| Austrian | 1,701 | 0.2% |
| Bahamian | 13 | 0.0% |
| Bangladeshi | 900 | 0.1% |
| Barbadian | 276 | 0.0% |
| Basque | 113 | 0.0% |
| Belgian | 1,081 | 0.1% |
| Belizean | 114 | 0.0% |
| Bermudan | 72 | 0.0% |
| Bhutanese | 2,622 | 0.2% |
| Blackfeet | 401 | 0.0% |
| Bolivian | 1,849 | 0.2% |
| Brazilian | 2,395 | 0.2% |
| British | 4,666 | 0.4% |
| British West Indian | 260 | 0.0% |
| Bulgarian | 139 | 0.0% |
| Burmese | 3,072 | 0.3% |
| Cajun | 91 | 0.0% |
| Cambodian | 15 | 0.0% |
| Canadian | 3,407 | 0.3% |
| Cape Verdean | 18,154 | 1.7% |
| Carpatho Rusyn | 133 | 0.0% |
| Celtic | 71 | 0.0% |
| Central American | 36,045 | 3.3% |
| Central American Indian | 2,811 | 0.3% |
| Cherokee | 1,150 | 0.1% |
| Cheyenne | 48 | 0.0% |
| Chilean | 328 | 0.0% |
| Chinese | 25 | 0.0% |
| Chippewa | 135 | 0.0% |
| Choctaw | 119 | 0.0% |
| Colombian | 11,637 | 1.1% |
| Costa Rican | 587 | 0.1% |
| Cree | 22 | 0.0% |
| Creek | 110 | 0.0% |
| Croatian | 493 | 0.1% |
| Crow | 23 | 0.0% |
| Cuban | 2,045 | 0.2% |
| Cypriot | 57 | 0.0% |
| Czech | 1,642 | 0.2% |
| Czechoslovakian | 397 | 0.0% |
| Danish | 1,334 | 0.1% |
| Delaware | 16 | 0.0% |
| Dominican | 58,623 | 5.4% |
| Dutch | 4,555 | 0.4% |
| Dutch West Indian | 38 | 0.0% |
| Eastern European | 4,058 | 0.4% |
| Ecuadorian | 1,750 | 0.2% |
| Egyptian | 1,105 | 0.1% |
| English | 118,652 | 10.8% |
| Estonian | 52 | 0.0% |
| Ethiopian | 58 | 0.0% |
| European | 9,016 | 0.8% |
| Filipino | 828 | 0.1% |
| Finnish | 1,218 | 0.1% |
| French | 86,406 | 7.9% |
| French American Indian | 323 | 0.0% |
| French Canadian | 47,526 | 4.3% |
| German | 53,362 | 4.9% |
| German Russian | 17 | 0.0% |
| Ghanaian | 140 | 0.0% |
| Greek | 7,229 | 0.7% |
| Guamanian / Chamorro | 49 | 0.0% |
| Guatemalan | 27,884 | 2.5% |
| Guyanese | 427 | 0.0% |
| Haitian | 4,855 | 0.4% |
| Honduran | 1,886 | 0.2% |
| Hungarian | 2,114 | 0.2% |
| Icelander | 89 | 0.0% |
| Indian (Asian) | 9,292 | 0.9% |
| Indonesian | 145 | 0.0% |
| Iranian | 291 | 0.0% |
| Iraqi | 129 | 0.0% |
| Irish | 182,950 | 16.7% |
| Iroquois | 418 | 0.0% |
| Israeli | 195 | 0.0% |
| Italian | 165,626 | 15.1% |
| Jamaican | 2,271 | 0.2% |
| Japanese | 6,731 | 0.6% |
| Jordanian | 177 | 0.0% |
| Kenyan | 90 | 0.0% |
| Korean | 5,961 | 0.5% |
| Laotian | 220 | 0.0% |
| Latvian | 255 | 0.0% |
| Lebanese | 3,564 | 0.3% |
| Liberian | 3,646 | 0.3% |
| Lithuanian | 3,403 | 0.3% |
| Lumbee | 25 | 0.0% |
| Luxembourger | 43 | 0.0% |
| Macedonian | 107 | 0.0% |
| Malaysian | 3,101 | 0.3% |
| Maltese | 76 | 0.0% |
| Menominee | 9 | 0.0% |
| Mexican | 11,441 | 1.1% |
| Mexican American Indian | 548 | 0.1% |
| Mongolian | 103 | 0.0% |
| Moroccan | 576 | 0.1% |
| Native Hawaiian | 636 | 0.1% |
| Navajo | 138 | 0.0% |
| New Zealander | 35 | 0.0% |
| Nicaraguan | 536 | 0.1% |
| Nigerian | 4,462 | 0.4% |
| Northern European | 758 | 0.1% |
| Norwegian | 3,896 | 0.4% |
| Okinawan | 44 | 0.0% |
| Ottawa | 2 | 0.0% |
| Pakistani | 909 | 0.1% |
| Palestinian | 246 | 0.0% |
| Panamanian | 857 | 0.1% |
| Pennsylvania German | 135 | 0.0% |
| Peruvian | 1,173 | 0.1% |
| Polish | 35,674 | 3.3% |
| Portuguese | 78,904 | 7.2% |
| Pueblo | 32 | 0.0% |
| Puerto Rican | 47,954 | 4.4% |
| Romanian | 1,029 | 0.1% |
| Russian | 8,617 | 0.8% |
| Salvadoran | 4,148 | 0.4% |
| Samoan | 213 | 0.0% |
| Scandinavian | 1,674 | 0.2% |
| Scotch-Irish | 4,505 | 0.4% |
| Scottish | 16,923 | 1.5% |
| Seminole | 259 | 0.0% |
| Senegalese | 536 | 0.1% |
| Serbian | 96 | 0.0% |
| Shoshone | 11 | 0.0% |
| Sierra Leonean | 154 | 0.0% |
| Sioux | 63 | 0.0% |
| Slavic | 110 | 0.0% |
| Slovak | 878 | 0.1% |
| Slovene | 72 | 0.0% |
| Somali | 15 | 0.0% |
| South African | 124 | 0.0% |
| South American | 18,593 | 1.7% |
| South American Indian | 316 | 0.0% |
| Soviet Union | 7 | 0.0% |
| Spaniard | 1,714 | 0.2% |
| Spanish | 1,507 | 0.1% |
| Spanish American Indian | 26 | 0.0% |
| Sri Lankan | 1,452 | 0.1% |
| Subsaharan African | 34,451 | 3.2% |
| Swedish | 14,736 | 1.3% |
| Swiss | 1,067 | 0.1% |
| Syrian | 2,157 | 0.2% |
| Thai | 10,147 | 0.9% |
| Tohono O'Odham | 6 | 0.0% |
| Trinidadian and Tobagonian | 499 | 0.1% |
| Turkish | 451 | 0.0% |
| Ukrainian | 2,984 | 0.3% |
| Uruguayan | 90 | 0.0% |
| Venezuelan | 1,071 | 0.1% |
| Vietnamese | 278 | 0.0% |
| Welsh | 3,329 | 0.3% |
| West Indian | 753 | 0.1% |
| Yaqui | 14 | 0.0% |
| Yugoslavian | 43 | 0.0% |
| Zimbabwean | 8 | 0.0% | View All 168 Rows |
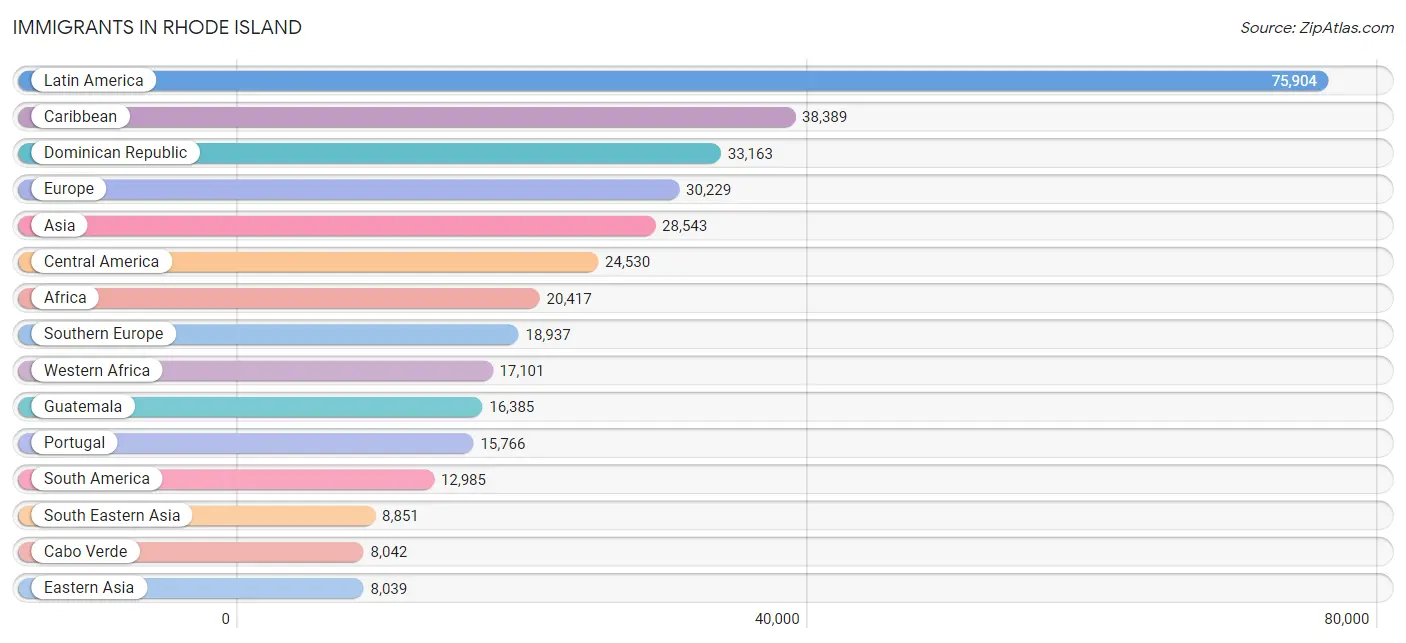
Immigrants in Rhode Island
The most numerous immigrant groups reported in Rhode Island came from Latin America (75,904 | 6.9%), Caribbean (38,389 | 3.5%), Dominican Republic (33,163 | 3.0%), Europe (30,229 | 2.8%), and Asia (28,543 | 2.6%), together accounting for 18.9% of all Rhode Island residents.
| Immigration Origin | # Population | % Population |
| Africa | 20,417 | 1.9% |
| Albania | 336 | 0.0% |
| Argentina | 283 | 0.0% |
| Armenia | 147 | 0.0% |
| Asia | 28,543 | 2.6% |
| Australia | 135 | 0.0% |
| Austria | 110 | 0.0% |
| Azores | 3,822 | 0.4% |
| Bangladesh | 84 | 0.0% |
| Barbados | 118 | 0.0% |
| Belarus | 262 | 0.0% |
| Belgium | 77 | 0.0% |
| Belize | 21 | 0.0% |
| Bolivia | 821 | 0.1% |
| Bosnia and Herzegovina | 52 | 0.0% |
| Brazil | 2,826 | 0.3% |
| Bulgaria | 137 | 0.0% |
| Cabo Verde | 8,042 | 0.7% |
| Cambodia | 1,902 | 0.2% |
| Cameroon | 40 | 0.0% |
| Canada | 2,304 | 0.2% |
| Caribbean | 38,389 | 3.5% |
| Central America | 24,530 | 2.2% |
| Chile | 114 | 0.0% |
| China | 5,954 | 0.5% |
| Colombia | 6,520 | 0.6% |
| Costa Rica | 79 | 0.0% |
| Croatia | 33 | 0.0% |
| Cuba | 406 | 0.0% |
| Czechoslovakia | 137 | 0.0% |
| Denmark | 130 | 0.0% |
| Dominica | 131 | 0.0% |
| Dominican Republic | 33,163 | 3.0% |
| Eastern Africa | 583 | 0.1% |
| Eastern Asia | 8,039 | 0.7% |
| Eastern Europe | 4,947 | 0.4% |
| Ecuador | 793 | 0.1% |
| Egypt | 505 | 0.1% |
| El Salvador | 2,654 | 0.2% |
| England | 1,051 | 0.1% |
| Eritrea | 39 | 0.0% |
| Ethiopia | 25 | 0.0% |
| Europe | 30,229 | 2.8% |
| Fiji | 135 | 0.0% |
| France | 630 | 0.1% |
| Germany | 1,314 | 0.1% |
| Ghana | 332 | 0.0% |
| Greece | 603 | 0.1% |
| Guatemala | 16,385 | 1.5% |
| Guyana | 175 | 0.0% |
| Haiti | 3,057 | 0.3% |
| Honduras | 1,059 | 0.1% |
| Hong Kong | 712 | 0.1% |
| Hungary | 241 | 0.0% |
| India | 6,461 | 0.6% |
| Indonesia | 138 | 0.0% |
| Iran | 213 | 0.0% |
| Iraq | 332 | 0.0% |
| Ireland | 637 | 0.1% |
| Israel | 225 | 0.0% |
| Italy | 2,155 | 0.2% |
| Jamaica | 848 | 0.1% |
| Japan | 734 | 0.1% |
| Jordan | 127 | 0.0% |
| Kazakhstan | 96 | 0.0% |
| Kenya | 134 | 0.0% |
| Korea | 1,351 | 0.1% |
| Kuwait | 26 | 0.0% |
| Laos | 2,091 | 0.2% |
| Latin America | 75,904 | 6.9% |
| Latvia | 57 | 0.0% |
| Lebanon | 847 | 0.1% |
| Liberia | 3,901 | 0.4% |
| Lithuania | 71 | 0.0% |
| Malaysia | 113 | 0.0% |
| Mexico | 3,836 | 0.4% |
| Middle Africa | 359 | 0.0% |
| Moldova | 64 | 0.0% |
| Morocco | 311 | 0.0% |
| Nepal | 76 | 0.0% |
| Netherlands | 405 | 0.0% |
| Nicaragua | 192 | 0.0% |
| Nigeria | 2,997 | 0.3% |
| North Macedonia | 35 | 0.0% |
| Northern Africa | 899 | 0.1% |
| Northern Europe | 3,635 | 0.3% |
| Norway | 126 | 0.0% |
| Oceania | 309 | 0.0% |
| Pakistan | 790 | 0.1% |
| Panama | 304 | 0.0% |
| Peru | 556 | 0.1% |
| Philippines | 2,625 | 0.2% |
| Poland | 1,070 | 0.1% |
| Portugal | 15,766 | 1.4% |
| Romania | 303 | 0.0% |
| Russia | 1,165 | 0.1% |
| Saudi Arabia | 33 | 0.0% |
| Scotland | 453 | 0.0% |
| Senegal | 895 | 0.1% |
| Serbia | 74 | 0.0% |
| Sierra Leone | 172 | 0.0% |
| Singapore | 197 | 0.0% |
| South Africa | 115 | 0.0% |
| South America | 12,985 | 1.2% |
| South Central Asia | 7,926 | 0.7% |
| South Eastern Asia | 8,851 | 0.8% |
| Southern Europe | 18,937 | 1.7% |
| Spain | 399 | 0.0% |
| Sri Lanka | 59 | 0.0% |
| Sweden | 150 | 0.0% |
| Switzerland | 107 | 0.0% |
| Syria | 901 | 0.1% |
| Taiwan | 453 | 0.0% |
| Thailand | 954 | 0.1% |
| Trinidad and Tobago | 554 | 0.1% |
| Turkey | 478 | 0.0% |
| Ukraine | 769 | 0.1% |
| Uruguay | 52 | 0.0% |
| Uzbekistan | 147 | 0.0% |
| Venezuela | 756 | 0.1% |
| Vietnam | 714 | 0.1% |
| West Indies | 5 | 0.0% |
| Western Africa | 17,101 | 1.6% |
| Western Asia | 3,646 | 0.3% |
| Western Europe | 2,659 | 0.2% |
| Zaire | 44 | 0.0% |
| Zimbabwe | 25 | 0.0% | View All 127 Rows |
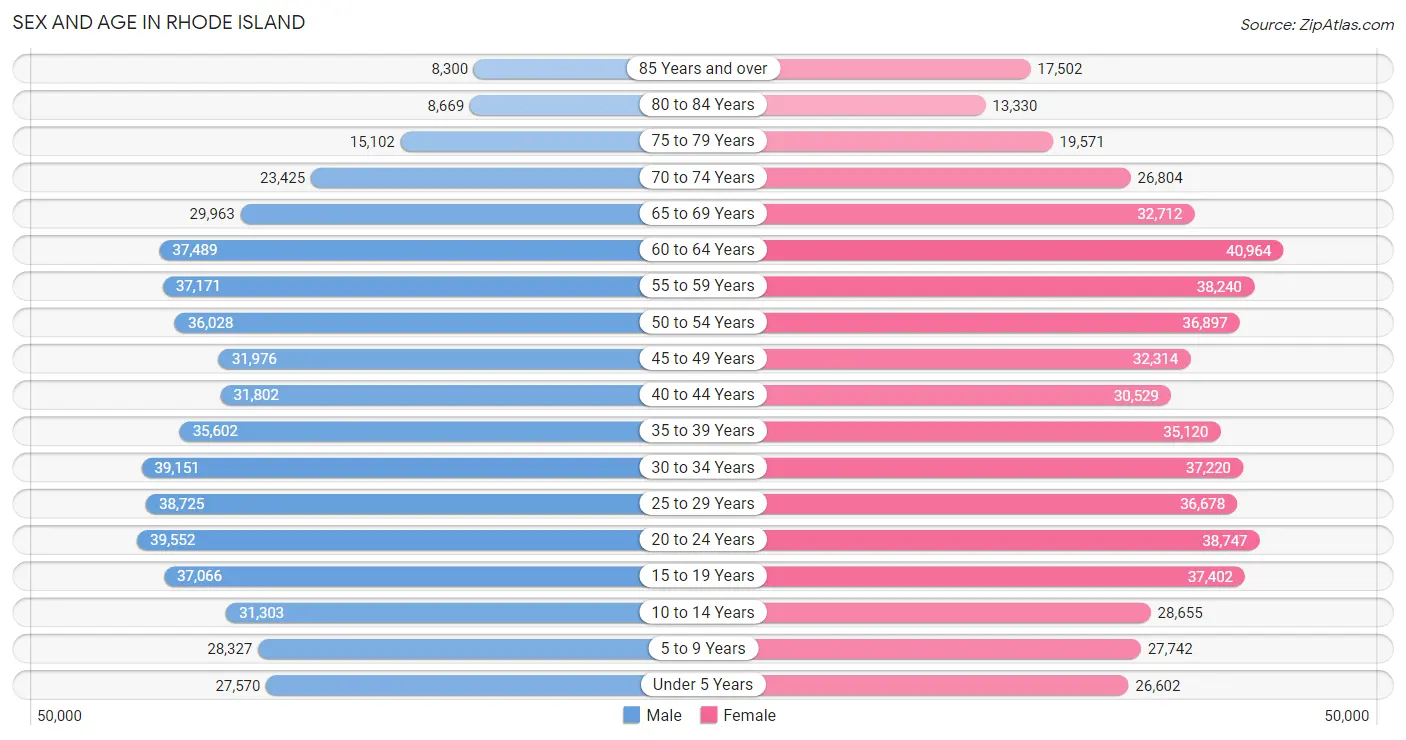
Sex and Age in Rhode Island
Sex and Age in Rhode Island
The most populous age groups in Rhode Island are 20 to 24 Years (39,552 | 7.4%) for men and 60 to 64 Years (40,964 | 7.3%) for women.
| Age Bracket | Male | Female |
| Under 5 Years | 27,570 (5.1%) | 26,602 (4.8%) |
| 5 to 9 Years | 28,327 (5.3%) | 27,742 (5.0%) |
| 10 to 14 Years | 31,303 (5.8%) | 28,655 (5.1%) |
| 15 to 19 Years | 37,066 (6.9%) | 37,402 (6.7%) |
| 20 to 24 Years | 39,552 (7.4%) | 38,747 (7.0%) |
| 25 to 29 Years | 38,725 (7.2%) | 36,678 (6.6%) |
| 30 to 34 Years | 39,151 (7.3%) | 37,220 (6.7%) |
| 35 to 39 Years | 35,602 (6.6%) | 35,120 (6.3%) |
| 40 to 44 Years | 31,802 (5.9%) | 30,529 (5.5%) |
| 45 to 49 Years | 31,976 (5.9%) | 32,314 (5.8%) |
| 50 to 54 Years | 36,028 (6.7%) | 36,897 (6.6%) |
| 55 to 59 Years | 37,171 (6.9%) | 38,240 (6.9%) |
| 60 to 64 Years | 37,489 (7.0%) | 40,964 (7.3%) |
| 65 to 69 Years | 29,963 (5.6%) | 32,712 (5.9%) |
| 70 to 74 Years | 23,425 (4.4%) | 26,804 (4.8%) |
| 75 to 79 Years | 15,102 (2.8%) | 19,571 (3.5%) |
| 80 to 84 Years | 8,669 (1.6%) | 13,330 (2.4%) |
| 85 Years and over | 8,300 (1.5%) | 17,502 (3.1%) |
| Total | 537,221 (100.0%) | 557,029 (100.0%) |
Families and Households in Rhode Island
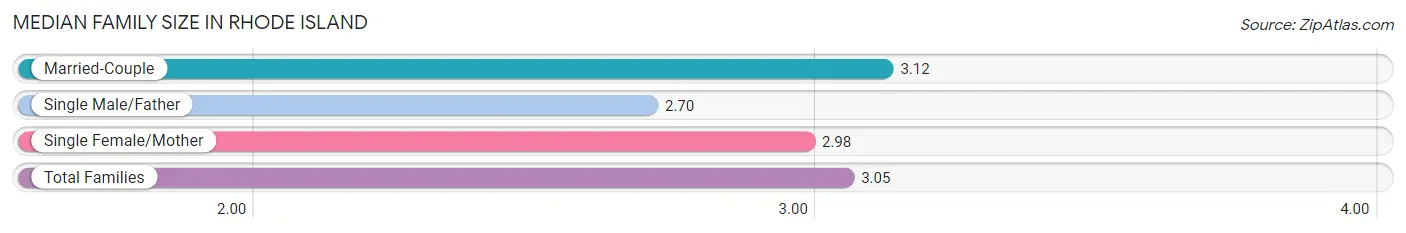
Median Family Size in Rhode Island
The median family size in Rhode Island is 3.05 persons per family, with married-couple families (188,597 | 71.0%) accounting for the largest median family size of 3.12 persons per family. On the other hand, single male/father families (22,355 | 8.4%) represent the smallest median family size with 2.70 persons per family.
| Family Type | # Families | Family Size |
| Married-Couple | 188,597 (71.0%) | 3.12 |
| Single Male/Father | 22,355 (8.4%) | 2.70 |
| Single Female/Mother | 54,649 (20.6%) | 2.98 |
| Total Families | 265,601 (100.0%) | 3.05 |
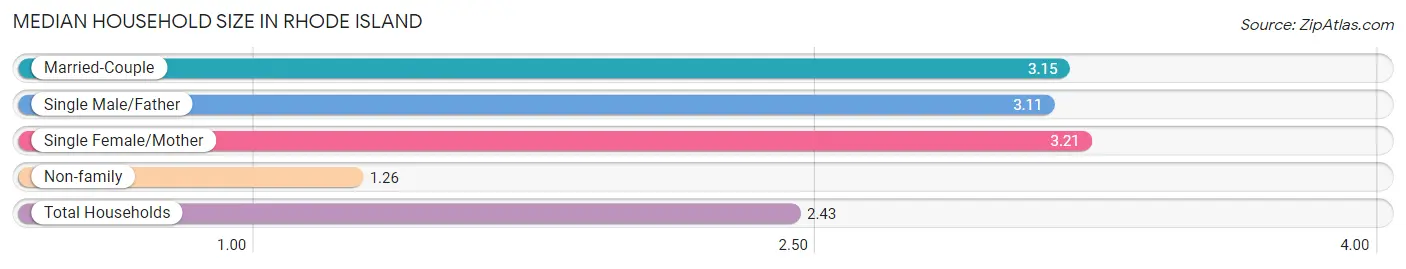
Median Household Size in Rhode Island
The median household size in Rhode Island is 2.43 persons per household, with single female/mother households (54,649 | 12.6%) accounting for the largest median household size of 3.21 persons per household. non-family households (166,618 | 38.6%) represent the smallest median household size with 1.26 persons per household.
| Household Type | # Households | Household Size |
| Married-Couple | 188,597 (43.6%) | 3.15 |
| Single Male/Father | 22,355 (5.2%) | 3.11 |
| Single Female/Mother | 54,649 (12.6%) | 3.21 |
| Non-family | 166,618 (38.6%) | 1.26 |
| Total Households | 432,219 (100.0%) | 2.43 |
Household Size by Marriage Status in Rhode Island
Out of a total of 432,219 households in Rhode Island, 265,601 (61.5%) are family households, while 166,618 (38.6%) are nonfamily households. The most numerous type of family households are 2-person households, comprising 117,529, and the most common type of nonfamily households are 1-person households, comprising 131,624.
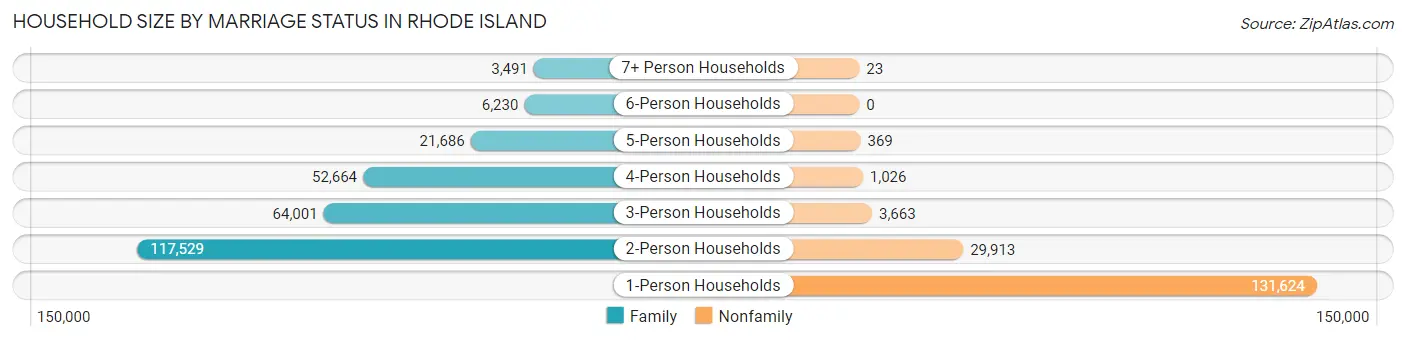
| Household Size | Family Households | Nonfamily Households |
| 1-Person Households | - | 131,624 (30.4%) |
| 2-Person Households | 117,529 (27.2%) | 29,913 (6.9%) |
| 3-Person Households | 64,001 (14.8%) | 3,663 (0.9%) |
| 4-Person Households | 52,664 (12.2%) | 1,026 (0.2%) |
| 5-Person Households | 21,686 (5.0%) | 369 (0.1%) |
| 6-Person Households | 6,230 (1.4%) | 0 (0.0%) |
| 7+ Person Households | 3,491 (0.8%) | 23 (0.0%) |
| Total | 265,601 (61.5%) | 166,618 (38.6%) |
Female Fertility in Rhode Island
Fertility by Age in Rhode Island
Average fertility rate in Rhode Island is 46.0 births per 1,000 women. Women in the age bracket of 20 to 34 years have the highest fertility rate with 70.0 births per 1,000 women. Women in the age bracket of 20 to 34 years acount for 66.5% of all women with births.
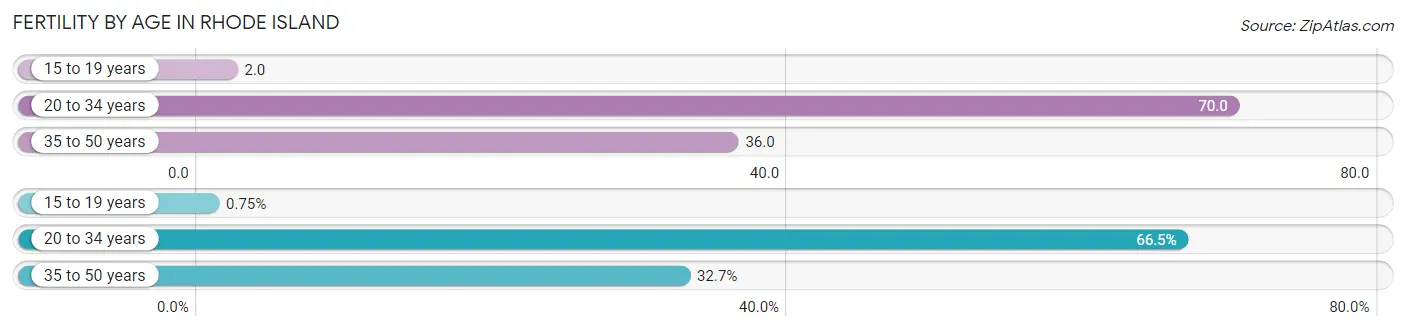
| Age Bracket | Women with Births | Births / 1,000 Women |
| 15 to 19 years | 88 (0.7%) | 2.0 |
| 20 to 34 years | 7,845 (66.5%) | 70.0 |
| 35 to 50 years | 3,858 (32.7%) | 36.0 |
| Total | 11,791 (100.0%) | 46.0 |
Fertility by Age by Marriage Status in Rhode Island
67.9% of women with births (11,791) in Rhode Island are married. The highest percentage of unmarried women with births falls into 15 to 19 years age bracket with 100.0% of them unmarried at the time of birth, while the lowest percentage of unmarried women with births belong to 35 to 50 years age bracket with 24.2% of them unmarried.
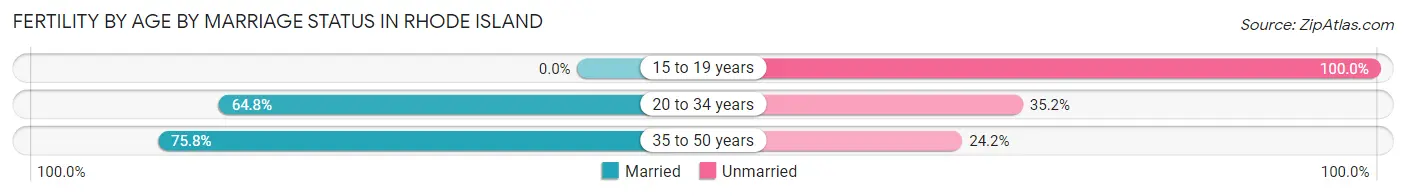
| Age Bracket | Married | Unmarried |
| 15 to 19 years | 0 (0.0%) | 88 (100.0%) |
| 20 to 34 years | 5,084 (64.8%) | 2,761 (35.2%) |
| 35 to 50 years | 2,924 (75.8%) | 934 (24.2%) |
| Total | 8,006 (67.9%) | 3,785 (32.1%) |
Fertility by Education in Rhode Island
Average fertility rate in Rhode Island is 46.0 births per 1,000 women. Women with the education attainment of graduate degree have the highest fertility rate of 74.0 births per 1,000 women, while women with the education attainment of less than high school have the lowest fertility at 29.0 births per 1,000 women. Women with the education attainment of bachelor's degree represent 26.8% of all women with births.
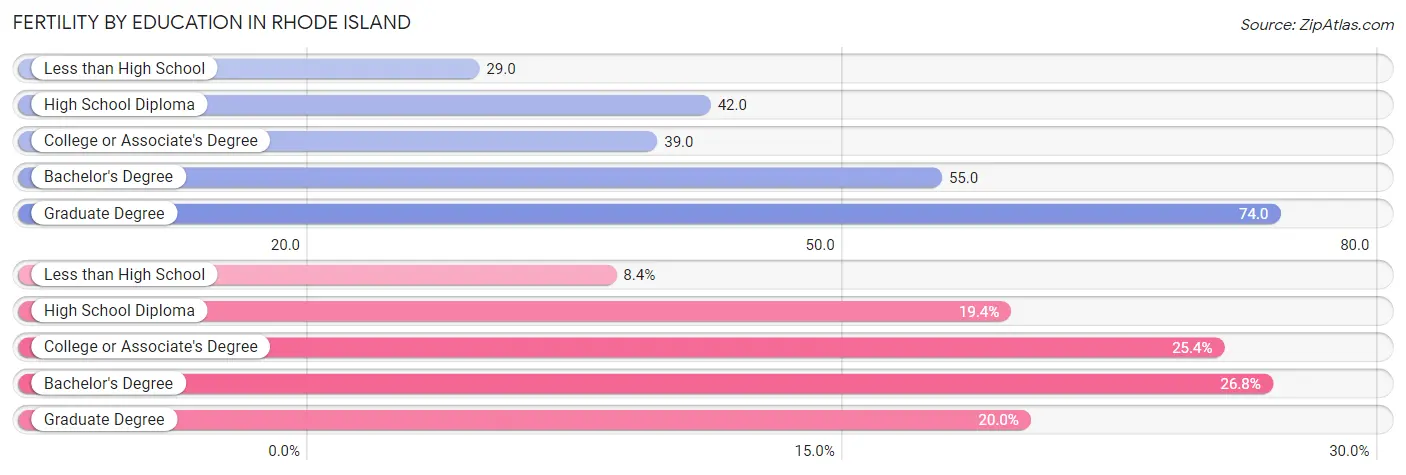
| Educational Attainment | Women with Births | Births / 1,000 Women |
| Less than High School | 985 (8.4%) | 29.0 |
| High School Diploma | 2,292 (19.4%) | 42.0 |
| College or Associate's Degree | 2,998 (25.4%) | 39.0 |
| Bachelor's Degree | 3,159 (26.8%) | 55.0 |
| Graduate Degree | 2,357 (20.0%) | 74.0 |
| Total | 11,791 (100.0%) | 46.0 |
Fertility by Education by Marriage Status in Rhode Island
32.1% of women with births in Rhode Island are unmarried. Women with the educational attainment of graduate degree are most likely to be married with 89.5% of them married at childbirth, while women with the educational attainment of high school diploma are least likely to be married with 61.2% of them unmarried at childbirth.
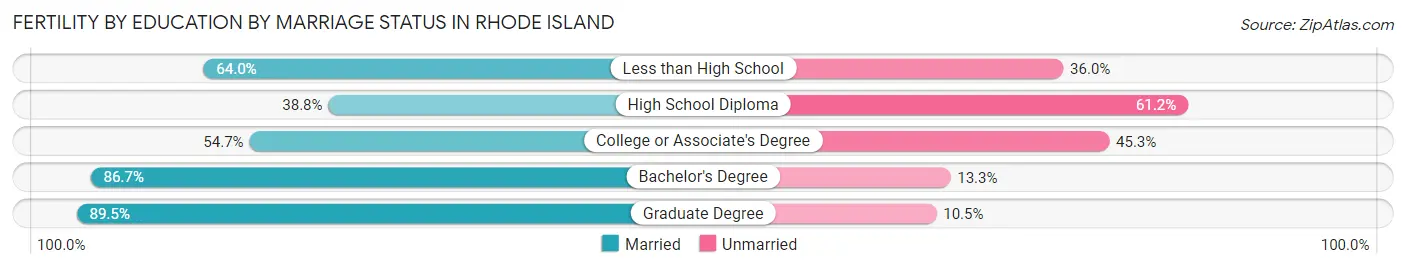
| Educational Attainment | Married | Unmarried |
| Less than High School | 630 (64.0%) | 355 (36.0%) |
| High School Diploma | 889 (38.8%) | 1,403 (61.2%) |
| College or Associate's Degree | 1,640 (54.7%) | 1,358 (45.3%) |
| Bachelor's Degree | 2,739 (86.7%) | 420 (13.3%) |
| Graduate Degree | 2,110 (89.5%) | 247 (10.5%) |
| Total | 8,006 (67.9%) | 3,785 (32.1%) |
Employment Characteristics in Rhode Island
Employment by Class of Employer in Rhode Island
Among the 542,687 employed individuals in Rhode Island, private company employees (356,252 | 65.6%), not-for-profit organizations (65,722 | 12.1%), and local government employees (34,158 | 6.3%) make up the most common classes of employment.
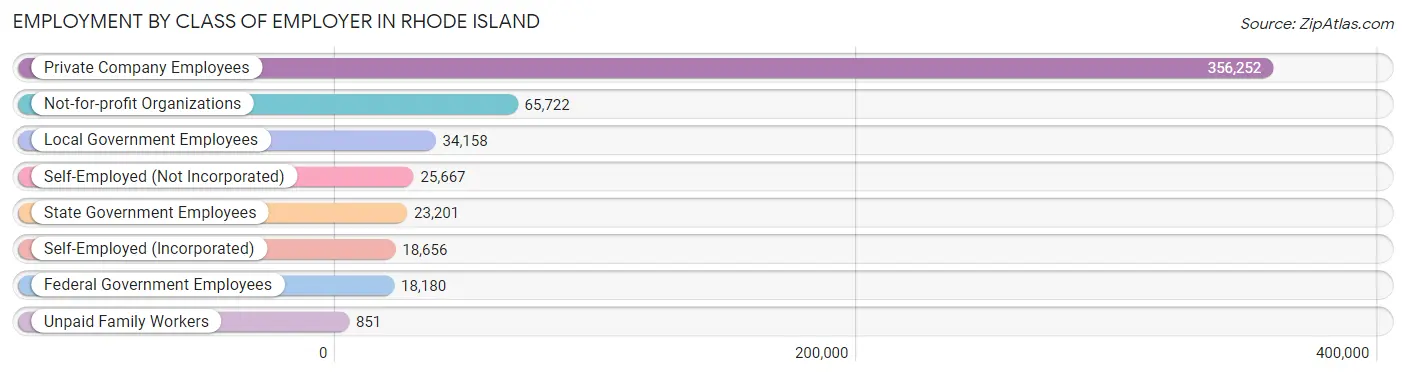
| Employer Class | # Employees | % Employees |
| Private Company Employees | 356,252 | 65.6% |
| Self-Employed (Incorporated) | 18,656 | 3.4% |
| Self-Employed (Not Incorporated) | 25,667 | 4.7% |
| Not-for-profit Organizations | 65,722 | 12.1% |
| Local Government Employees | 34,158 | 6.3% |
| State Government Employees | 23,201 | 4.3% |
| Federal Government Employees | 18,180 | 3.4% |
| Unpaid Family Workers | 851 | 0.2% |
| Total | 542,687 | 100.0% |
Employment Status by Age in Rhode Island
According to the labor force statistics for Rhode Island, out of the total population over 16 years of age (912,516), 64.9% or 592,223 individuals are in the labor force, with 5.9% or 34,941 of them unemployed. The age group with the highest labor force participation rate is 30 to 34 years, with 87.0% or 66,443 individuals in the labor force. Within the labor force, the 16 to 19 years age range has the highest percentage of unemployed individuals, with 13.3% or 3,532 of them being unemployed.
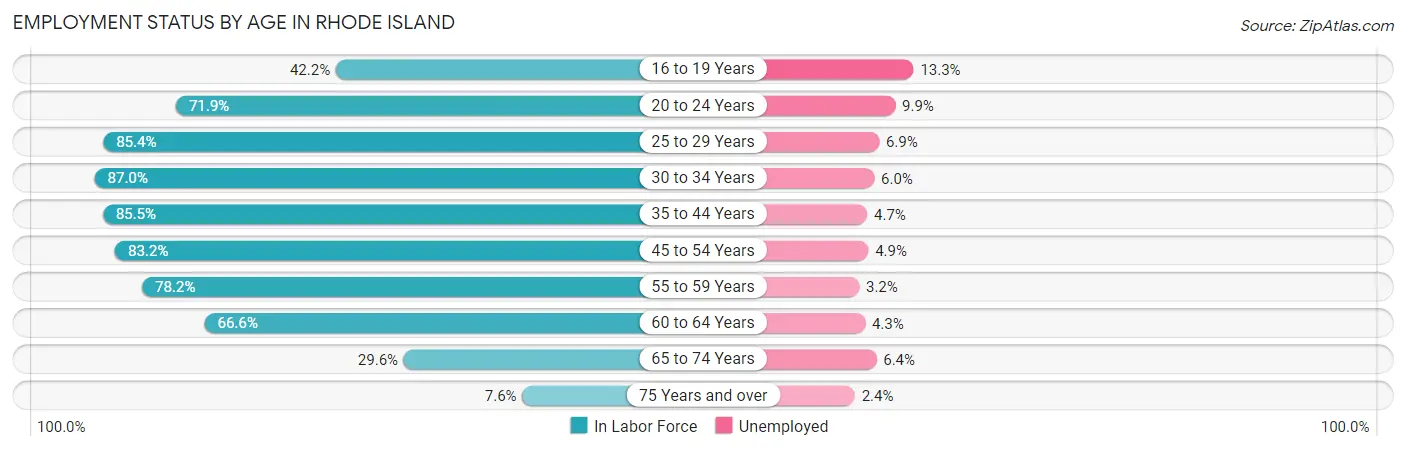
| Age Bracket | In Labor Force | Unemployed |
| 16 to 19 Years | 26,558 (42.2%) | 3,532 (13.3%) |
| 20 to 24 Years | 56,297 (71.9%) | 5,573 (9.9%) |
| 25 to 29 Years | 64,394 (85.4%) | 4,443 (6.9%) |
| 30 to 34 Years | 66,443 (87.0%) | 3,987 (6.0%) |
| 35 to 44 Years | 113,760 (85.5%) | 5,347 (4.7%) |
| 45 to 54 Years | 114,163 (83.2%) | 5,594 (4.9%) |
| 55 to 59 Years | 58,971 (78.2%) | 1,887 (3.2%) |
| 60 to 64 Years | 52,250 (66.6%) | 2,247 (4.3%) |
| 65 to 74 Years | 33,420 (29.6%) | 2,139 (6.4%) |
| 75 Years and over | 6,268 (7.6%) | 150 (2.4%) |
| Total | 592,223 (64.9%) | 34,941 (5.9%) |
Employment Status by Educational Attainment in Rhode Island
According to labor force statistics for Rhode Island, 81.6% of individuals (469,939) out of the total population between 25 and 64 years of age (575,906) are in the labor force, with 5.0% or 23,497 of them being unemployed. The group with the highest labor force participation rate are those with the educational attainment of bachelor's degree or higher, with 89.0% or 193,678 individuals in the labor force. Within the labor force, individuals with less than high school education have the highest percentage of unemployment, with 10.6% or 3,486 of them being unemployed.
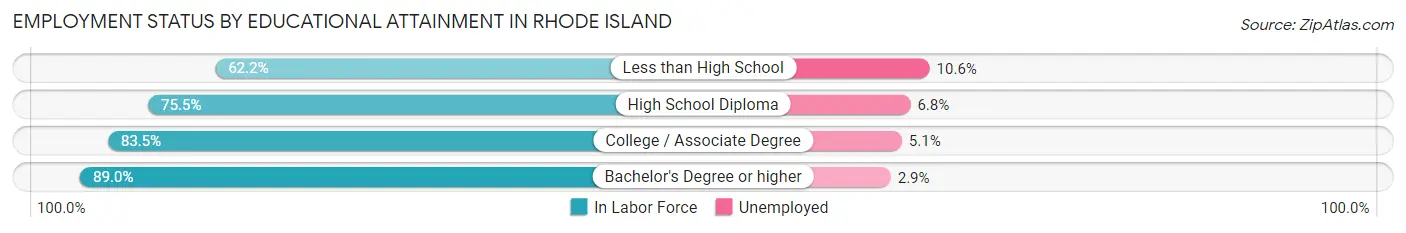
| Educational Attainment | In Labor Force | Unemployed |
| Less than High School | 32,883 (62.2%) | 5,604 (10.6%) |
| High School Diploma | 110,356 (75.5%) | 9,939 (6.8%) |
| College / Associate Degree | 132,979 (83.5%) | 8,122 (5.1%) |
| Bachelor's Degree or higher | 193,678 (89.0%) | 6,311 (2.9%) |
| Total | 469,939 (81.6%) | 28,795 (5.0%) |
Employment Occupations by Sex in Rhode Island
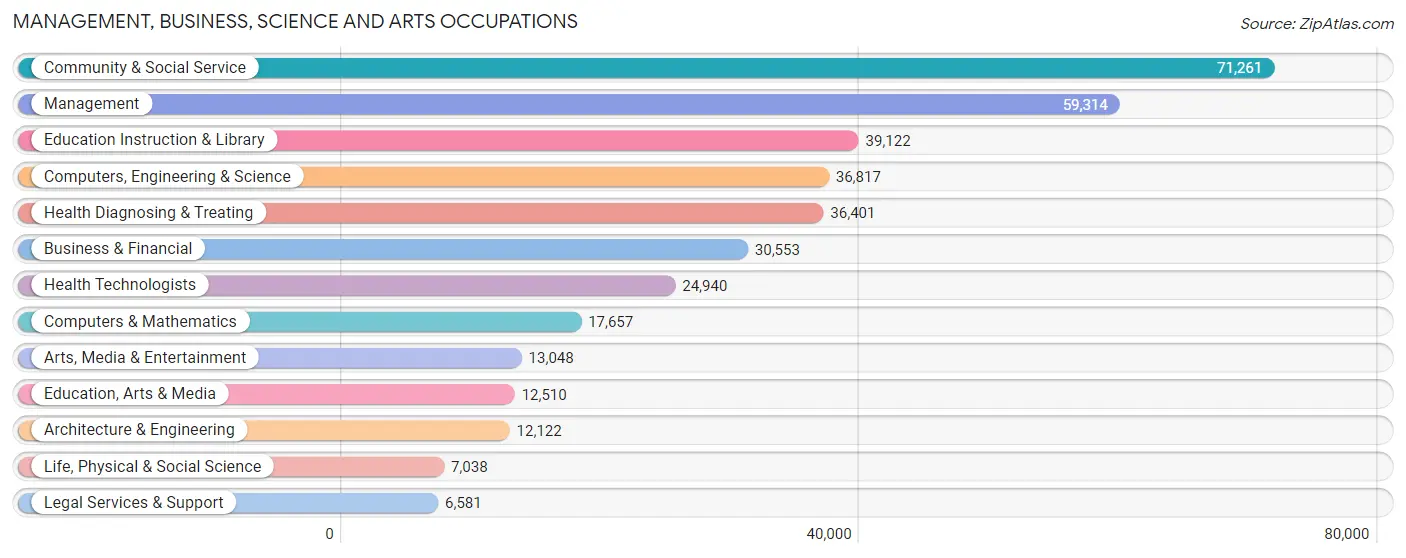
Management, Business, Science and Arts Occupations
The most common Management, Business, Science and Arts occupations in Rhode Island are Community & Social Service (71,261 | 12.9%), Management (59,314 | 10.7%), Education Instruction & Library (39,122 | 7.1%), Computers, Engineering & Science (36,817 | 6.7%), and Health Diagnosing & Treating (36,401 | 6.6%).
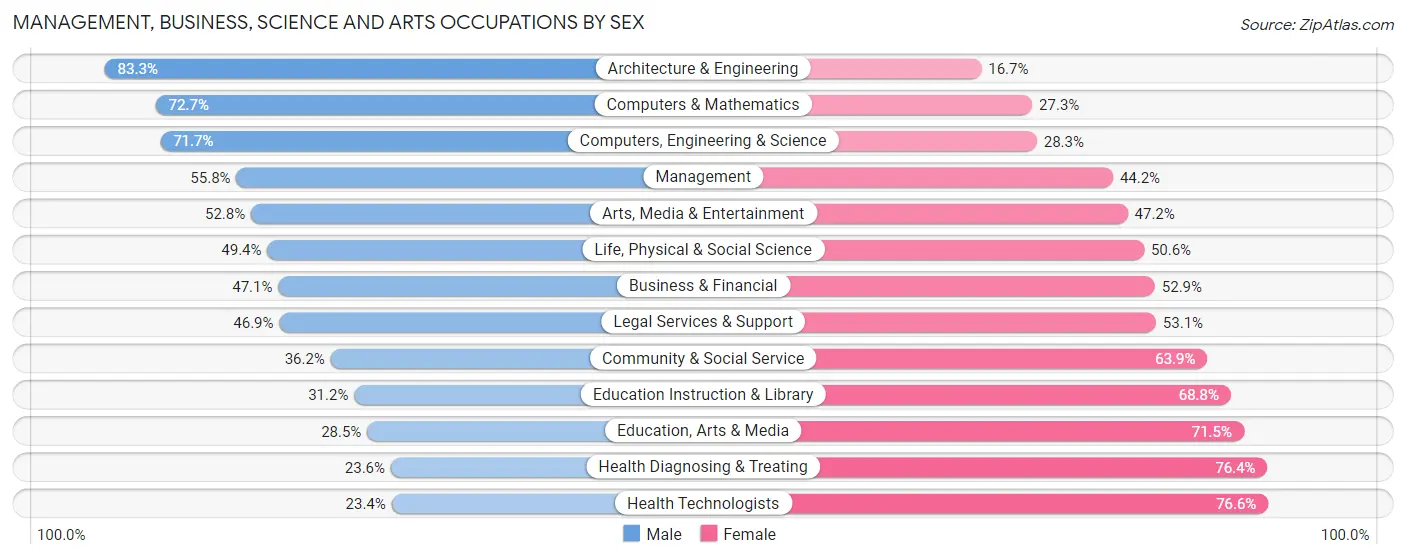
Management, Business, Science and Arts Occupations by Sex
Within the Management, Business, Science and Arts occupations in Rhode Island, the most male-oriented occupations are Architecture & Engineering (83.3%), Computers & Mathematics (72.7%), and Computers, Engineering & Science (71.7%), while the most female-oriented occupations are Health Technologists (76.6%), Health Diagnosing & Treating (76.4%), and Education, Arts & Media (71.5%).
| Occupation | Male | Female |
| Management | 33,111 (55.8%) | 26,203 (44.2%) |
| Business & Financial | 14,384 (47.1%) | 16,169 (52.9%) |
| Computers, Engineering & Science | 26,401 (71.7%) | 10,416 (28.3%) |
| Computers & Mathematics | 12,831 (72.7%) | 4,826 (27.3%) |
| Architecture & Engineering | 10,096 (83.3%) | 2,026 (16.7%) |
| Life, Physical & Social Science | 3,474 (49.4%) | 3,564 (50.6%) |
| Community & Social Service | 25,758 (36.1%) | 45,503 (63.8%) |
| Education, Arts & Media | 3,569 (28.5%) | 8,941 (71.5%) |
| Legal Services & Support | 3,084 (46.9%) | 3,497 (53.1%) |
| Education Instruction & Library | 12,221 (31.2%) | 26,901 (68.8%) |
| Arts, Media & Entertainment | 6,884 (52.8%) | 6,164 (47.2%) |
| Health Diagnosing & Treating | 8,589 (23.6%) | 27,812 (76.4%) |
| Health Technologists | 5,846 (23.4%) | 19,094 (76.6%) |
| Total (Category) | 108,243 (46.2%) | 126,103 (53.8%) |
| Total (Overall) | 284,519 (51.3%) | 269,535 (48.6%) |
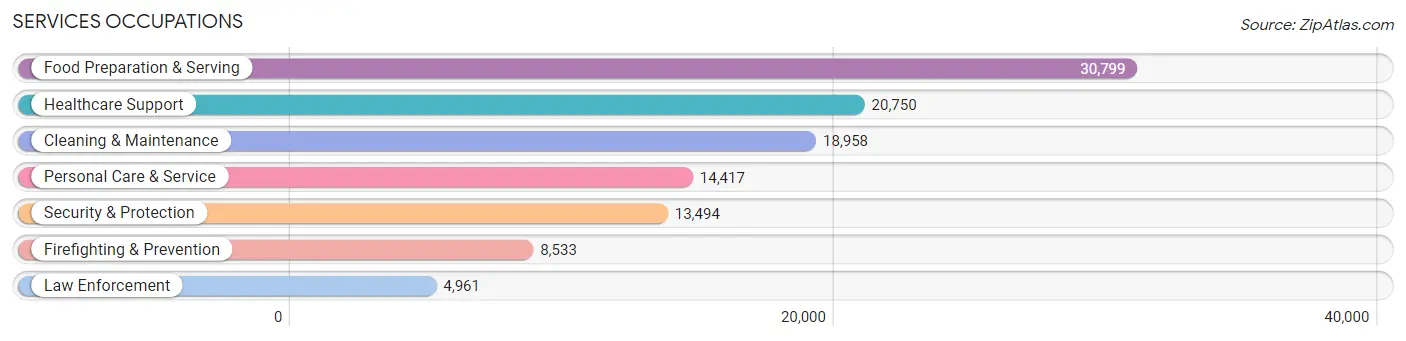
Services Occupations
The most common Services occupations in Rhode Island are Food Preparation & Serving (30,799 | 5.6%), Healthcare Support (20,750 | 3.7%), Cleaning & Maintenance (18,958 | 3.4%), Personal Care & Service (14,417 | 2.6%), and Security & Protection (13,494 | 2.4%).
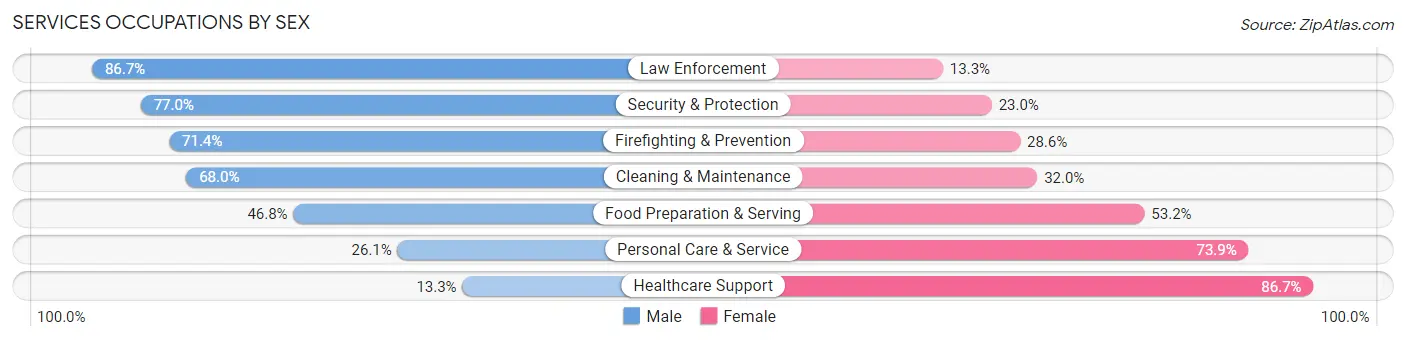
Services Occupations by Sex
Within the Services occupations in Rhode Island, the most male-oriented occupations are Law Enforcement (86.7%), Security & Protection (77.0%), and Firefighting & Prevention (71.4%), while the most female-oriented occupations are Healthcare Support (86.7%), Personal Care & Service (73.9%), and Food Preparation & Serving (53.2%).
| Occupation | Male | Female |
| Healthcare Support | 2,759 (13.3%) | 17,991 (86.7%) |
| Security & Protection | 10,390 (77.0%) | 3,104 (23.0%) |
| Firefighting & Prevention | 6,091 (71.4%) | 2,442 (28.6%) |
| Law Enforcement | 4,299 (86.7%) | 662 (13.3%) |
| Food Preparation & Serving | 14,403 (46.8%) | 16,396 (53.2%) |
| Cleaning & Maintenance | 12,889 (68.0%) | 6,069 (32.0%) |
| Personal Care & Service | 3,768 (26.1%) | 10,649 (73.9%) |
| Total (Category) | 44,209 (44.9%) | 54,209 (55.1%) |
| Total (Overall) | 284,519 (51.3%) | 269,535 (48.6%) |
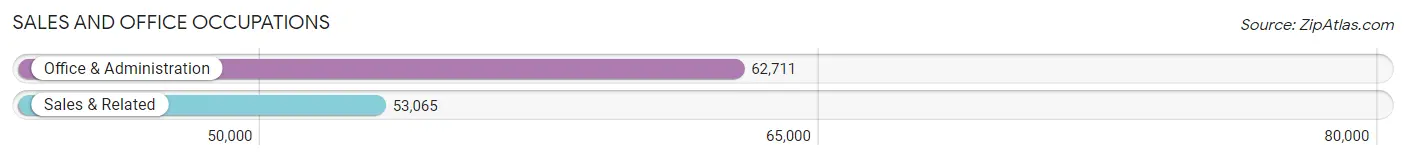
Sales and Office Occupations
The most common Sales and Office occupations in Rhode Island are Office & Administration (62,711 | 11.3%), and Sales & Related (53,065 | 9.6%).
Sales and Office Occupations by Sex
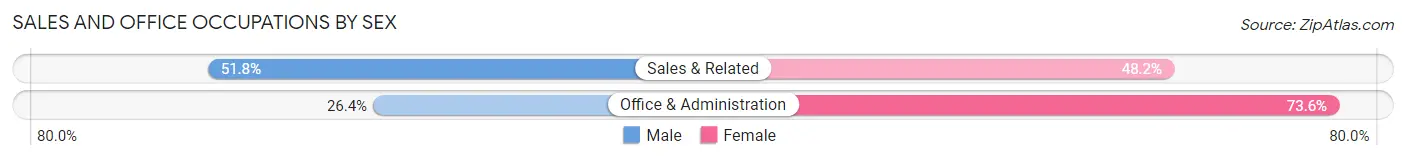
| Occupation | Male | Female |
| Sales & Related | 27,495 (51.8%) | 25,570 (48.2%) |
| Office & Administration | 16,563 (26.4%) | 46,148 (73.6%) |
| Total (Category) | 44,058 (38.1%) | 71,718 (62.0%) |
| Total (Overall) | 284,519 (51.3%) | 269,535 (48.6%) |
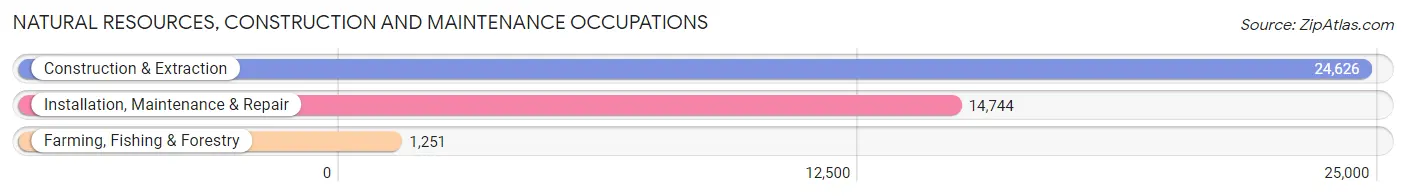
Natural Resources, Construction and Maintenance Occupations
The most common Natural Resources, Construction and Maintenance occupations in Rhode Island are Construction & Extraction (24,626 | 4.4%), Installation, Maintenance & Repair (14,744 | 2.7%), and Farming, Fishing & Forestry (1,251 | 0.2%).
Natural Resources, Construction and Maintenance Occupations by Sex
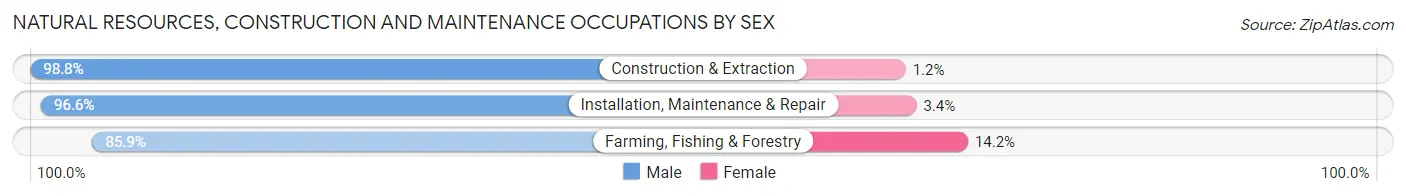
| Occupation | Male | Female |
| Farming, Fishing & Forestry | 1,074 (85.9%) | 177 (14.1%) |
| Construction & Extraction | 24,327 (98.8%) | 299 (1.2%) |
| Installation, Maintenance & Repair | 14,237 (96.6%) | 507 (3.4%) |
| Total (Category) | 39,638 (97.6%) | 983 (2.4%) |
| Total (Overall) | 284,519 (51.3%) | 269,535 (48.6%) |
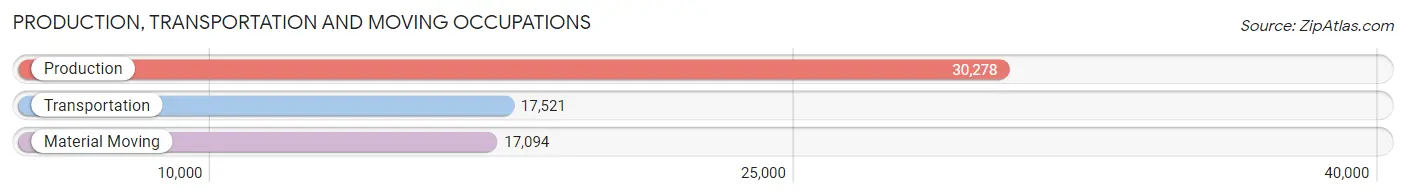
Production, Transportation and Moving Occupations
The most common Production, Transportation and Moving occupations in Rhode Island are Production (30,278 | 5.5%), Transportation (17,521 | 3.2%), and Material Moving (17,094 | 3.1%).
Production, Transportation and Moving Occupations by Sex
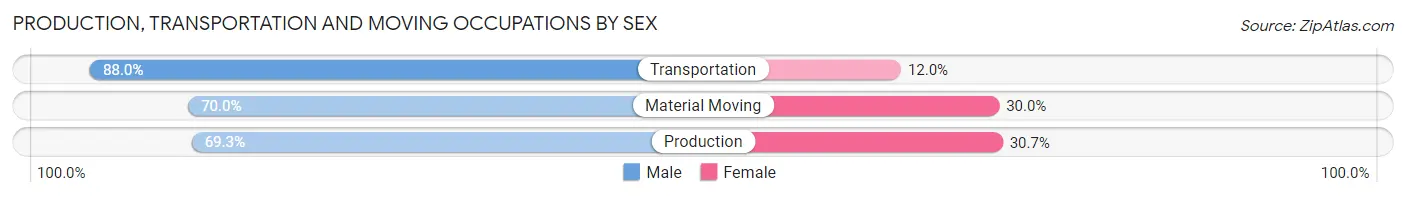
| Occupation | Male | Female |
| Production | 20,993 (69.3%) | 9,285 (30.7%) |
| Transportation | 15,418 (88.0%) | 2,103 (12.0%) |
| Material Moving | 11,960 (70.0%) | 5,134 (30.0%) |
| Total (Category) | 48,371 (74.5%) | 16,522 (25.5%) |
| Total (Overall) | 284,519 (51.3%) | 269,535 (48.6%) |
Employment Industries by Sex in Rhode Island
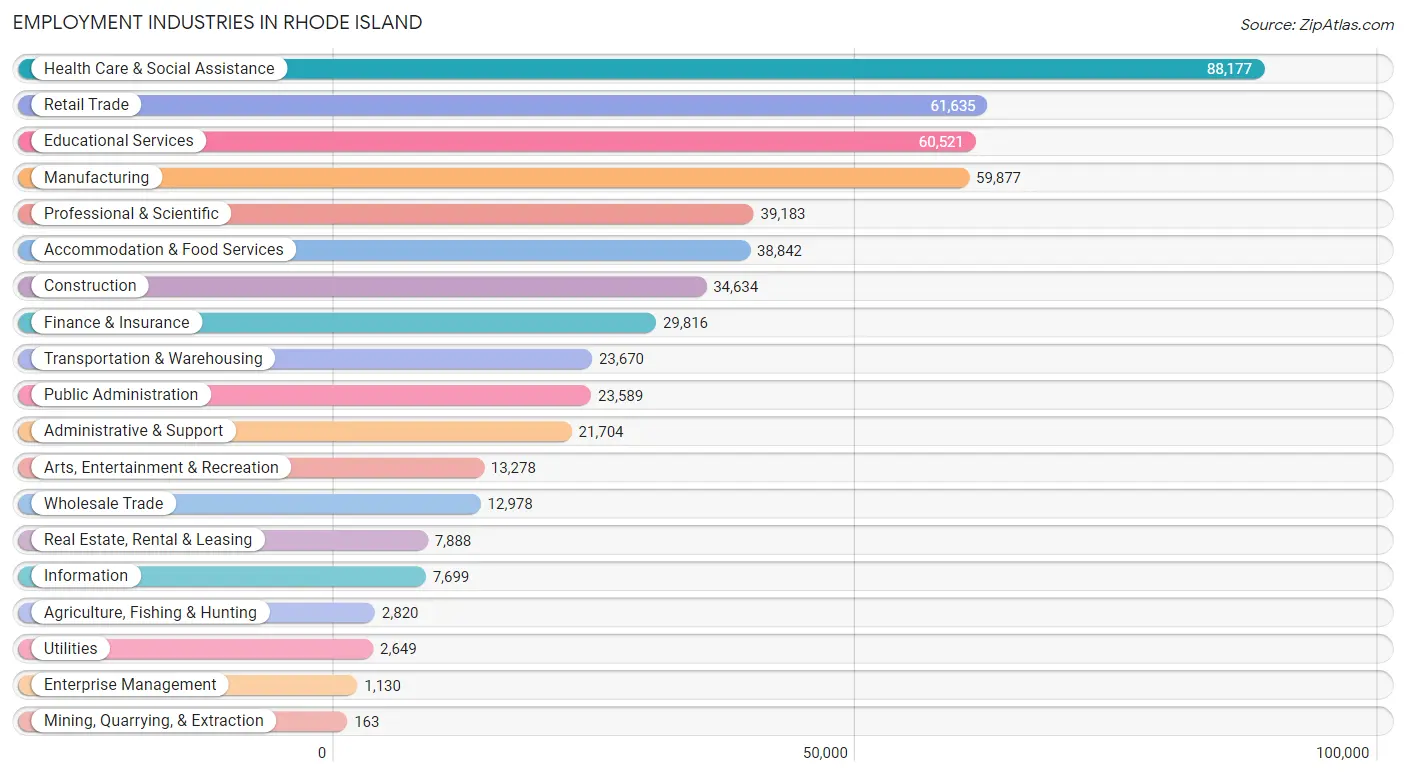
Employment Industries in Rhode Island
The major employment industries in Rhode Island include Health Care & Social Assistance (88,177 | 15.9%), Retail Trade (61,635 | 11.1%), Educational Services (60,521 | 10.9%), Manufacturing (59,877 | 10.8%), and Professional & Scientific (39,183 | 7.1%).
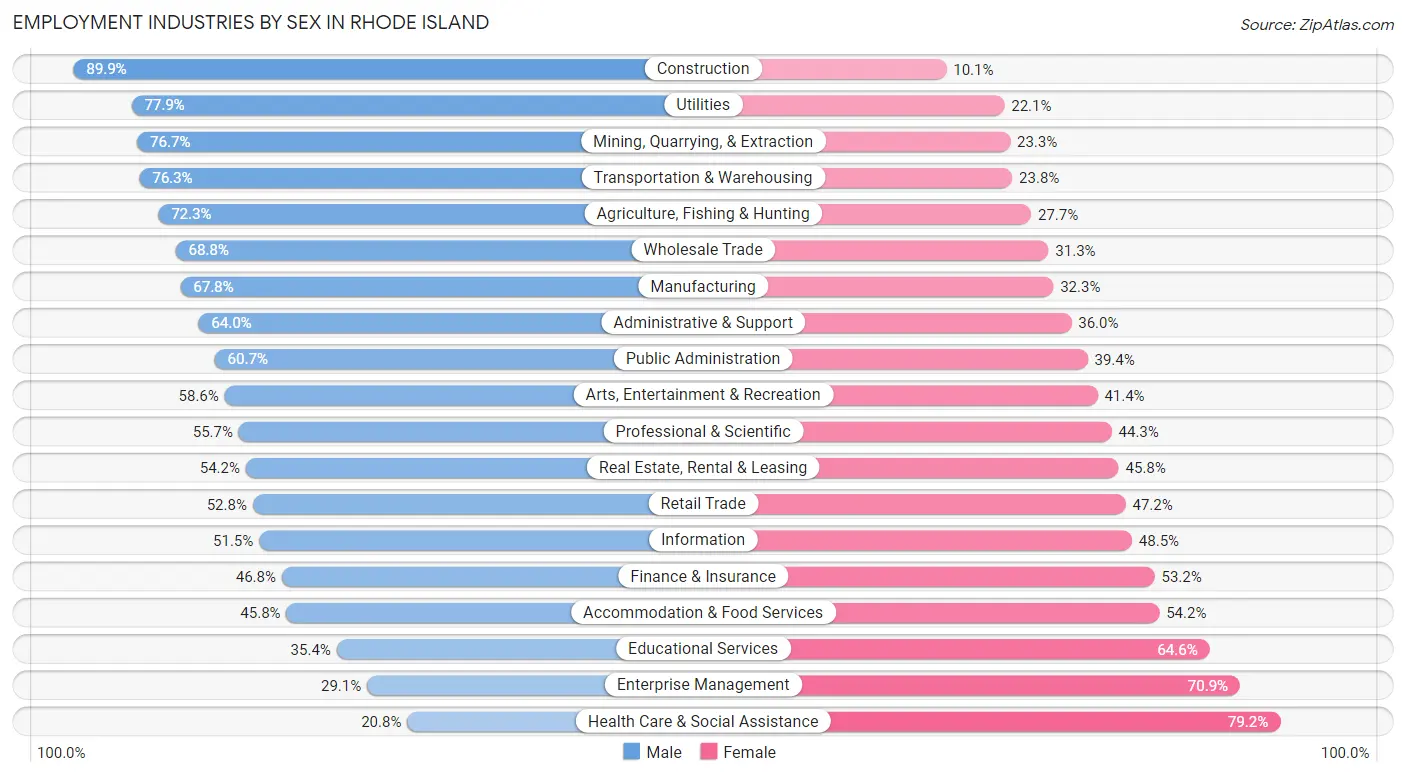
Employment Industries by Sex in Rhode Island
The Rhode Island industries that see more men than women are Construction (89.9%), Utilities (77.9%), and Mining, Quarrying, & Extraction (76.7%), whereas the industries that tend to have a higher number of women are Health Care & Social Assistance (79.2%), Enterprise Management (70.9%), and Educational Services (64.6%).
| Industry | Male | Female |
| Agriculture, Fishing & Hunting | 2,040 (72.3%) | 780 (27.7%) |
| Mining, Quarrying, & Extraction | 125 (76.7%) | 38 (23.3%) |
| Construction | 31,134 (89.9%) | 3,500 (10.1%) |
| Manufacturing | 40,565 (67.7%) | 19,312 (32.3%) |
| Wholesale Trade | 8,922 (68.8%) | 4,056 (31.2%) |
| Retail Trade | 32,534 (52.8%) | 29,101 (47.2%) |
| Transportation & Warehousing | 18,049 (76.2%) | 5,621 (23.7%) |
| Utilities | 2,063 (77.9%) | 586 (22.1%) |
| Information | 3,962 (51.5%) | 3,737 (48.5%) |
| Finance & Insurance | 13,945 (46.8%) | 15,871 (53.2%) |
| Real Estate, Rental & Leasing | 4,277 (54.2%) | 3,611 (45.8%) |
| Professional & Scientific | 21,813 (55.7%) | 17,370 (44.3%) |
| Enterprise Management | 329 (29.1%) | 801 (70.9%) |
| Administrative & Support | 13,894 (64.0%) | 7,810 (36.0%) |
| Educational Services | 21,428 (35.4%) | 39,093 (64.6%) |
| Health Care & Social Assistance | 18,339 (20.8%) | 69,838 (79.2%) |
| Arts, Entertainment & Recreation | 7,781 (58.6%) | 5,497 (41.4%) |
| Accommodation & Food Services | 17,792 (45.8%) | 21,050 (54.2%) |
| Public Administration | 14,306 (60.7%) | 9,283 (39.4%) |
| Total | 284,519 (51.3%) | 269,535 (48.6%) |
Education in Rhode Island
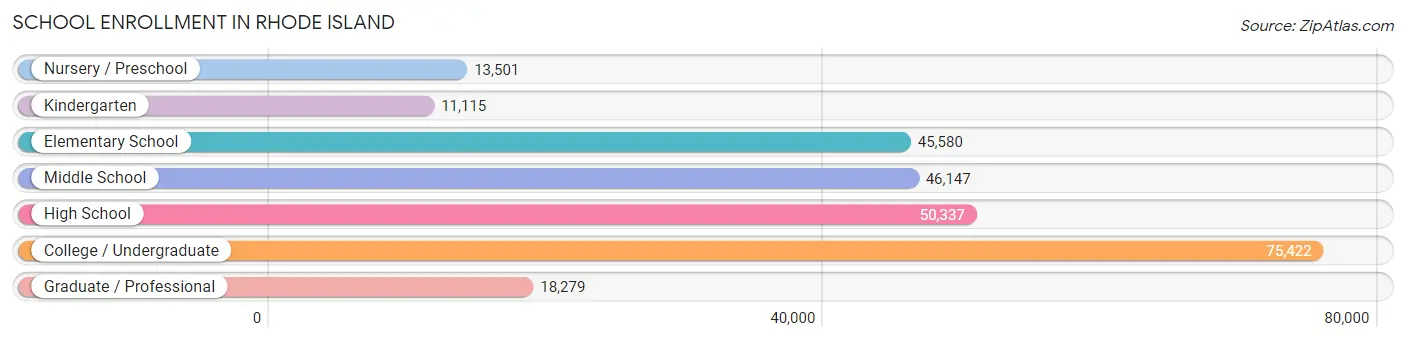
School Enrollment in Rhode Island
The most common levels of schooling among the 260,381 students in Rhode Island are college / undergraduate (75,422 | 29.0%), high school (50,337 | 19.3%), and middle school (46,147 | 17.7%).
| School Level | # Students | % Students |
| Nursery / Preschool | 13,501 | 5.2% |
| Kindergarten | 11,115 | 4.3% |
| Elementary School | 45,580 | 17.5% |
| Middle School | 46,147 | 17.7% |
| High School | 50,337 | 19.3% |
| College / Undergraduate | 75,422 | 29.0% |
| Graduate / Professional | 18,279 | 7.0% |
| Total | 260,381 | 100.0% |
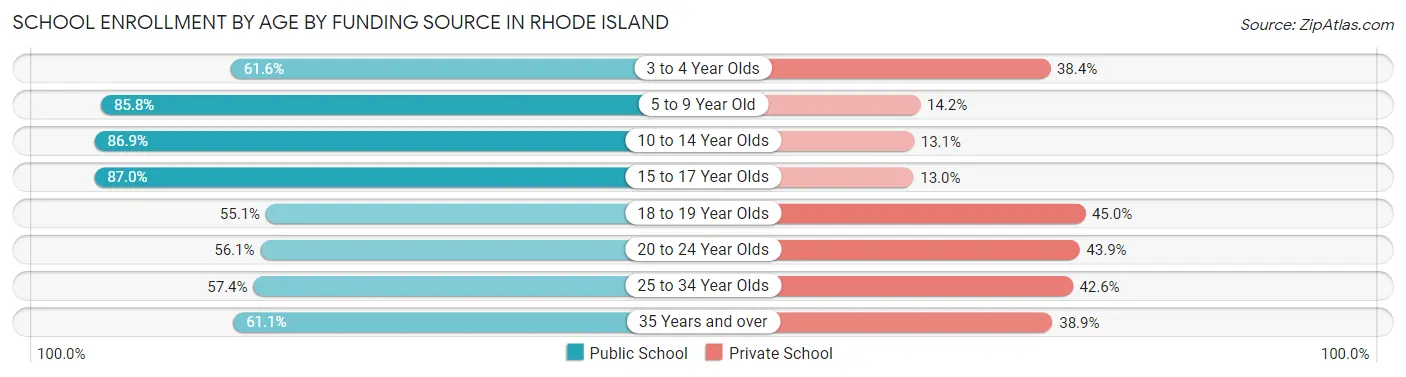
School Enrollment by Age by Funding Source in Rhode Island
Out of a total of 260,381 students who are enrolled in schools in Rhode Island, 68,220 (26.2%) attend a private institution, while the remaining 192,161 (73.8%) are enrolled in public schools. The age group of 18 to 19 year olds has the highest likelihood of being enrolled in private schools, with 13,828 (45.0% in the age bracket) enrolled. Conversely, the age group of 15 to 17 year olds has the lowest likelihood of being enrolled in a private school, with 31,967 (87.0% in the age bracket) attending a public institution.
| Age Bracket | Public School | Private School |
| 3 to 4 Year Olds | 6,634 (61.6%) | 4,141 (38.4%) |
| 5 to 9 Year Old | 45,173 (85.8%) | 7,494 (14.2%) |
| 10 to 14 Year Olds | 50,541 (86.9%) | 7,593 (13.1%) |
| 15 to 17 Year Olds | 31,967 (87.0%) | 4,765 (13.0%) |
| 18 to 19 Year Olds | 16,937 (55.0%) | 13,828 (45.0%) |
| 20 to 24 Year Olds | 22,691 (56.1%) | 17,766 (43.9%) |
| 25 to 34 Year Olds | 10,220 (57.4%) | 7,588 (42.6%) |
| 35 Years and over | 7,974 (61.1%) | 5,069 (38.9%) |
| Total | 192,161 (73.8%) | 68,220 (26.2%) |
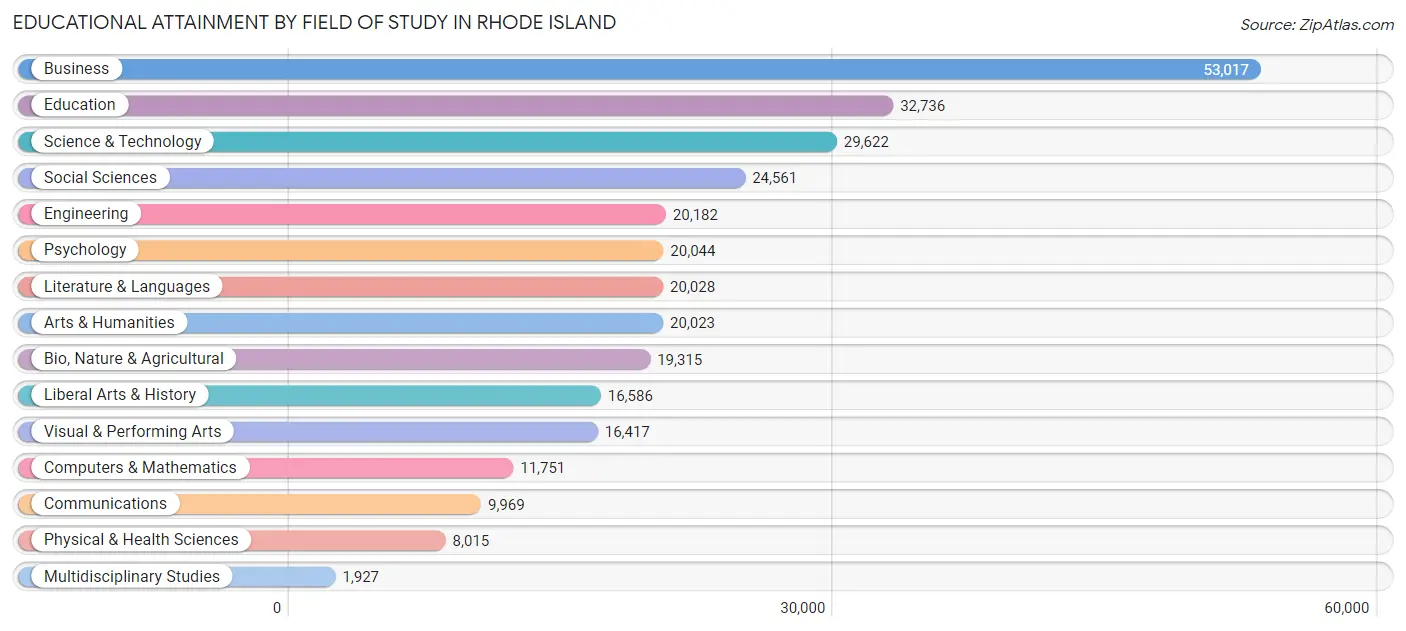
Educational Attainment by Field of Study in Rhode Island
Business (53,017 | 17.4%), education (32,736 | 10.8%), science & technology (29,622 | 9.7%), social sciences (24,561 | 8.1%), and engineering (20,182 | 6.6%) are the most common fields of study among 304,193 individuals in Rhode Island who have obtained a bachelor's degree or higher.
| Field of Study | # Graduates | % Graduates |
| Computers & Mathematics | 11,751 | 3.9% |
| Bio, Nature & Agricultural | 19,315 | 6.4% |
| Physical & Health Sciences | 8,015 | 2.6% |
| Psychology | 20,044 | 6.6% |
| Social Sciences | 24,561 | 8.1% |
| Engineering | 20,182 | 6.6% |
| Multidisciplinary Studies | 1,927 | 0.6% |
| Science & Technology | 29,622 | 9.7% |
| Business | 53,017 | 17.4% |
| Education | 32,736 | 10.8% |
| Literature & Languages | 20,028 | 6.6% |
| Liberal Arts & History | 16,586 | 5.4% |
| Visual & Performing Arts | 16,417 | 5.4% |
| Communications | 9,969 | 3.3% |
| Arts & Humanities | 20,023 | 6.6% |
| Total | 304,193 | 100.0% |
Transportation & Commute in Rhode Island
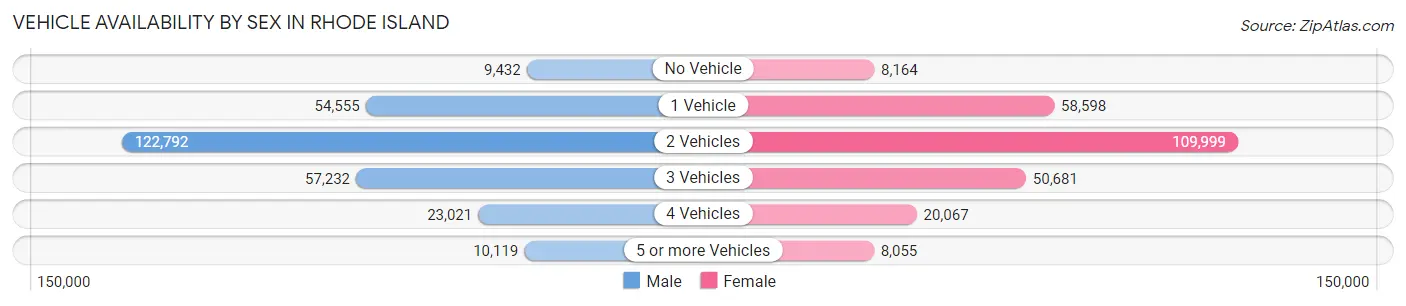
Vehicle Availability by Sex in Rhode Island
The most prevalent vehicle ownership categories in Rhode Island are males with 2 vehicles (122,792, accounting for 44.3%) and females with 2 vehicles (109,999, making up 48.0%).
| Vehicles Available | Male | Female |
| No Vehicle | 9,432 (3.4%) | 8,164 (3.2%) |
| 1 Vehicle | 54,555 (19.7%) | 58,598 (22.9%) |
| 2 Vehicles | 122,792 (44.3%) | 109,999 (43.0%) |
| 3 Vehicles | 57,232 (20.6%) | 50,681 (19.8%) |
| 4 Vehicles | 23,021 (8.3%) | 20,067 (7.9%) |
| 5 or more Vehicles | 10,119 (3.6%) | 8,055 (3.2%) |
| Total | 277,151 (100.0%) | 255,564 (100.0%) |
Commute Time in Rhode Island
The most frequently occuring commute durations in Rhode Island are 15 to 19 minutes (79,446 commuters, 16.2%), 20 to 24 minutes (79,233 commuters, 16.2%), and 10 to 14 minutes (72,080 commuters, 14.7%).
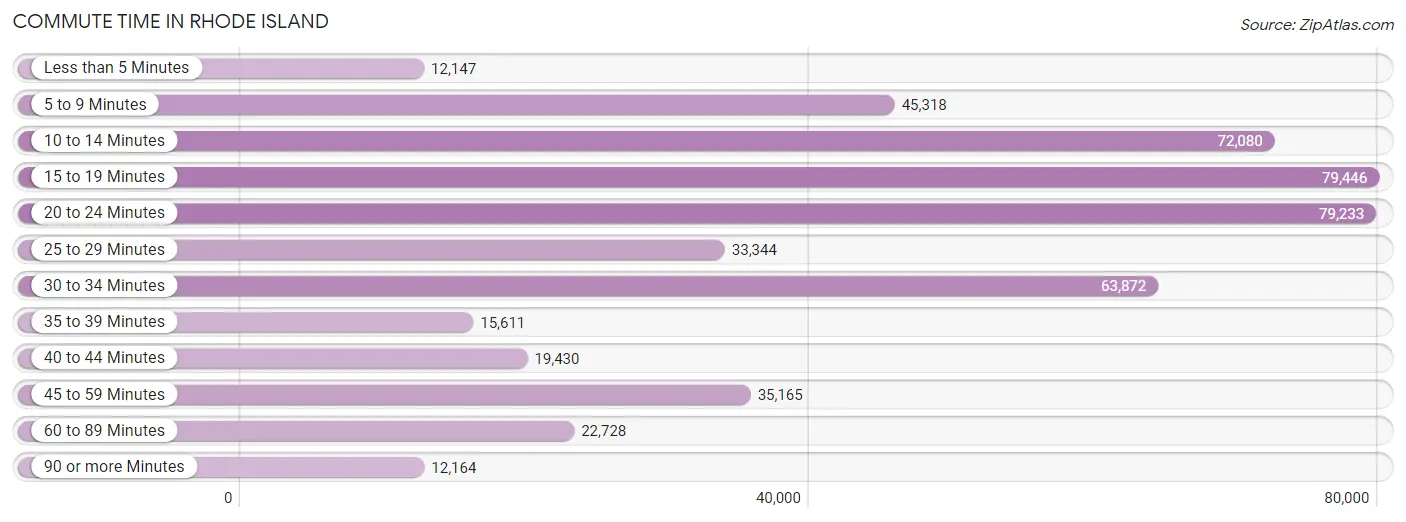
| Commute Time | # Commuters | % Commuters |
| Less than 5 Minutes | 12,147 | 2.5% |
| 5 to 9 Minutes | 45,318 | 9.2% |
| 10 to 14 Minutes | 72,080 | 14.7% |
| 15 to 19 Minutes | 79,446 | 16.2% |
| 20 to 24 Minutes | 79,233 | 16.2% |
| 25 to 29 Minutes | 33,344 | 6.8% |
| 30 to 34 Minutes | 63,872 | 13.0% |
| 35 to 39 Minutes | 15,611 | 3.2% |
| 40 to 44 Minutes | 19,430 | 4.0% |
| 45 to 59 Minutes | 35,165 | 7.2% |
| 60 to 89 Minutes | 22,728 | 4.6% |
| 90 or more Minutes | 12,164 | 2.5% |
Commute Time by Sex in Rhode Island
The most common commute times in Rhode Island are 20 to 24 minutes (39,333 commuters, 15.3%) for males and 15 to 19 minutes (41,790 commuters, 17.8%) for females.
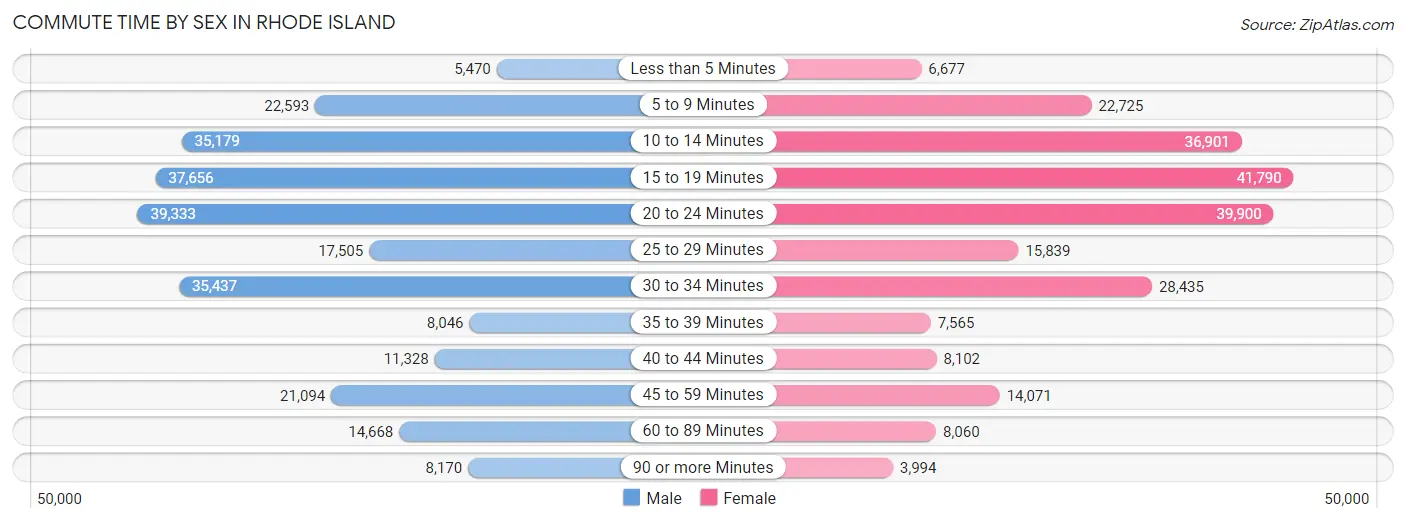
| Commute Time | Male | Female |
| Less than 5 Minutes | 5,470 (2.1%) | 6,677 (2.9%) |
| 5 to 9 Minutes | 22,593 (8.8%) | 22,725 (9.7%) |
| 10 to 14 Minutes | 35,179 (13.7%) | 36,901 (15.8%) |
| 15 to 19 Minutes | 37,656 (14.7%) | 41,790 (17.8%) |
| 20 to 24 Minutes | 39,333 (15.3%) | 39,900 (17.1%) |
| 25 to 29 Minutes | 17,505 (6.8%) | 15,839 (6.8%) |
| 30 to 34 Minutes | 35,437 (13.8%) | 28,435 (12.1%) |
| 35 to 39 Minutes | 8,046 (3.1%) | 7,565 (3.2%) |
| 40 to 44 Minutes | 11,328 (4.4%) | 8,102 (3.5%) |
| 45 to 59 Minutes | 21,094 (8.2%) | 14,071 (6.0%) |
| 60 to 89 Minutes | 14,668 (5.7%) | 8,060 (3.4%) |
| 90 or more Minutes | 8,170 (3.2%) | 3,994 (1.7%) |
Time of Departure to Work by Sex in Rhode Island
The most frequent times of departure to work in Rhode Island are 7:00 AM to 7:29 AM (39,084, 15.2%) for males and 8:00 AM to 8:29 AM (36,049, 15.4%) for females.
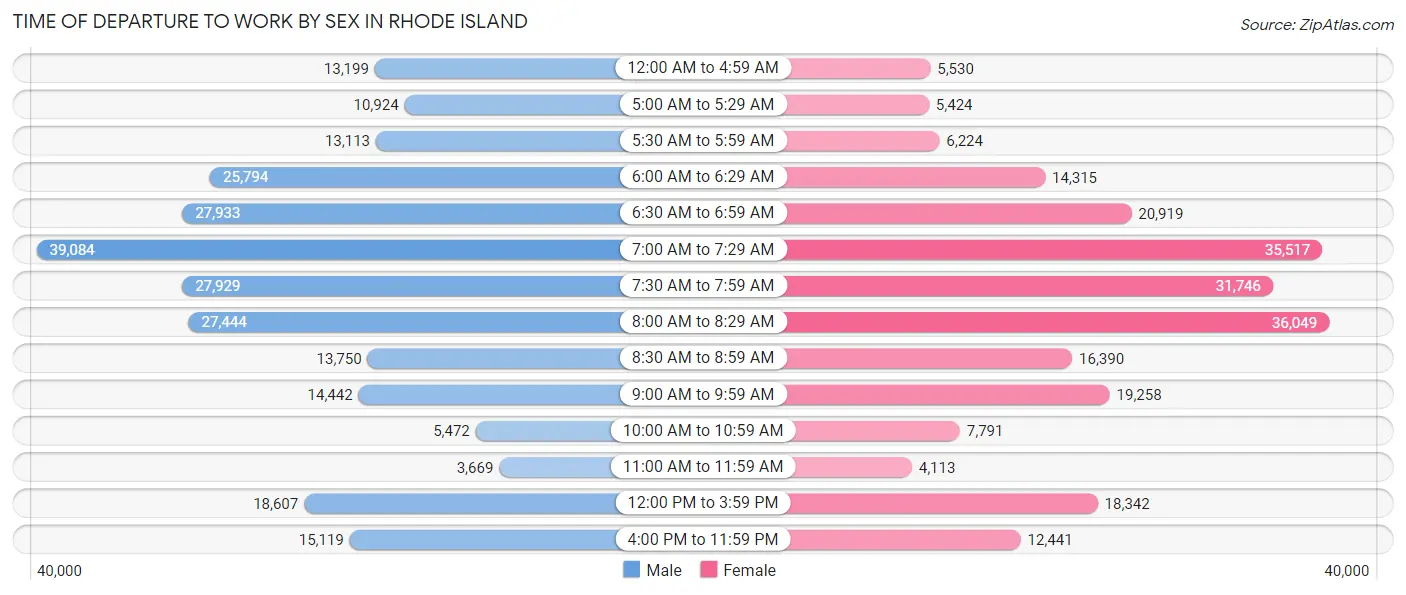
| Time of Departure | Male | Female |
| 12:00 AM to 4:59 AM | 13,199 (5.1%) | 5,530 (2.4%) |
| 5:00 AM to 5:29 AM | 10,924 (4.3%) | 5,424 (2.3%) |
| 5:30 AM to 5:59 AM | 13,113 (5.1%) | 6,224 (2.7%) |
| 6:00 AM to 6:29 AM | 25,794 (10.1%) | 14,315 (6.1%) |
| 6:30 AM to 6:59 AM | 27,933 (10.9%) | 20,919 (8.9%) |
| 7:00 AM to 7:29 AM | 39,084 (15.2%) | 35,517 (15.2%) |
| 7:30 AM to 7:59 AM | 27,929 (10.9%) | 31,746 (13.6%) |
| 8:00 AM to 8:29 AM | 27,444 (10.7%) | 36,049 (15.4%) |
| 8:30 AM to 8:59 AM | 13,750 (5.4%) | 16,390 (7.0%) |
| 9:00 AM to 9:59 AM | 14,442 (5.6%) | 19,258 (8.2%) |
| 10:00 AM to 10:59 AM | 5,472 (2.1%) | 7,791 (3.3%) |
| 11:00 AM to 11:59 AM | 3,669 (1.4%) | 4,113 (1.8%) |
| 12:00 PM to 3:59 PM | 18,607 (7.2%) | 18,342 (7.8%) |
| 4:00 PM to 11:59 PM | 15,119 (5.9%) | 12,441 (5.3%) |
| Total | 256,479 (100.0%) | 234,059 (100.0%) |
Housing Occupancy in Rhode Island
Occupancy by Ownership in Rhode Island
Of the total 432,219 dwellings in Rhode Island, owner-occupied units account for 270,950 (62.7%), while renter-occupied units make up 161,269 (37.3%).
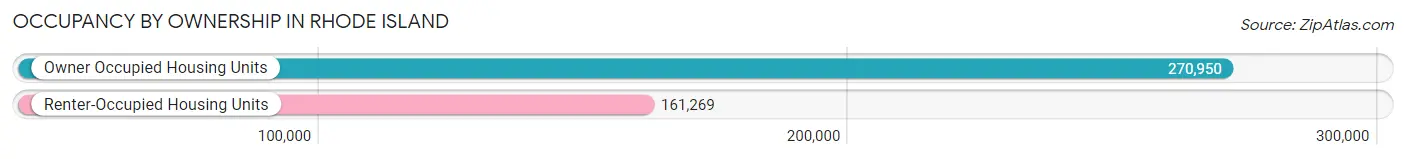
| Occupancy | # Housing Units | % Housing Units |
| Owner Occupied Housing Units | 270,950 | 62.7% |
| Renter-Occupied Housing Units | 161,269 | 37.3% |
| Total Occupied Housing Units | 432,219 | 100.0% |
Occupancy by Household Size in Rhode Island
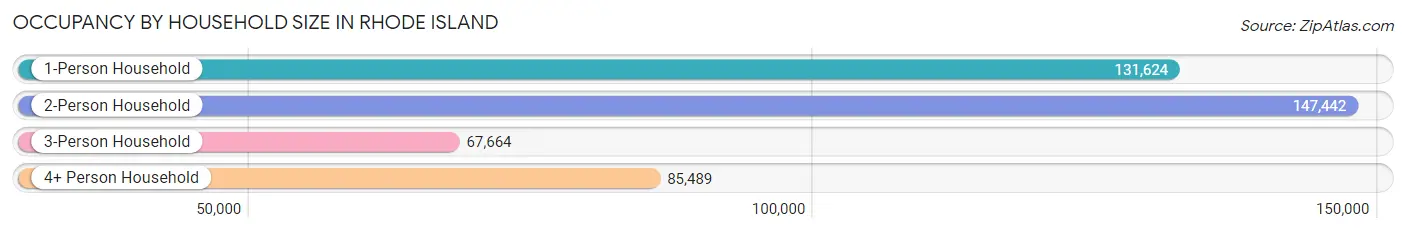
| Household Size | # Housing Units | % Housing Units |
| 1-Person Household | 131,624 | 30.4% |
| 2-Person Household | 147,442 | 34.1% |
| 3-Person Household | 67,664 | 15.7% |
| 4+ Person Household | 85,489 | 19.8% |
| Total Housing Units | 432,219 | 100.0% |
Occupancy by Ownership by Household Size in Rhode Island
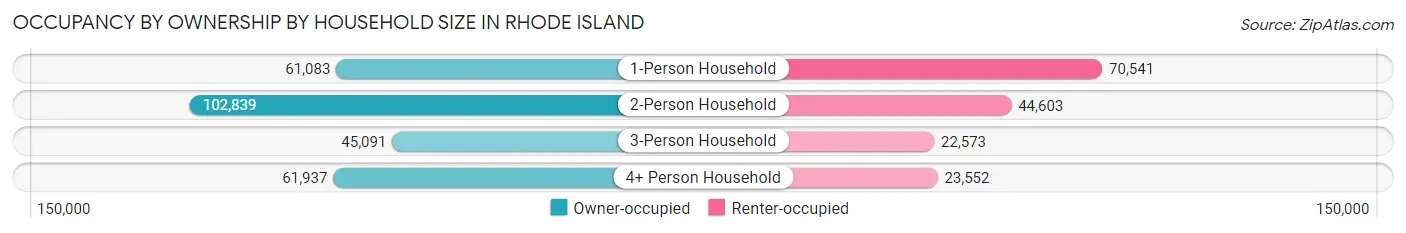
| Household Size | Owner-occupied | Renter-occupied |
| 1-Person Household | 61,083 (46.4%) | 70,541 (53.6%) |
| 2-Person Household | 102,839 (69.8%) | 44,603 (30.2%) |
| 3-Person Household | 45,091 (66.6%) | 22,573 (33.4%) |
| 4+ Person Household | 61,937 (72.5%) | 23,552 (27.6%) |
| Total Housing Units | 270,950 (62.7%) | 161,269 (37.3%) |
Occupancy by Educational Attainment in Rhode Island
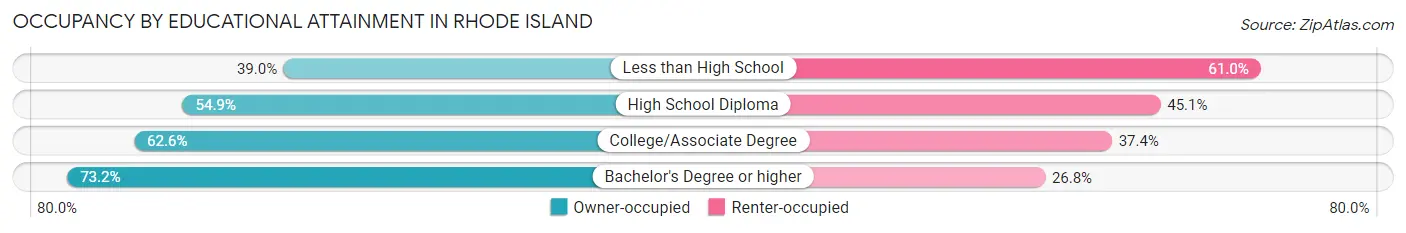
| Household Size | Owner-occupied | Renter-occupied |
| Less than High School | 15,754 (39.0%) | 24,625 (61.0%) |
| High School Diploma | 58,104 (54.9%) | 47,672 (45.1%) |
| College/Associate Degree | 73,274 (62.6%) | 43,702 (37.4%) |
| Bachelor's Degree or higher | 123,818 (73.2%) | 45,270 (26.8%) |
Occupancy by Age of Householder in Rhode Island
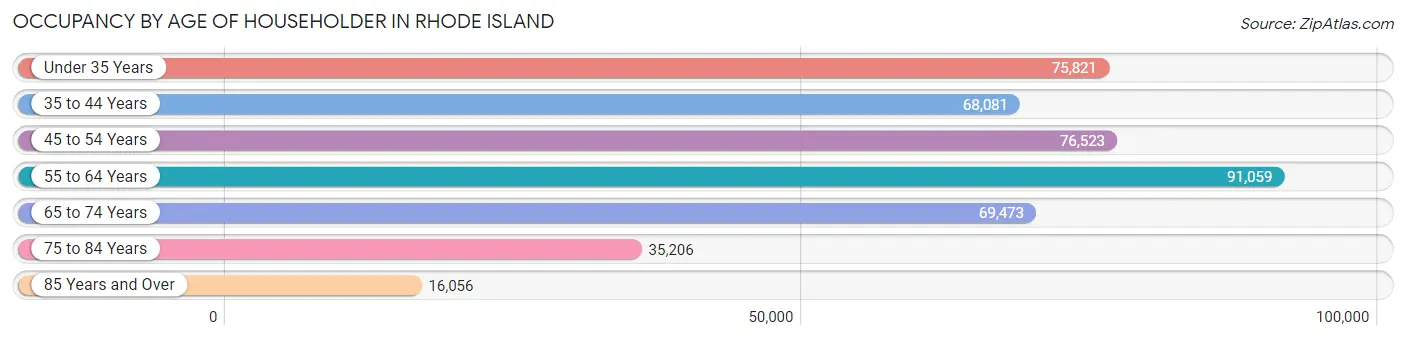
| Age Bracket | # Households | % Households |
| Under 35 Years | 75,821 | 17.5% |
| 35 to 44 Years | 68,081 | 15.8% |
| 45 to 54 Years | 76,523 | 17.7% |
| 55 to 64 Years | 91,059 | 21.1% |
| 65 to 74 Years | 69,473 | 16.1% |
| 75 to 84 Years | 35,206 | 8.2% |
| 85 Years and Over | 16,056 | 3.7% |
| Total | 432,219 | 100.0% |
Housing Finances in Rhode Island
Median Income by Occupancy in Rhode Island
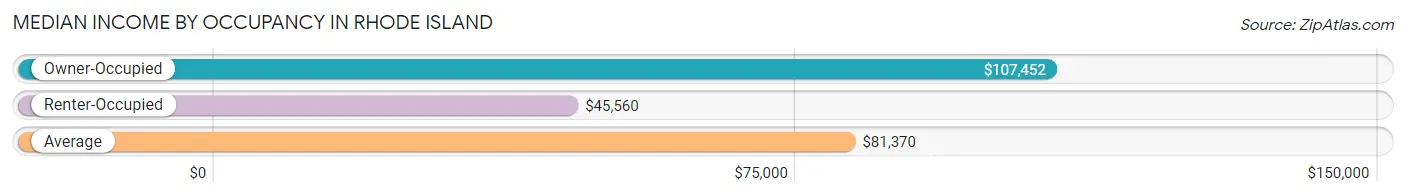
| Occupancy Type | # Households | Median Income |
| Owner-Occupied | 270,950 (62.7%) | $107,452 |
| Renter-Occupied | 161,269 (37.3%) | $45,560 |
| Average | 432,219 (100.0%) | $81,370 |
Occupancy by Householder Income Bracket in Rhode Island
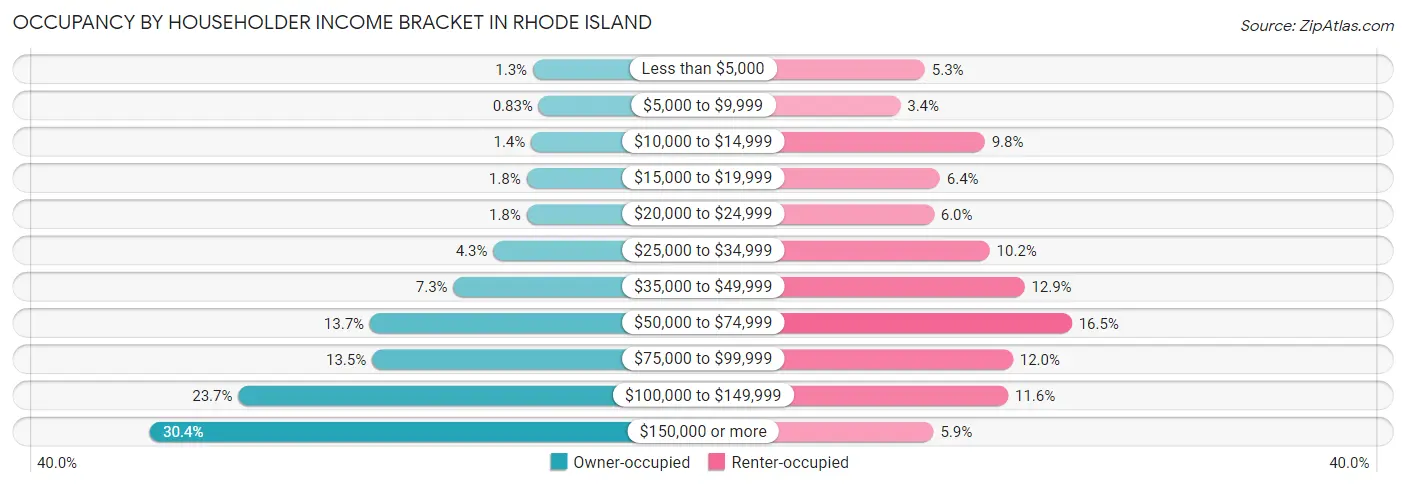
| Income Bracket | Owner-occupied | Renter-occupied |
| Less than $5,000 | 3,435 (1.3%) | 8,513 (5.3%) |
| $5,000 to $9,999 | 2,236 (0.8%) | 5,498 (3.4%) |
| $10,000 to $14,999 | 3,831 (1.4%) | 15,865 (9.8%) |
| $15,000 to $19,999 | 4,770 (1.8%) | 10,355 (6.4%) |
| $20,000 to $24,999 | 4,747 (1.8%) | 9,607 (6.0%) |
| $25,000 to $34,999 | 11,613 (4.3%) | 16,476 (10.2%) |
| $35,000 to $49,999 | 19,855 (7.3%) | 20,762 (12.9%) |
| $50,000 to $74,999 | 37,082 (13.7%) | 26,555 (16.5%) |
| $75,000 to $99,999 | 36,655 (13.5%) | 19,319 (12.0%) |
| $100,000 to $149,999 | 64,259 (23.7%) | 18,737 (11.6%) |
| $150,000 or more | 82,467 (30.4%) | 9,582 (5.9%) |
| Total | 270,950 (100.0%) | 161,269 (100.0%) |
Monthly Housing Cost Tiers in Rhode Island
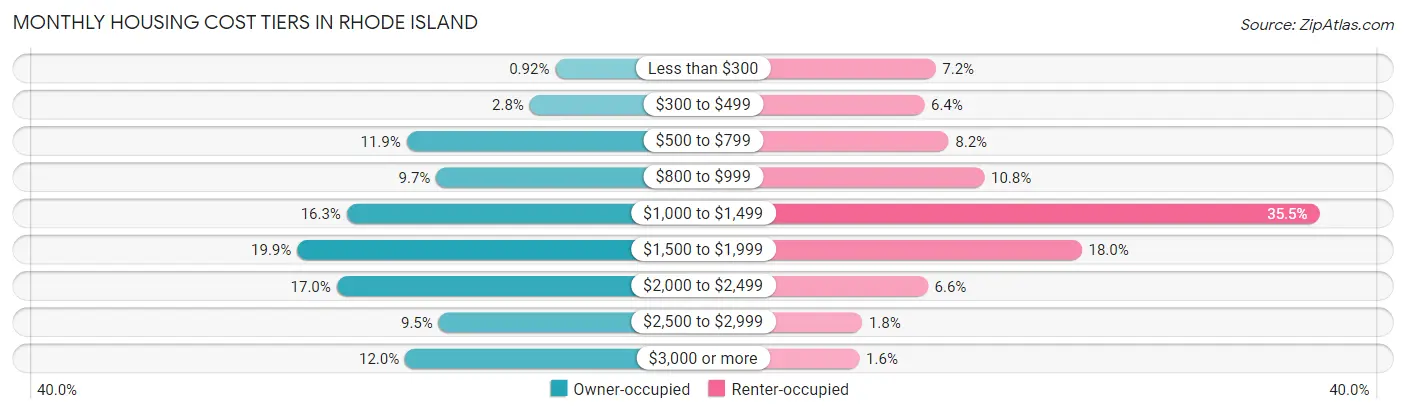
| Monthly Cost | Owner-occupied | Renter-occupied |
| Less than $300 | 2,505 (0.9%) | 11,633 (7.2%) |
| $300 to $499 | 7,577 (2.8%) | 10,283 (6.4%) |
| $500 to $799 | 32,170 (11.9%) | 13,181 (8.2%) |
| $800 to $999 | 26,248 (9.7%) | 17,414 (10.8%) |
| $1,000 to $1,499 | 44,116 (16.3%) | 57,236 (35.5%) |
| $1,500 to $1,999 | 53,988 (19.9%) | 28,995 (18.0%) |
| $2,000 to $2,499 | 46,119 (17.0%) | 10,709 (6.6%) |
| $2,500 to $2,999 | 25,758 (9.5%) | 2,916 (1.8%) |
| $3,000 or more | 32,469 (12.0%) | 2,582 (1.6%) |
| Total | 270,950 (100.0%) | 161,269 (100.0%) |
Physical Housing Characteristics in Rhode Island
Housing Structures in Rhode Island
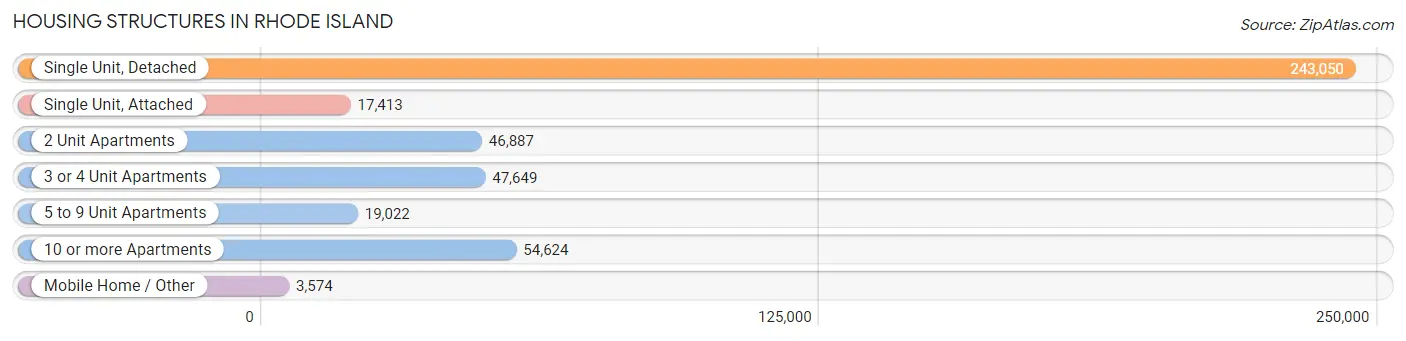
| Structure Type | # Housing Units | % Housing Units |
| Single Unit, Detached | 243,050 | 56.2% |
| Single Unit, Attached | 17,413 | 4.0% |
| 2 Unit Apartments | 46,887 | 10.8% |
| 3 or 4 Unit Apartments | 47,649 | 11.0% |
| 5 to 9 Unit Apartments | 19,022 | 4.4% |
| 10 or more Apartments | 54,624 | 12.6% |
| Mobile Home / Other | 3,574 | 0.8% |
| Total | 432,219 | 100.0% |
Housing Structures by Occupancy in Rhode Island
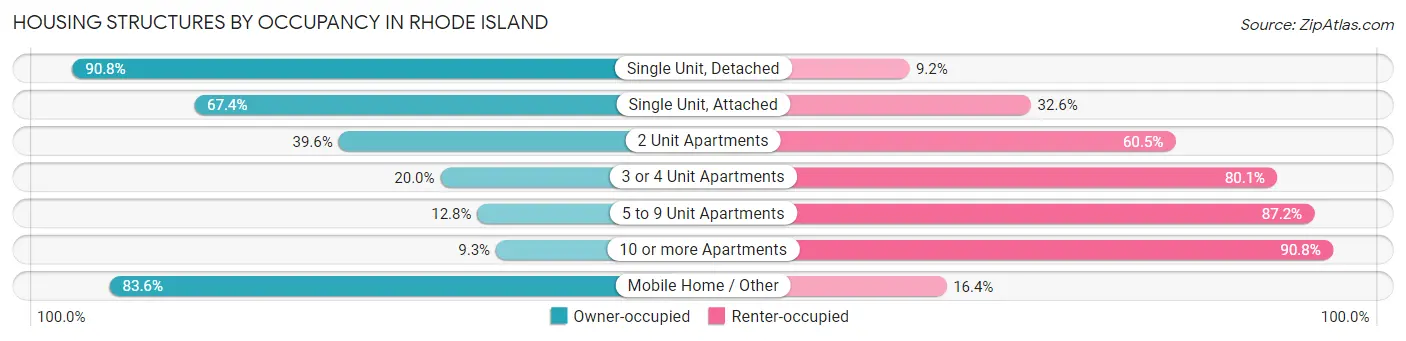
| Structure Type | Owner-occupied | Renter-occupied |
| Single Unit, Detached | 220,681 (90.8%) | 22,369 (9.2%) |
| Single Unit, Attached | 11,731 (67.4%) | 5,682 (32.6%) |
| 2 Unit Apartments | 18,544 (39.6%) | 28,343 (60.5%) |
| 3 or 4 Unit Apartments | 9,508 (20.0%) | 38,141 (80.0%) |
| 5 to 9 Unit Apartments | 2,443 (12.8%) | 16,579 (87.2%) |
| 10 or more Apartments | 5,054 (9.2%) | 49,570 (90.7%) |
| Mobile Home / Other | 2,989 (83.6%) | 585 (16.4%) |
| Total | 270,950 (62.7%) | 161,269 (37.3%) |
Housing Structures by Number of Rooms in Rhode Island
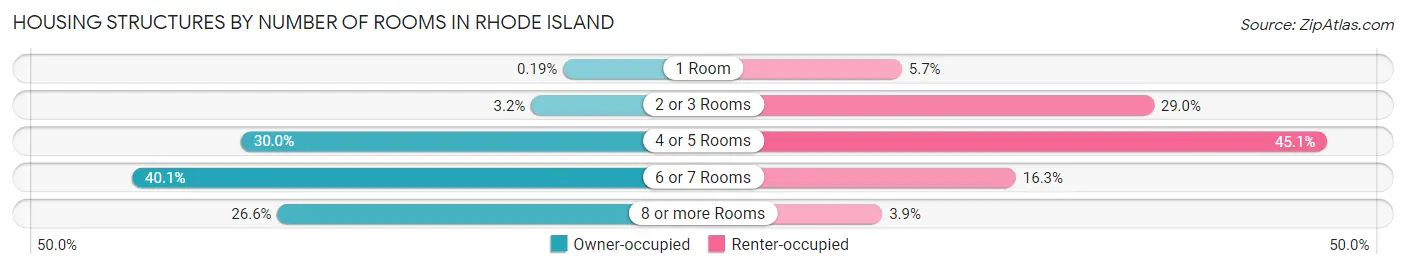
| Number of Rooms | Owner-occupied | Renter-occupied |
| 1 Room | 509 (0.2%) | 9,235 (5.7%) |
| 2 or 3 Rooms | 8,531 (3.2%) | 46,821 (29.0%) |
| 4 or 5 Rooms | 81,272 (30.0%) | 72,662 (45.1%) |
| 6 or 7 Rooms | 108,519 (40.1%) | 26,246 (16.3%) |
| 8 or more Rooms | 72,119 (26.6%) | 6,305 (3.9%) |
| Total | 270,950 (100.0%) | 161,269 (100.0%) |
Housing Structure by Heating Type in Rhode Island
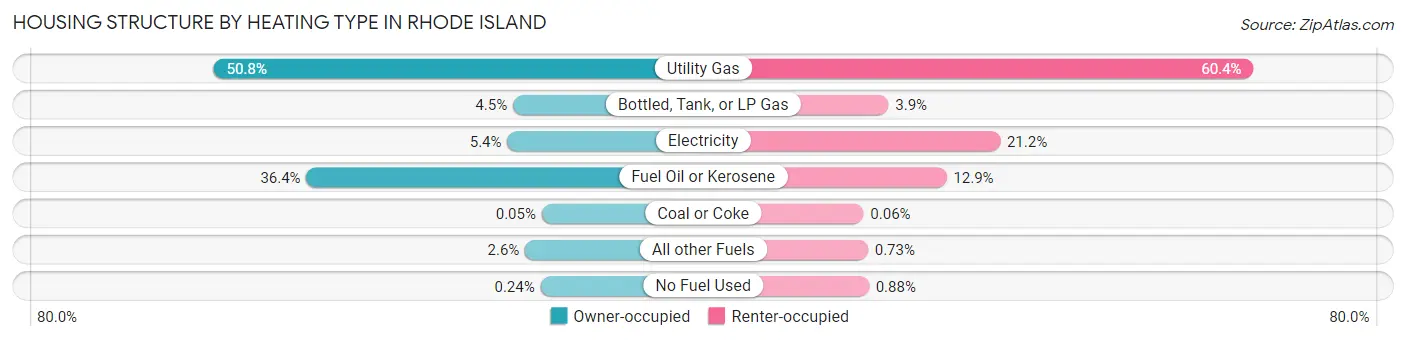
| Heating Type | Owner-occupied | Renter-occupied |
| Utility Gas | 137,594 (50.8%) | 97,332 (60.4%) |
| Bottled, Tank, or LP Gas | 12,198 (4.5%) | 6,313 (3.9%) |
| Electricity | 14,555 (5.4%) | 34,147 (21.2%) |
| Fuel Oil or Kerosene | 98,699 (36.4%) | 20,790 (12.9%) |
| Coal or Coke | 137 (0.1%) | 92 (0.1%) |
| All other Fuels | 7,108 (2.6%) | 1,170 (0.7%) |
| No Fuel Used | 659 (0.2%) | 1,425 (0.9%) |
| Total | 270,950 (100.0%) | 161,269 (100.0%) |
Household Vehicle Usage in Rhode Island
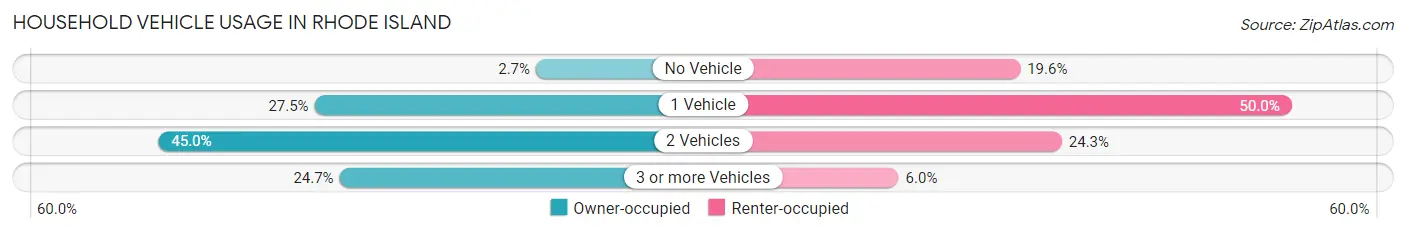
| Vehicles per Household | Owner-occupied | Renter-occupied |
| No Vehicle | 7,404 (2.7%) | 31,675 (19.6%) |
| 1 Vehicle | 74,584 (27.5%) | 80,683 (50.0%) |
| 2 Vehicles | 121,948 (45.0%) | 39,195 (24.3%) |
| 3 or more Vehicles | 67,014 (24.7%) | 9,716 (6.0%) |
| Total | 270,950 (100.0%) | 161,269 (100.0%) |
Real Estate & Mortgages in Rhode Island
Real Estate and Mortgage Overview in Rhode Island
| Characteristic | Without Mortgage | With Mortgage |
| Housing Units | 88,026 | 182,924 |
| Median Property Value | $339,000 | $344,900 |
| Median Household Income | $81,349 | $62,721 |
| Monthly Housing Costs | $842 | $31,738 |
| Real Estate Taxes | $4,680 | $2,053 |
Property Value by Mortgage Status in Rhode Island
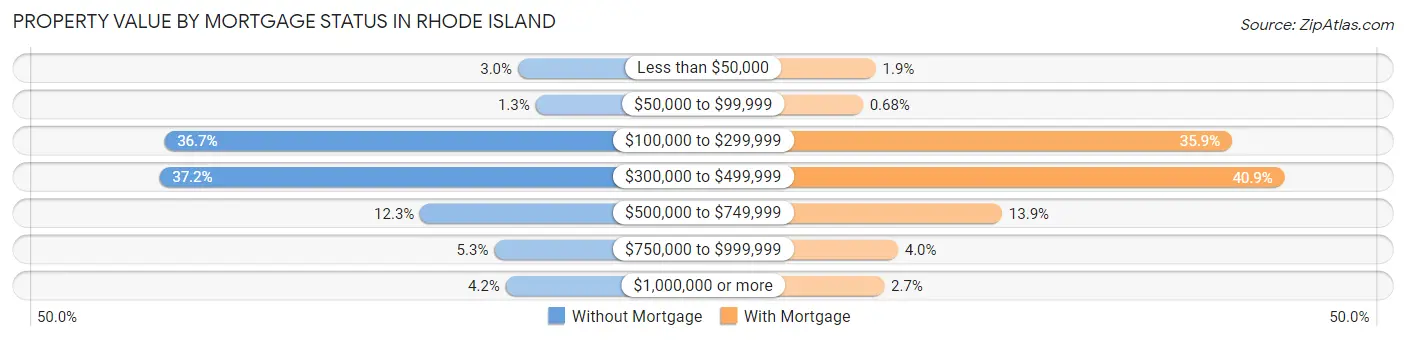
| Property Value | Without Mortgage | With Mortgage |
| Less than $50,000 | 2,654 (3.0%) | 3,489 (1.9%) |
| $50,000 to $99,999 | 1,177 (1.3%) | 1,248 (0.7%) |
| $100,000 to $299,999 | 32,303 (36.7%) | 65,590 (35.9%) |
| $300,000 to $499,999 | 32,723 (37.2%) | 74,760 (40.9%) |
| $500,000 to $749,999 | 10,858 (12.3%) | 25,497 (13.9%) |
| $750,000 to $999,999 | 4,635 (5.3%) | 7,360 (4.0%) |
| $1,000,000 or more | 3,676 (4.2%) | 4,980 (2.7%) |
| Total | 88,026 (100.0%) | 182,924 (100.0%) |
Household Income by Mortgage Status in Rhode Island
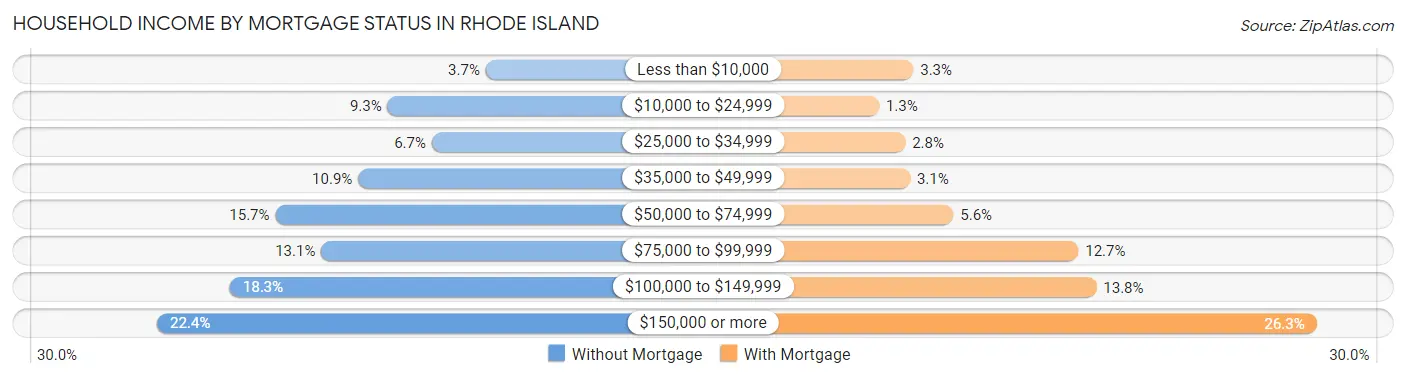
| Household Income | Without Mortgage | With Mortgage |
| Less than $10,000 | 3,217 (3.6%) | 6,035 (3.3%) |
| $10,000 to $24,999 | 8,147 (9.3%) | 2,454 (1.3%) |
| $25,000 to $34,999 | 5,924 (6.7%) | 5,201 (2.8%) |
| $35,000 to $49,999 | 9,634 (10.9%) | 5,689 (3.1%) |
| $50,000 to $74,999 | 13,792 (15.7%) | 10,221 (5.6%) |
| $75,000 to $99,999 | 11,484 (13.1%) | 23,290 (12.7%) |
| $100,000 to $149,999 | 16,082 (18.3%) | 25,171 (13.8%) |
| $150,000 or more | 19,746 (22.4%) | 48,177 (26.3%) |
| Total | 88,026 (100.0%) | 182,924 (100.0%) |
Property Value to Household Income Ratio in Rhode Island
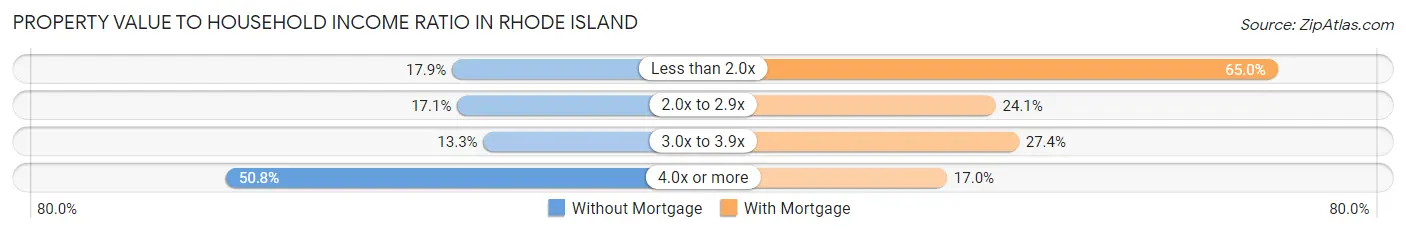
| Value-to-Income Ratio | Without Mortgage | With Mortgage |
| Less than 2.0x | 15,757 (17.9%) | 118,980 (65.0%) |
| 2.0x to 2.9x | 15,090 (17.1%) | 44,019 (24.1%) |
| 3.0x to 3.9x | 11,746 (13.3%) | 50,199 (27.4%) |
| 4.0x or more | 44,674 (50.7%) | 31,106 (17.0%) |
| Total | 88,026 (100.0%) | 182,924 (100.0%) |
Real Estate Taxes by Mortgage Status in Rhode Island
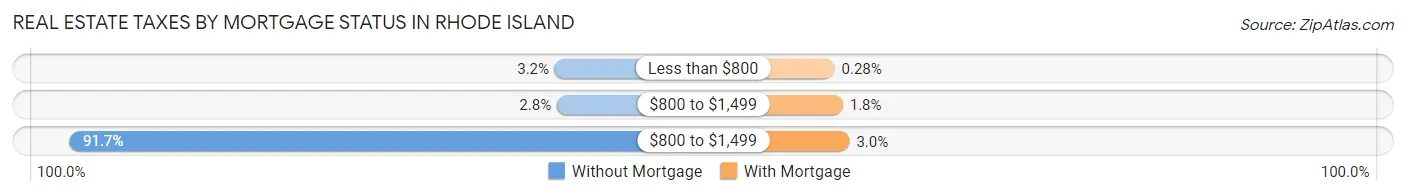
| Property Taxes | Without Mortgage | With Mortgage |
| Less than $800 | 2,777 (3.2%) | 513 (0.3%) |
| $800 to $1,499 | 2,432 (2.8%) | 3,251 (1.8%) |
| $800 to $1,499 | 80,708 (91.7%) | 5,491 (3.0%) |
| Total | 88,026 (100.0%) | 182,924 (100.0%) |
Health & Disability in Rhode Island
Health Insurance Coverage by Age in Rhode Island
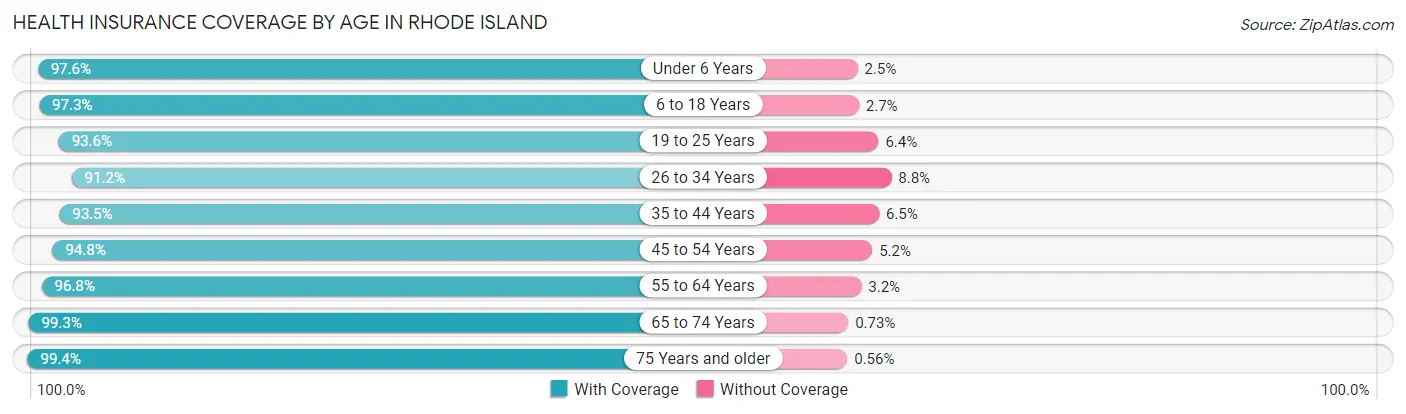
| Age Bracket | With Coverage | Without Coverage |
| Under 6 Years | 64,029 (97.6%) | 1,607 (2.5%) |
| 6 to 18 Years | 155,488 (97.3%) | 4,342 (2.7%) |
| 19 to 25 Years | 102,982 (93.6%) | 7,008 (6.4%) |
| 26 to 34 Years | 122,865 (91.2%) | 11,812 (8.8%) |
| 35 to 44 Years | 122,577 (93.5%) | 8,491 (6.5%) |
| 45 to 54 Years | 129,041 (94.8%) | 7,098 (5.2%) |
| 55 to 64 Years | 147,634 (96.8%) | 4,851 (3.2%) |
| 65 to 74 Years | 110,150 (99.3%) | 806 (0.7%) |
| 75 Years and older | 76,340 (99.4%) | 430 (0.6%) |
| Total | 1,031,106 (95.7%) | 46,445 (4.3%) |
Health Insurance Coverage by Citizenship Status in Rhode Island
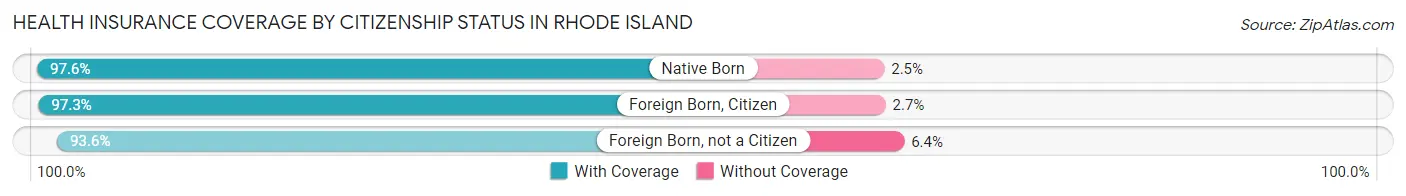
| Citizenship Status | With Coverage | Without Coverage |
| Native Born | 64,029 (97.6%) | 1,607 (2.5%) |
| Foreign Born, Citizen | 155,488 (97.3%) | 4,342 (2.7%) |
| Foreign Born, not a Citizen | 102,982 (93.6%) | 7,008 (6.4%) |
Health Insurance Coverage by Household Income in Rhode Island
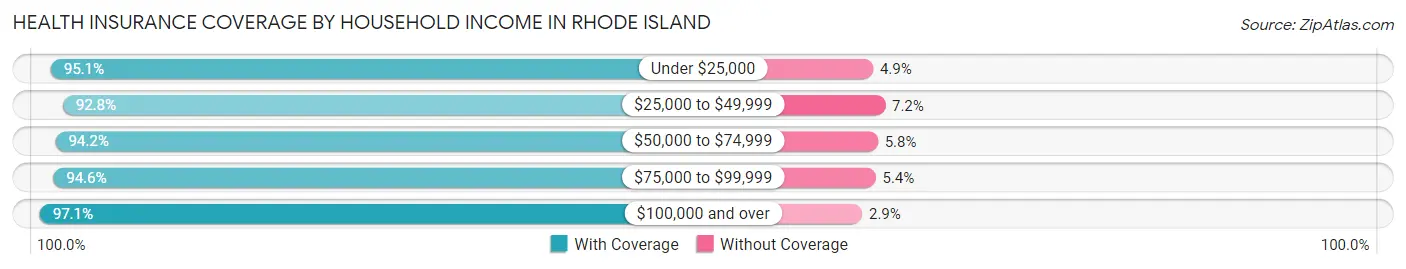
| Household Income | With Coverage | Without Coverage |
| Under $25,000 | 101,995 (95.1%) | 5,266 (4.9%) |
| $25,000 to $49,999 | 123,759 (92.8%) | 9,549 (7.2%) |
| $50,000 to $74,999 | 136,989 (94.2%) | 8,423 (5.8%) |
| $75,000 to $99,999 | 132,420 (94.6%) | 7,539 (5.4%) |
| $100,000 and over | 505,545 (97.1%) | 14,873 (2.9%) |
Public vs Private Health Insurance Coverage by Age in Rhode Island
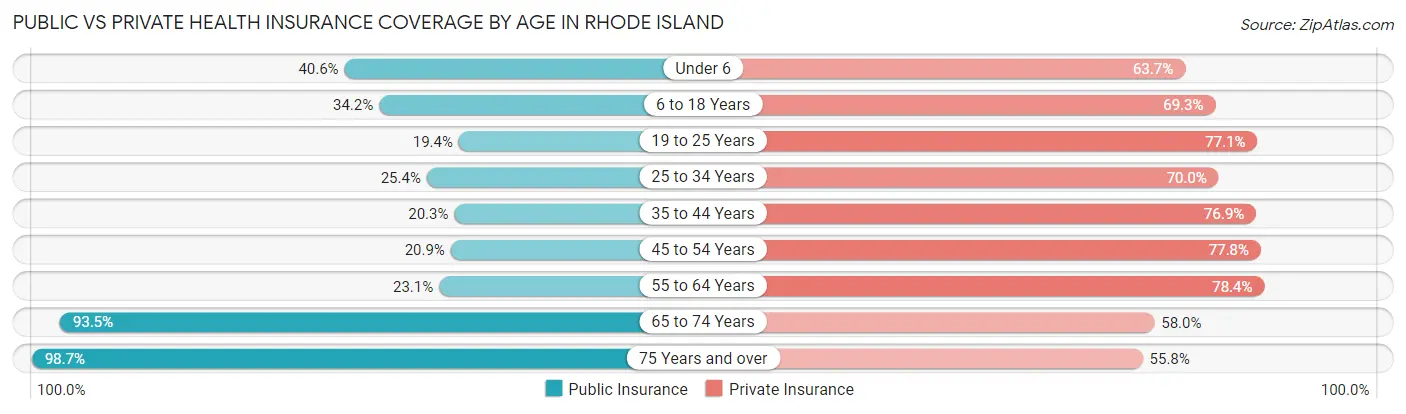
| Age Bracket | Public Insurance | Private Insurance |
| Under 6 | 26,670 (40.6%) | 41,801 (63.7%) |
| 6 to 18 Years | 54,676 (34.2%) | 110,806 (69.3%) |
| 19 to 25 Years | 21,342 (19.4%) | 84,843 (77.1%) |
| 25 to 34 Years | 34,156 (25.4%) | 94,208 (70.0%) |
| 35 to 44 Years | 26,546 (20.3%) | 100,797 (76.9%) |
| 45 to 54 Years | 28,467 (20.9%) | 105,887 (77.8%) |
| 55 to 64 Years | 35,183 (23.1%) | 119,569 (78.4%) |
| 65 to 74 Years | 103,684 (93.4%) | 64,351 (58.0%) |
| 75 Years and over | 75,753 (98.7%) | 42,859 (55.8%) |
| Total | 406,477 (37.7%) | 765,121 (71.0%) |
Disability Status by Sex by Age in Rhode Island
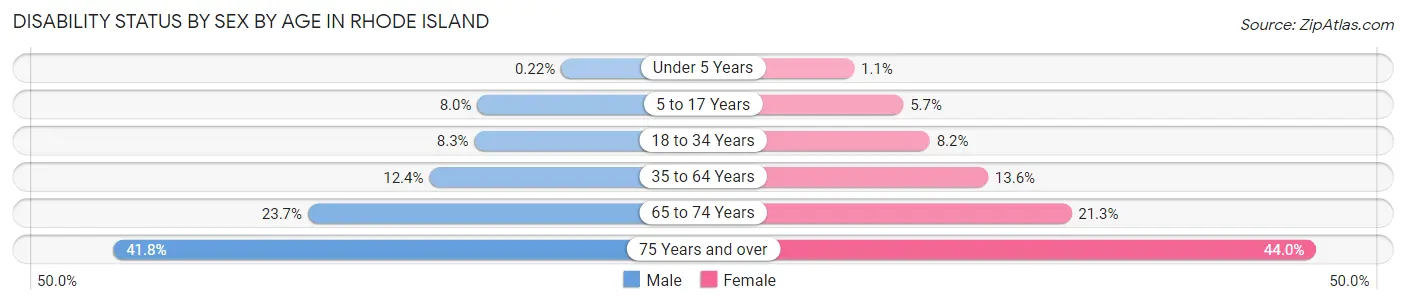
| Age Bracket | Male | Female |
| Under 5 Years | 61 (0.2%) | 304 (1.1%) |
| 5 to 17 Years | 6,331 (8.0%) | 4,257 (5.7%) |
| 18 to 34 Years | 10,816 (8.3%) | 10,672 (8.2%) |
| 35 to 64 Years | 25,714 (12.4%) | 28,870 (13.6%) |
| 65 to 74 Years | 12,422 (23.7%) | 12,472 (21.3%) |
| 75 Years and over | 12,643 (41.8%) | 20,469 (44.0%) |
Disability Class by Sex by Age in Rhode Island
Disability Class: Hearing Difficulty
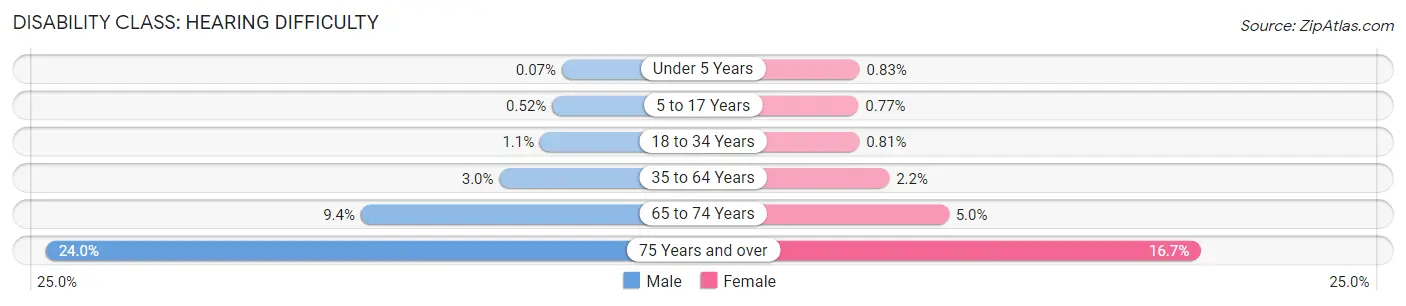
| Age Bracket | Male | Female |
| Under 5 Years | 20 (0.1%) | 220 (0.8%) |
| 5 to 17 Years | 414 (0.5%) | 579 (0.8%) |
| 18 to 34 Years | 1,411 (1.1%) | 1,061 (0.8%) |
| 35 to 64 Years | 6,135 (3.0%) | 4,679 (2.2%) |
| 65 to 74 Years | 4,924 (9.4%) | 2,902 (5.0%) |
| 75 Years and over | 7,269 (24.0%) | 7,752 (16.7%) |
Disability Class: Vision Difficulty
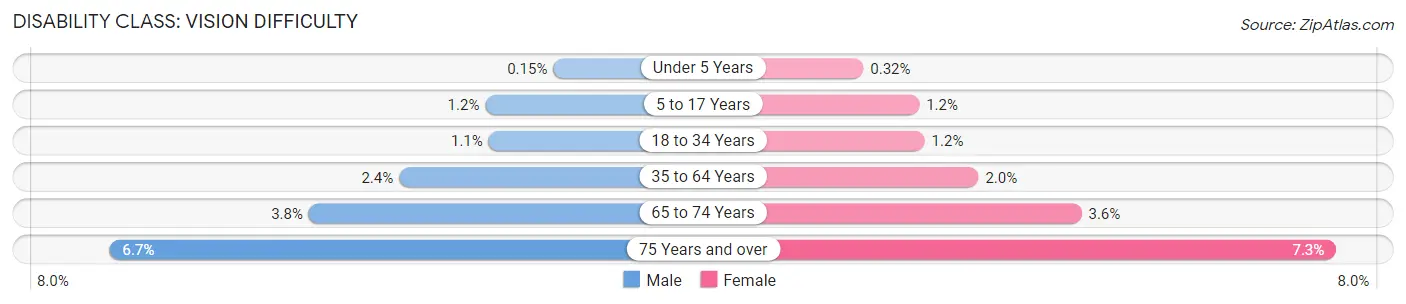
| Age Bracket | Male | Female |
| Under 5 Years | 41 (0.2%) | 84 (0.3%) |
| 5 to 17 Years | 917 (1.2%) | 862 (1.1%) |
| 18 to 34 Years | 1,452 (1.1%) | 1,611 (1.2%) |
| 35 to 64 Years | 5,044 (2.4%) | 4,326 (2.0%) |
| 65 to 74 Years | 1,983 (3.8%) | 2,082 (3.6%) |
| 75 Years and over | 2,041 (6.7%) | 3,415 (7.3%) |
Disability Class: Cognitive Difficulty
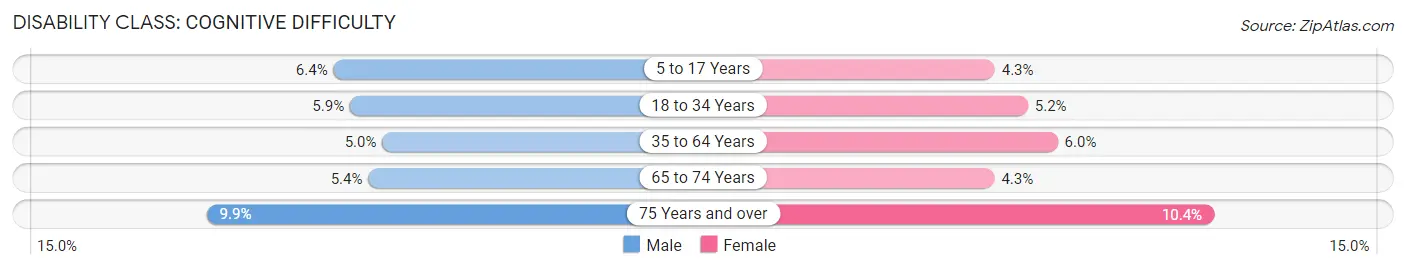
| Age Bracket | Male | Female |
| 5 to 17 Years | 5,073 (6.4%) | 3,183 (4.3%) |
| 18 to 34 Years | 7,792 (5.9%) | 6,779 (5.2%) |
| 35 to 64 Years | 10,427 (5.0%) | 12,804 (6.0%) |
| 65 to 74 Years | 2,847 (5.4%) | 2,488 (4.3%) |
| 75 Years and over | 3,006 (9.9%) | 4,819 (10.4%) |
Disability Class: Ambulatory Difficulty
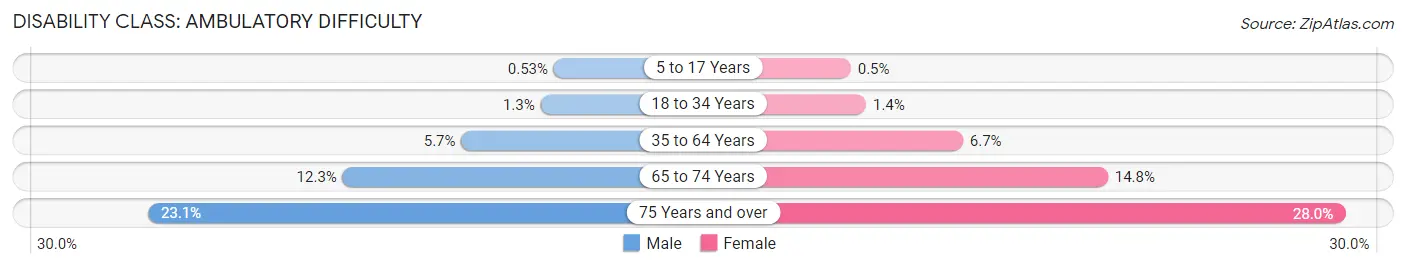
| Age Bracket | Male | Female |
| 5 to 17 Years | 420 (0.5%) | 370 (0.5%) |
| 18 to 34 Years | 1,672 (1.3%) | 1,771 (1.3%) |
| 35 to 64 Years | 11,734 (5.7%) | 14,348 (6.7%) |
| 65 to 74 Years | 6,438 (12.3%) | 8,671 (14.8%) |
| 75 Years and over | 7,001 (23.1%) | 13,029 (28.0%) |
Disability Class: Self-Care Difficulty
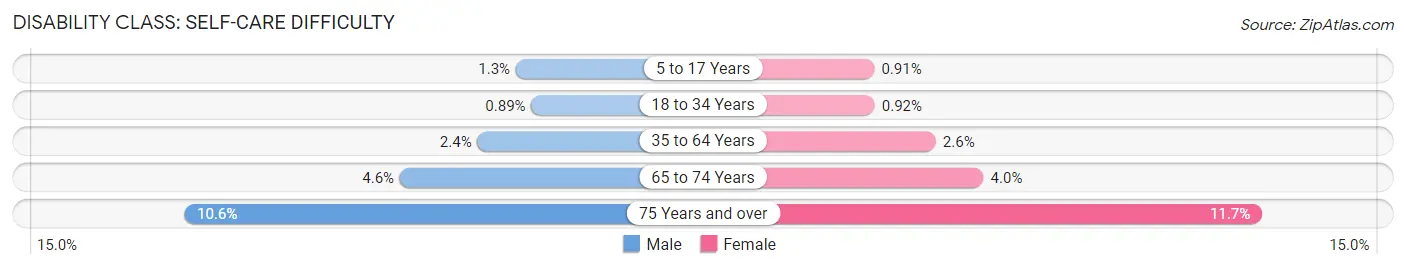
| Age Bracket | Male | Female |
| 5 to 17 Years | 1,045 (1.3%) | 683 (0.9%) |
| 18 to 34 Years | 1,163 (0.9%) | 1,203 (0.9%) |
| 35 to 64 Years | 4,942 (2.4%) | 5,578 (2.6%) |
| 65 to 74 Years | 2,384 (4.5%) | 2,312 (4.0%) |
| 75 Years and over | 3,197 (10.6%) | 5,441 (11.7%) |
Technology Access in Rhode Island
Computing Device Access in Rhode Island
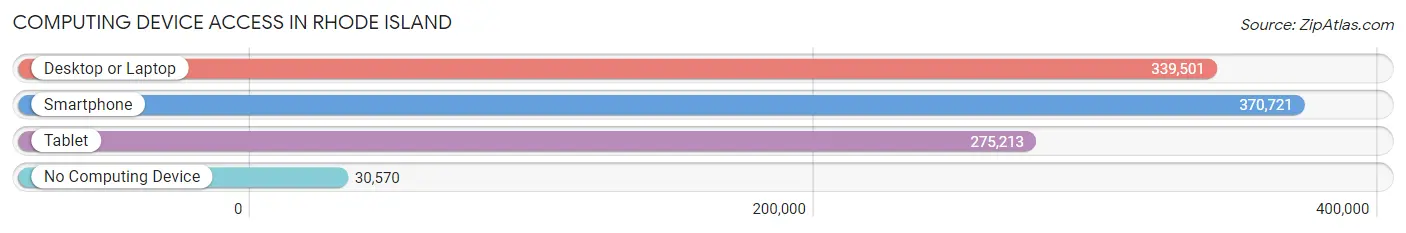
| Device Type | # Households | % Households |
| Desktop or Laptop | 339,501 | 78.5% |
| Smartphone | 370,721 | 85.8% |
| Tablet | 275,213 | 63.7% |
| No Computing Device | 30,570 | 7.1% |
| Total | 432,219 | 100.0% |
Internet Access in Rhode Island
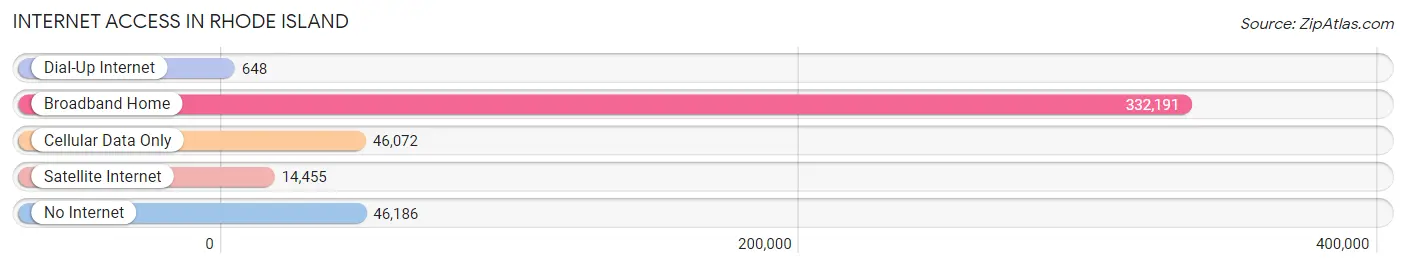
| Internet Type | # Households | % Households |
| Dial-Up Internet | 648 | 0.2% |
| Broadband Home | 332,191 | 76.9% |
| Cellular Data Only | 46,072 | 10.7% |
| Satellite Internet | 14,455 | 3.3% |
| No Internet | 46,186 | 10.7% |
| Total | 432,219 | 100.0% |
Rhode Island Summary
Rhode Island is the smallest state in the United States, located in the New England region of the country. It is bordered by Massachusetts to the north and east, Connecticut to the west, and the Atlantic Ocean to the south. Rhode Island is known for its beautiful coastline, historic cities, and vibrant culture.
History
Rhode Island was first settled by Europeans in 1636, when Roger Williams and a group of settlers from Massachusetts established the settlement of Providence. Williams had been banished from Massachusetts for his religious beliefs, and he sought to create a colony where people of all faiths could live in peace. In 1643, the four towns of Providence, Portsmouth, Newport, and Warwick formed a confederation, which became the Colony of Rhode Island and Providence Plantations.
Rhode Island was one of the original 13 colonies that declared independence from Britain in 1776. During the Revolutionary War, Rhode Island was the first colony to declare its independence from Britain. After the war, Rhode Island was the last of the original 13 colonies to ratify the Constitution in 1790.
Geography
Rhode Island is located in the New England region of the United States. It is bordered by Massachusetts to the north and east, Connecticut to the west, and the Atlantic Ocean to the south. Rhode Island is the smallest state in the country, with an area of just 1,214 square miles.
The state is divided into five counties: Bristol, Kent, Newport, Providence, and Washington. The capital of Rhode Island is Providence, which is also the largest city in the state. Other major cities include Warwick, Cranston, Pawtucket, and Newport.
Rhode Island is known for its beautiful coastline, which is dotted with beaches, lighthouses, and historic towns. The state is also home to several rivers, including the Blackstone, Pawtucket, and Woonasquatucket.
Economy
Rhode Island has a diverse economy, with a mix of manufacturing, services, and tourism. The state’s largest industries include manufacturing, health care, and tourism.
Manufacturing is a major part of the Rhode Island economy, with products ranging from jewelry to electronics. The state is home to several large companies, including Hasbro, CVS Health, and Textron.
Health care is also a major industry in Rhode Island, with several major hospitals and medical centers located in the state. Tourism is also an important part of the economy, with visitors coming to the state to enjoy its beaches, historic cities, and vibrant culture.
Demographics
As of 2020, Rhode Island had an estimated population of 1,059,361. The state is predominantly white, with 78.3% of the population identifying as white. Other racial groups include African Americans (7.2%), Hispanics (11.2%), and Asians (2.3%).
The median household income in Rhode Island is $68,890, and the median home value is $269,400. The state has a poverty rate of 11.2%, which is slightly higher than the national average.
Conclusion
Rhode Island is the smallest state in the United States, located in the New England region of the country. It is known for its beautiful coastline, historic cities, and vibrant culture. The state has a diverse economy, with a mix of manufacturing, services, and tourism. Rhode Island has an estimated population of 1,059,361, with a median household income of $68,890 and a median home value of $269,400.
Common Questions
When was Rhode Island Incorporated?
Rhode Island was Incorporated into the Union on May 29, 1790.
What is the Total Area of Rhode Island?
Total Area of Rhode Island is 1,545 Square Miles.
What is the Total Land Area of Rhode Island?
Total Land Area of Rhode Island is 1,034 Square Miles.
What is the Total Water Area of Rhode Island?
Total Water Area of Rhode Island is 511 Square Miles.
What is the Average Elevation in Rhode Island?
Average Elevation in Rhode Island is 200 Feet.
What is the Highest Elevation in Rhode Island?
Highest Elevation in Rhode Island is 812 Feet.
What is the Lowest Elevation in Rhode Island?
Lowest Elevation in Rhode Island is 0 Feet.
What is the Population Density in Rhode Island?
Population Density in Rhode Island is 1,058.3 People per Square Mile.
What is Per Capita Income in Rhode Island?
Per Capita income in Rhode Island is $43,324.
What is the Median Family Income in Rhode Island?
Median Family Income in Rhode Island is $104,033.
What is the Median Household income in Rhode Island?
Median Household Income in Rhode Island is $81,370.
What is Income or Wage Gap in Rhode Island?
Income or Wage Gap in Rhode Island is 26.1%.
Women in Rhode Island earn 73.9 cents for every dollar earned by a man.
What is Family Income Deficit in Rhode Island?
Family Income Deficit in Rhode Island is $10,868.
Families that are below poverty line in Rhode Island earn $10,868 less on average than the poverty threshold level.
What is Inequality or Gini Index in Rhode Island?
Inequality or Gini Index in Rhode Island is 0.46.
What is the Total Population of Rhode Island?
Total Population of Rhode Island is 1,094,250.
What is the Total Male Population of Rhode Island?
Total Male Population of Rhode Island is 537,221.
What is the Total Female Population of Rhode Island?
Total Female Population of Rhode Island is 557,029.
What is the Ratio of Males per 100 Females in Rhode Island?
There are 96.44 Males per 100 Females in Rhode Island.
What is the Ratio of Females per 100 Males in Rhode Island?
There are 103.69 Females per 100 Males in Rhode Island.
What is the Median Population Age in Rhode Island?
Median Population Age in Rhode Island is 40.1 Years.
What is the Average Family Size in Rhode Island
Average Family Size in Rhode Island is 3.0 People.
What is the Average Household Size in Rhode Island
Average Household Size in Rhode Island is 2.4 People.
How Large is the Labor Force in Rhode Island?
There are 592,223 People in the Labor Forcein in Rhode Island.
What is the Percentage of People in the Labor Force in Rhode Island?
64.9% of People are in the Labor Force in Rhode Island.
What is the Unemployment Rate in Rhode Island?
Unemployment Rate in Rhode Island is 5.9%.