Florida Map & Demographics
Florida Map
Florida Overview
Mar 3, 1845
INCORPORATED
65,758
TOTAL AREA [ SQ MI ]
53,603
LAND AREA [ SQ MI ]
12,154
WATER AREA [ SQ MI ]
100
ELEVATION AVG [ FT ]
345
ELEVATION HIGH [ FT ]
Sea Level
ELEVATION LOW [ FT ]
403.6
POP DENSITY [ PPL / SQ MI ]
$38,850
PER CAPITA INCOME
$81,514
AVG FAMILY INCOME
$67,917
AVG HOUSEHOLD INCOME
22.6%
WAGE / INCOME GAP [ % ]
77.4¢/ $1
WAGE / INCOME GAP [ $ ]
$10,542
FAMILY INCOME DEFICIT
0.49
INEQUALITY / GINI INDEX
34787
LARGEST ZIP CODE
Jacksonville
LARGEST CITY
Miami-Dade County
LARGEST COUNTY
21,634,529
TOTAL POPULATION
10,646,786
MALE POPULATION
10,987,743
FEMALE POPULATION
96.90
MALES / 100 FEMALES
103.20
FEMALES / 100 MALES
42.4
MEDIAN AGE
3.1
AVG FAMILY SIZE
2.5
AVG HOUSEHOLD SIZE
10,628,791
LABOR FORCE [ PEOPLE ]
59.4%
PERCENT IN LABOR FORCE
5.0%
UNEMPLOYMENT RATE
Florida Area Codes
Income in Florida
Income Overview in Florida
Per Capita Income in Florida is $38,850, while median incomes of families and households are $81,514 and $67,917 respectively.
| Characteristic | Number | Measure |
| Per Capita Income | 21,634,529 | $38,850 |
| Median Family Income | 5,398,152 | $81,514 |
| Mean Family Income | 5,398,152 | $112,658 |
| Median Household Income | 8,353,441 | $67,917 |
| Mean Household Income | 8,353,441 | $96,992 |
| Income Deficit | 5,398,152 | $10,542 |
| Wage / Income Gap (%) | 21,634,529 | 22.56% |
| Wage / Income Gap ($) | 21,634,529 | 77.44¢ per $1 |
| Gini / Inequality Index | 21,634,529 | 0.49 |
Earnings by Sex in Florida
Average Earnings in Florida are $37,826, $42,944 for men and $33,256 for women, a difference of 22.6%.
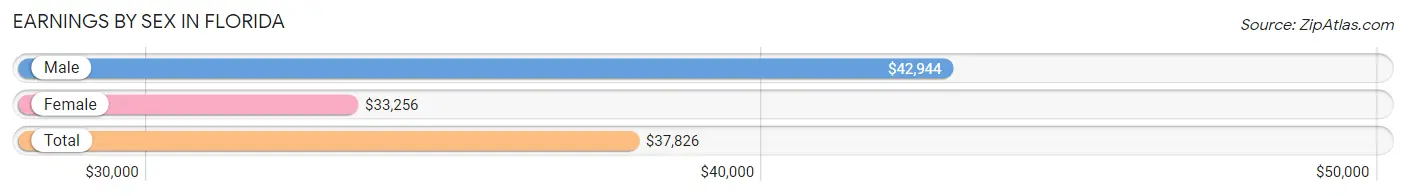
| Sex | Number | Average Earnings |
| Male | 5,766,513 (52.6%) | $42,944 |
| Female | 5,199,228 (47.4%) | $33,256 |
| Total | 10,965,741 (100.0%) | $37,826 |
Earnings by Sex by Income Bracket in Florida
The most common earnings brackets in Florida are $100,000+ for men (930,545 | 16.1%) and $25,000 to $29,999 for women (405,731 | 7.8%).
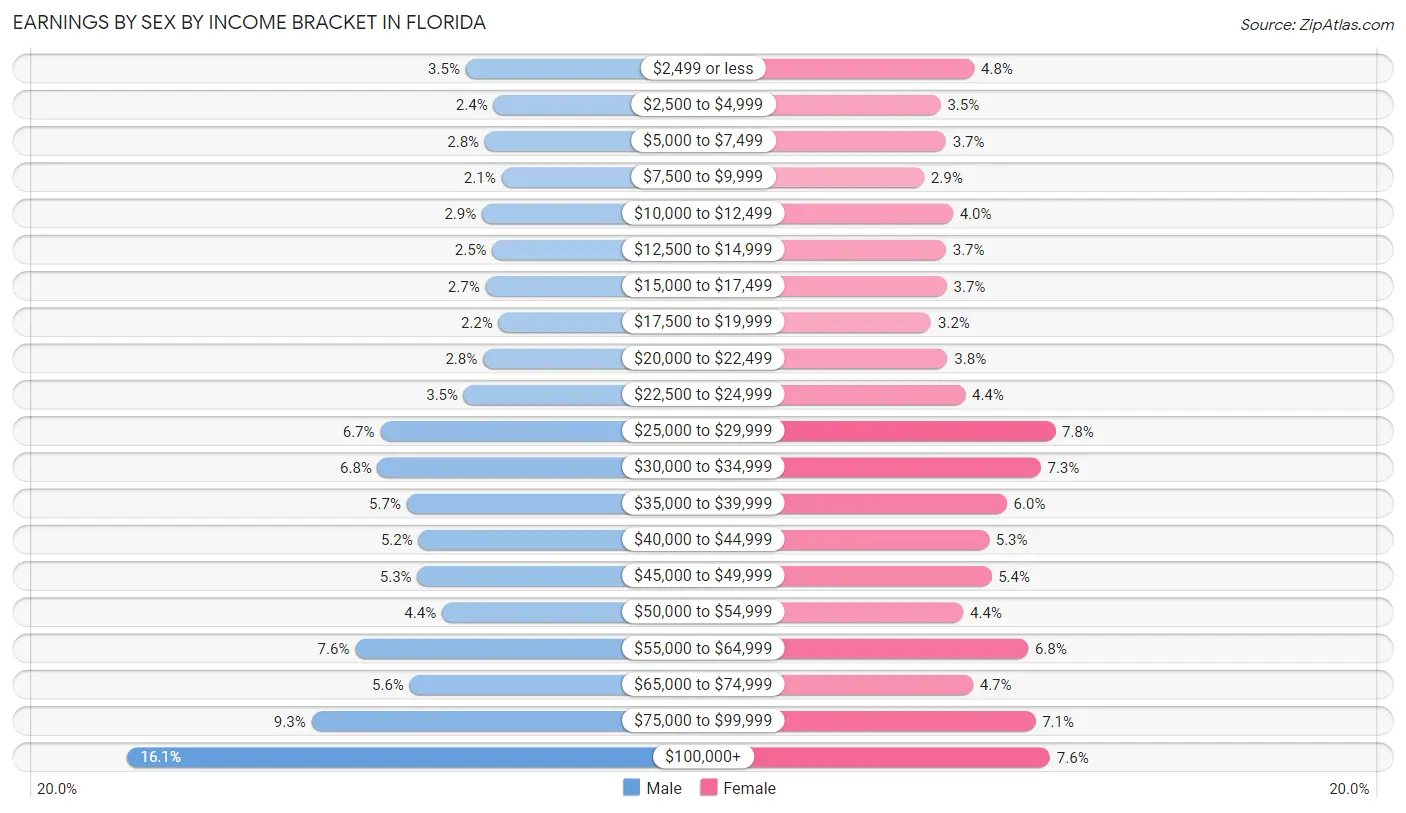
| Income | Male | Female |
| $2,499 or less | 200,367 (3.5%) | 248,038 (4.8%) |
| $2,500 to $4,999 | 139,967 (2.4%) | 182,270 (3.5%) |
| $5,000 to $7,499 | 158,397 (2.8%) | 193,052 (3.7%) |
| $7,500 to $9,999 | 122,665 (2.1%) | 150,451 (2.9%) |
| $10,000 to $12,499 | 165,086 (2.9%) | 206,647 (4.0%) |
| $12,500 to $14,999 | 142,298 (2.5%) | 192,650 (3.7%) |
| $15,000 to $17,499 | 157,586 (2.7%) | 194,606 (3.7%) |
| $17,500 to $19,999 | 129,272 (2.2%) | 164,037 (3.2%) |
| $20,000 to $22,499 | 162,771 (2.8%) | 196,032 (3.8%) |
| $22,500 to $24,999 | 204,140 (3.5%) | 230,270 (4.4%) |
| $25,000 to $29,999 | 384,382 (6.7%) | 405,731 (7.8%) |
| $30,000 to $34,999 | 390,568 (6.8%) | 377,404 (7.3%) |
| $35,000 to $39,999 | 327,258 (5.7%) | 311,516 (6.0%) |
| $40,000 to $44,999 | 302,173 (5.2%) | 276,711 (5.3%) |
| $45,000 to $49,999 | 304,262 (5.3%) | 281,475 (5.4%) |
| $50,000 to $54,999 | 251,582 (4.4%) | 226,526 (4.4%) |
| $55,000 to $64,999 | 438,625 (7.6%) | 353,236 (6.8%) |
| $65,000 to $74,999 | 321,410 (5.6%) | 245,488 (4.7%) |
| $75,000 to $99,999 | 533,159 (9.2%) | 367,176 (7.1%) |
| $100,000+ | 930,545 (16.1%) | 395,912 (7.6%) |
| Total | 5,766,513 (100.0%) | 5,199,228 (100.0%) |
Earnings by Sex by Educational Attainment in Florida
Average earnings in Florida are $47,641 for men and $37,094 for women, a difference of 22.1%. Men with an educational attainment of graduate degree enjoy the highest average annual earnings of $91,423, while those with less than high school education earn the least with $31,740. Women with an educational attainment of graduate degree earn the most with the average annual earnings of $62,610, while those with less than high school education have the smallest earnings of $22,027.
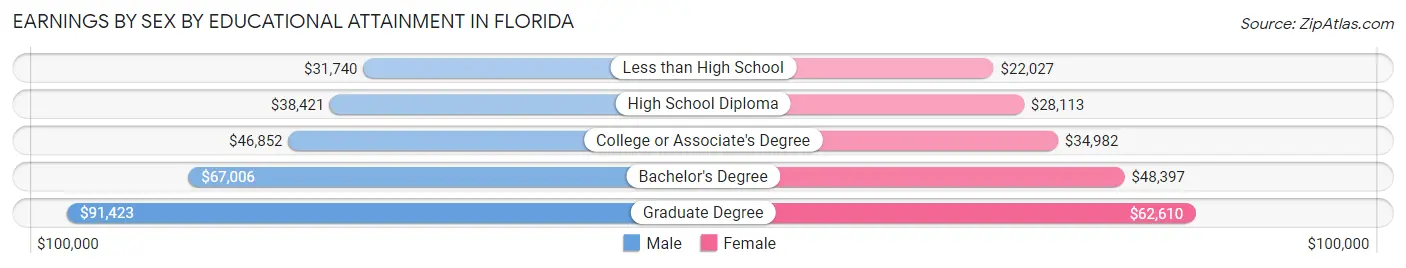
| Educational Attainment | Male Income | Female Income |
| Less than High School | $31,740 | $22,027 |
| High School Diploma | $38,421 | $28,113 |
| College or Associate's Degree | $46,852 | $34,982 |
| Bachelor's Degree | $67,006 | $48,397 |
| Graduate Degree | $91,423 | $62,610 |
| Total | $47,641 | $37,094 |
Family Income in Florida
Family Income Brackets in Florida
According to the Florida family income data, there are 1,020,251 families falling into the $100,000 to $149,999 income range, which is the most common income bracket and makes up 18.9% of all families. Conversely, the $10,000 to $14,999 income bracket is the least frequent group with only 102,565 families (1.9%) belonging to this category.
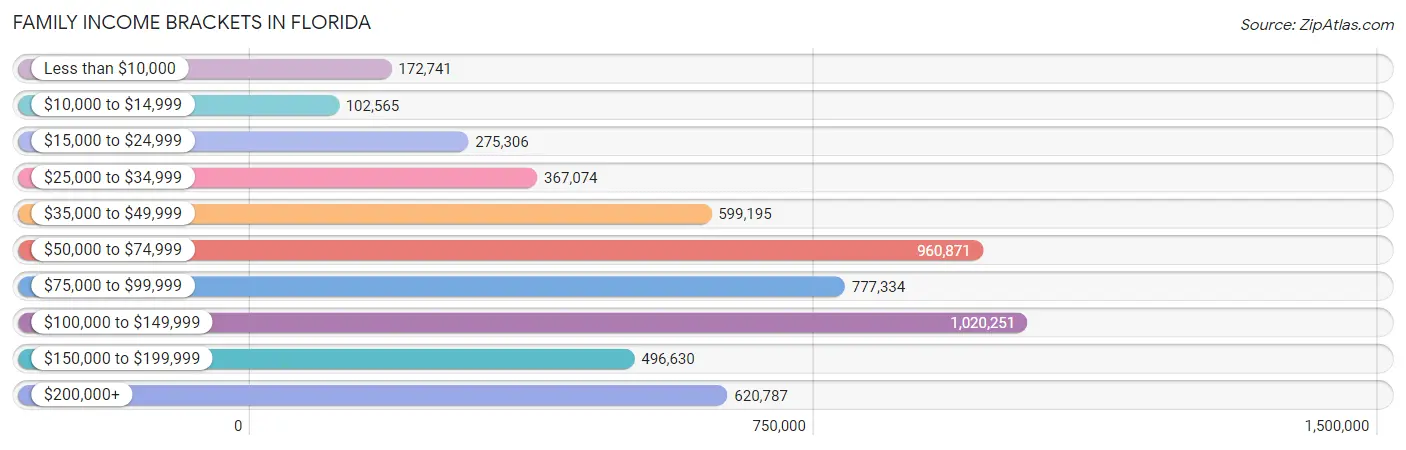
| Income Bracket | # Families | % Families |
| Less than $10,000 | 172,741 | 3.2% |
| $10,000 to $14,999 | 102,565 | 1.9% |
| $15,000 to $24,999 | 275,306 | 5.1% |
| $25,000 to $34,999 | 367,074 | 6.8% |
| $35,000 to $49,999 | 599,195 | 11.1% |
| $50,000 to $74,999 | 960,871 | 17.8% |
| $75,000 to $99,999 | 777,334 | 14.4% |
| $100,000 to $149,999 | 1,020,251 | 18.9% |
| $150,000 to $199,999 | 496,630 | 9.2% |
| $200,000+ | 620,787 | 11.5% |
Family Income by Famaliy Size in Florida
7+ person families (68,918 | 1.3%) account for the highest median family income in Florida with $100,282 per family, while 2-person families (2,751,828 | 51.0%) have the highest median income of $36,829 per family member.
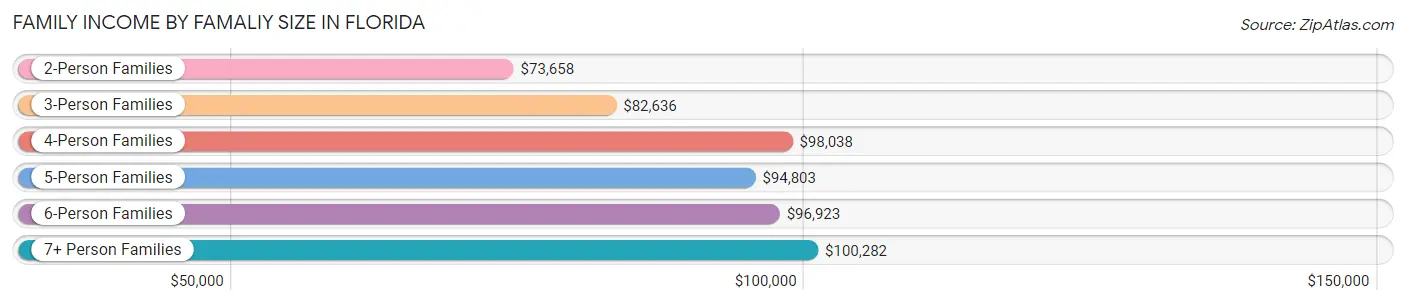
| Income Bracket | # Families | Median Income |
| 2-Person Families | 2,751,828 (51.0%) | $73,658 |
| 3-Person Families | 1,191,376 (22.1%) | $82,636 |
| 4-Person Families | 875,347 (16.2%) | $98,038 |
| 5-Person Families | 377,839 (7.0%) | $94,803 |
| 6-Person Families | 132,844 (2.5%) | $96,923 |
| 7+ Person Families | 68,918 (1.3%) | $100,282 |
| Total | 5,398,152 (100.0%) | $81,514 |
Family Income by Number of Earners in Florida
The median family income in Florida is $81,514, with families comprising 3+ earners (565,952) having the highest median family income of $126,171, while families with no earners (1,043,839) have the lowest median family income of $52,477, accounting for 10.5% and 19.3% of families, respectively.
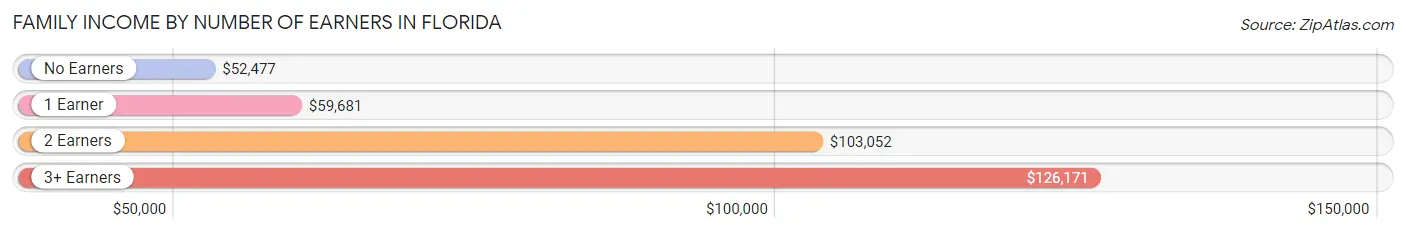
| Number of Earners | # Families | Median Income |
| No Earners | 1,043,839 (19.3%) | $52,477 |
| 1 Earner | 1,750,352 (32.4%) | $59,681 |
| 2 Earners | 2,038,009 (37.8%) | $103,052 |
| 3+ Earners | 565,952 (10.5%) | $126,171 |
| Total | 5,398,152 (100.0%) | $81,514 |
Household Income in Florida
Household Income Brackets in Florida
With 1,470,206 households falling in the category, the $50,000 to $74,999 income range is the most frequent in Florida, accounting for 17.6% of all households. In contrast, only 309,077 households (3.7%) fall into the $10,000 to $14,999 income bracket, making it the least populous group.
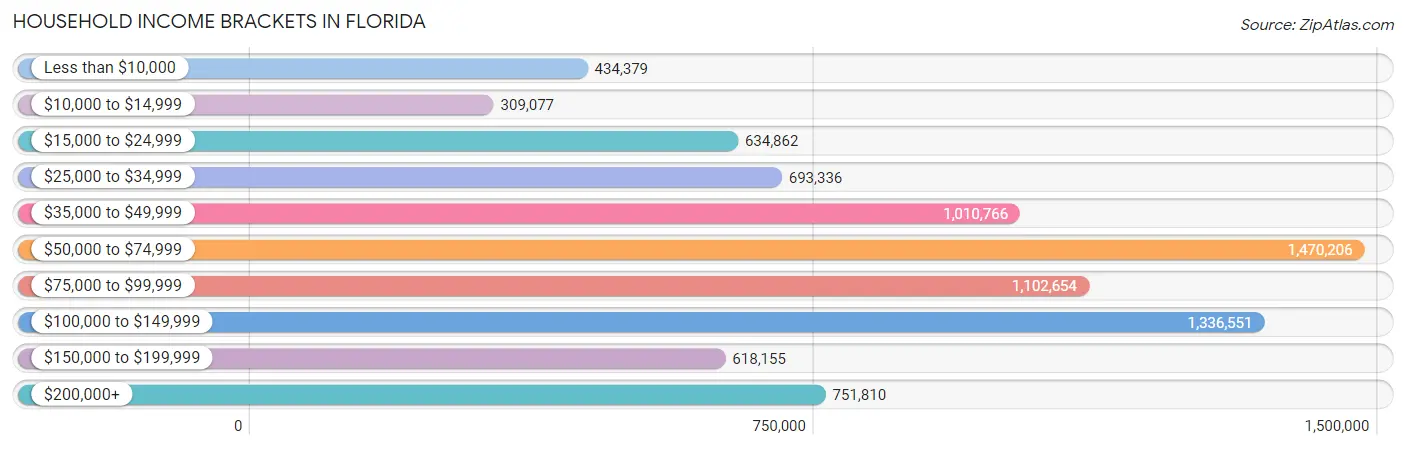
| Income Bracket | # Households | % Households |
| Less than $10,000 | 434,379 | 5.2% |
| $10,000 to $14,999 | 309,077 | 3.7% |
| $15,000 to $24,999 | 634,862 | 7.6% |
| $25,000 to $34,999 | 693,336 | 8.3% |
| $35,000 to $49,999 | 1,010,766 | 12.1% |
| $50,000 to $74,999 | 1,470,206 | 17.6% |
| $75,000 to $99,999 | 1,102,654 | 13.2% |
| $100,000 to $149,999 | 1,336,551 | 16.0% |
| $150,000 to $199,999 | 618,155 | 7.4% |
| $200,000+ | 751,810 | 9.0% |
Household Income by Householder Age in Florida
The median household income in Florida is $67,917, with the highest median household income of $80,393 found in the 45 to 64 years age bracket for the primary householder. A total of 3,057,882 households (36.6%) fall into this category. Meanwhile, the 15 to 24 years age bracket for the primary householder has the lowest median household income of $41,020, with 233,962 households (2.8%) in this group.
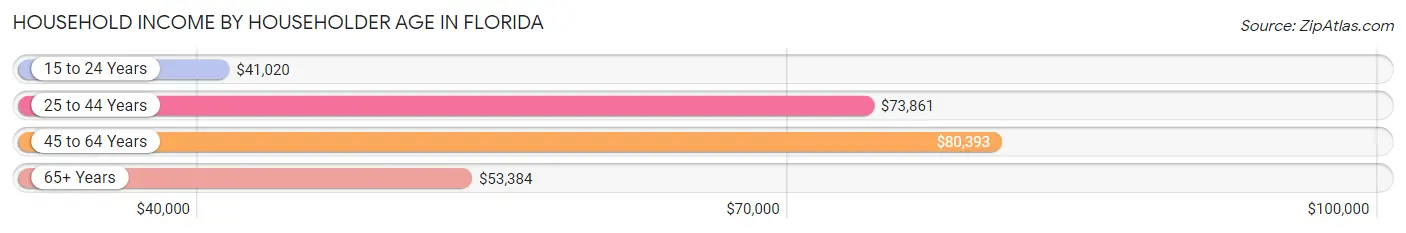
| Income Bracket | # Households | Median Income |
| 15 to 24 Years | 233,962 (2.8%) | $41,020 |
| 25 to 44 Years | 2,385,773 (28.6%) | $73,861 |
| 45 to 64 Years | 3,057,882 (36.6%) | $80,393 |
| 65+ Years | 2,675,824 (32.0%) | $53,384 |
| Total | 8,353,441 (100.0%) | $67,917 |
Poverty in Florida
Income Below Poverty by Sex and Age in Florida
With 11.8% poverty level for males and 13.9% for females among the residents of Florida, under 5 year old males and under 5 year old females are the most vulnerable to poverty, with 105,449 males (19.1%) and 103,210 females (19.5%) in their respective age groups living below the poverty level.
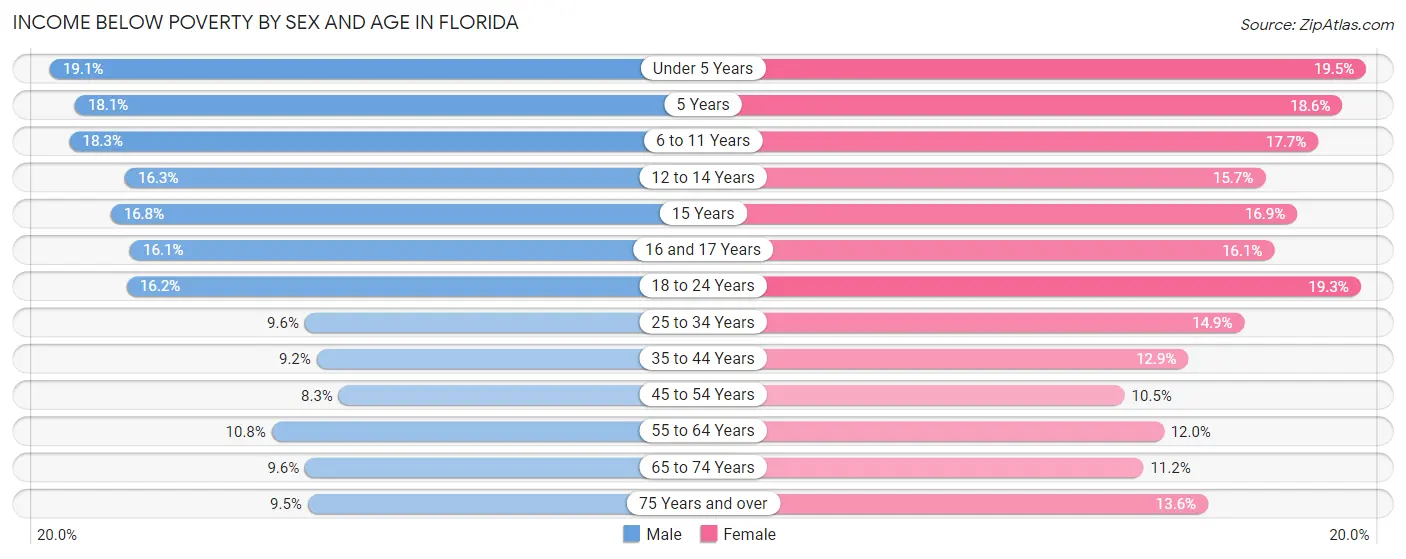
| Age Bracket | Male | Female |
| Under 5 Years | 105,449 (19.1%) | 103,210 (19.5%) |
| 5 Years | 20,088 (18.1%) | 19,911 (18.6%) |
| 6 to 11 Years | 129,573 (18.3%) | 119,722 (17.7%) |
| 12 to 14 Years | 62,474 (16.3%) | 56,546 (15.7%) |
| 15 Years | 21,310 (16.8%) | 20,368 (16.9%) |
| 16 and 17 Years | 40,324 (16.1%) | 38,592 (16.1%) |
| 18 to 24 Years | 138,060 (16.2%) | 156,907 (19.3%) |
| 25 to 34 Years | 130,853 (9.6%) | 200,770 (14.9%) |
| 35 to 44 Years | 119,915 (9.2%) | 169,608 (12.9%) |
| 45 to 54 Years | 110,811 (8.3%) | 142,837 (10.5%) |
| 55 to 64 Years | 150,327 (10.8%) | 179,671 (11.9%) |
| 65 to 74 Years | 109,353 (9.6%) | 147,413 (11.2%) |
| 75 Years and over | 81,724 (9.5%) | 149,817 (13.6%) |
| Total | 1,220,261 (11.8%) | 1,505,372 (13.9%) |
Income Above Poverty by Sex and Age in Florida
According to the poverty statistics in Florida, males aged 45 to 54 years and females aged 45 to 54 years are the age groups that are most secure financially, with 91.7% of males and 89.5% of females in these age groups living above the poverty line.
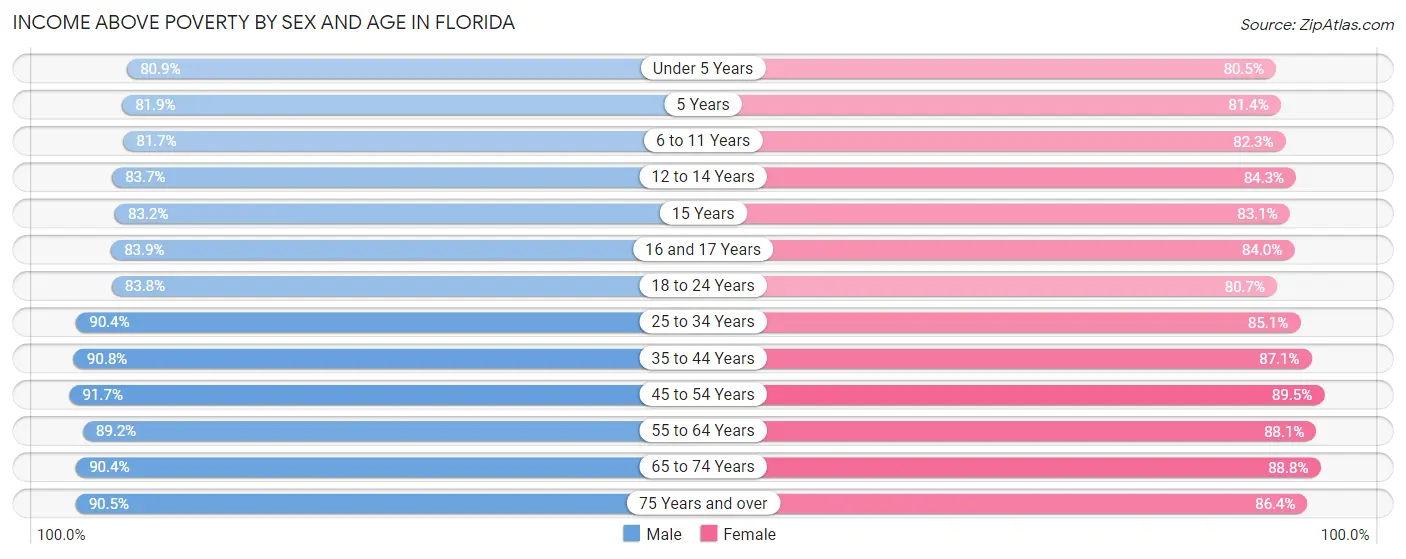
| Age Bracket | Male | Female |
| Under 5 Years | 447,729 (80.9%) | 427,278 (80.5%) |
| 5 Years | 90,738 (81.9%) | 87,240 (81.4%) |
| 6 to 11 Years | 577,459 (81.7%) | 557,526 (82.3%) |
| 12 to 14 Years | 321,505 (83.7%) | 303,449 (84.3%) |
| 15 Years | 105,499 (83.2%) | 100,184 (83.1%) |
| 16 and 17 Years | 210,524 (83.9%) | 201,793 (84.0%) |
| 18 to 24 Years | 714,039 (83.8%) | 657,945 (80.7%) |
| 25 to 34 Years | 1,231,987 (90.4%) | 1,143,082 (85.1%) |
| 35 to 44 Years | 1,189,097 (90.8%) | 1,149,143 (87.1%) |
| 45 to 54 Years | 1,217,434 (91.7%) | 1,217,869 (89.5%) |
| 55 to 64 Years | 1,238,230 (89.2%) | 1,323,913 (88.0%) |
| 65 to 74 Years | 1,031,498 (90.4%) | 1,168,896 (88.8%) |
| 75 Years and over | 779,278 (90.5%) | 952,732 (86.4%) |
| Total | 9,155,017 (88.2%) | 9,291,050 (86.1%) |
Income Below Poverty Among Married-Couple Families in Florida
The poverty statistics for married-couple families in Florida show that 5.4% or 209,747 of the total 3,905,043 families live below the poverty line. Families with 5 or more children have the highest poverty rate of 25.7%, comprising of 4,560 families. On the other hand, families with no children have the lowest poverty rate of 4.5%, which includes 114,703 families.
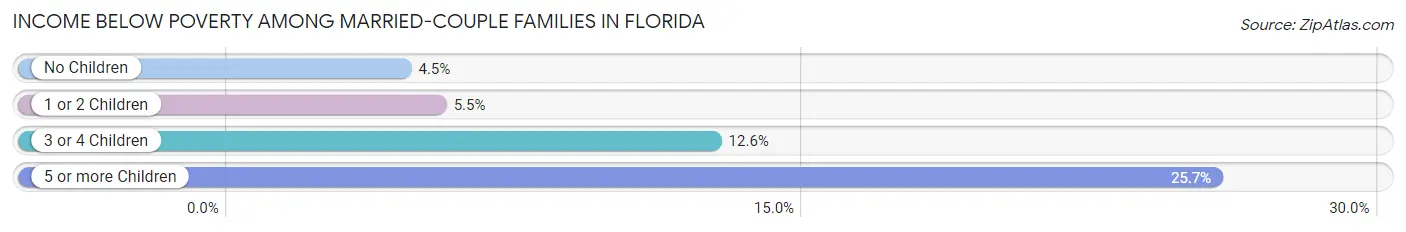
| Children | Above Poverty | Below Poverty |
| No Children | 2,416,529 (95.5%) | 114,703 (4.5%) |
| 1 or 2 Children | 1,063,349 (94.6%) | 61,244 (5.4%) |
| 3 or 4 Children | 202,248 (87.4%) | 29,240 (12.6%) |
| 5 or more Children | 13,170 (74.3%) | 4,560 (25.7%) |
| Total | 3,695,296 (94.6%) | 209,747 (5.4%) |
Income Below Poverty Among Single-Parent Households in Florida
According to the poverty data in Florida, 12.2% or 52,441 single-father households and 21.6% or 230,225 single-mother households are living below the poverty line. Among single-father households, those with 5 or more children have the highest poverty rate, with 722 households (36.4%) experiencing poverty. Likewise, among single-mother households, those with 5 or more children have the highest poverty rate, with 6,742 households (69.9%) falling below the poverty line.
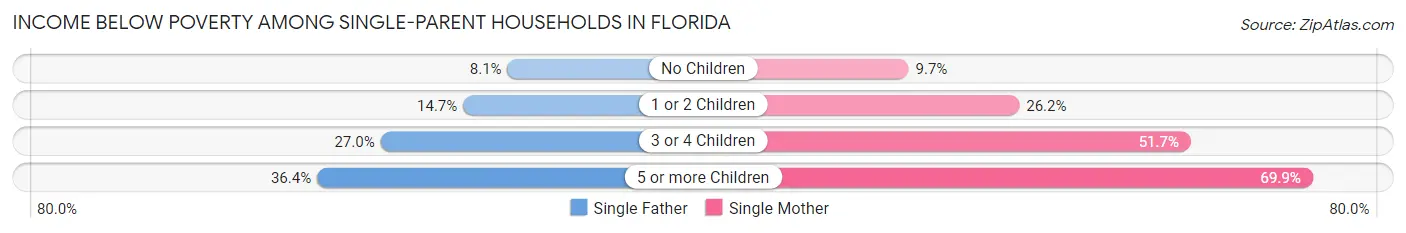
| Children | Single Father | Single Mother |
| No Children | 17,193 (8.1%) | 44,376 (9.7%) |
| 1 or 2 Children | 27,405 (14.7%) | 132,065 (26.2%) |
| 3 or 4 Children | 7,121 (27.0%) | 47,042 (51.7%) |
| 5 or more Children | 722 (36.4%) | 6,742 (69.9%) |
| Total | 52,441 (12.2%) | 230,225 (21.6%) |
Income Below Poverty Among Married-Couple vs Single-Parent Households in Florida
The poverty data for Florida shows that 209,747 of the married-couple family households (5.4%) and 282,666 of the single-parent households (18.9%) are living below the poverty level. Within the married-couple family households, those with 5 or more children have the highest poverty rate, with 4,560 households (25.7%) falling below the poverty line. Among the single-parent households, those with 5 or more children have the highest poverty rate, with 7,464 household (64.2%) living below poverty.
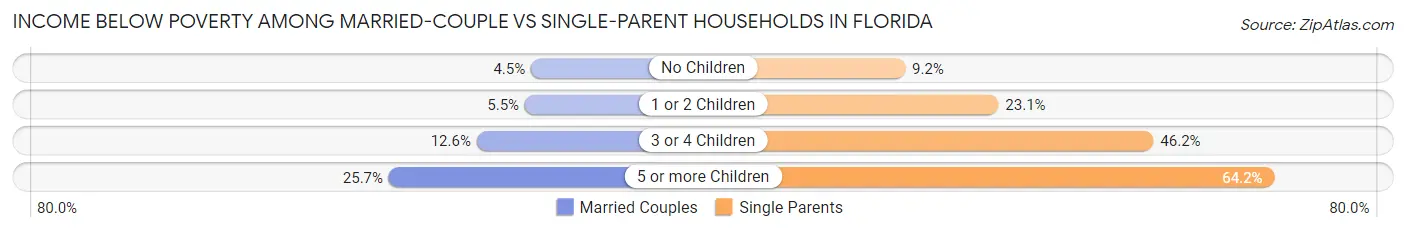
| Children | Married-Couple Families | Single-Parent Households |
| No Children | 114,703 (4.5%) | 61,569 (9.1%) |
| 1 or 2 Children | 61,244 (5.4%) | 159,470 (23.1%) |
| 3 or 4 Children | 29,240 (12.6%) | 54,163 (46.2%) |
| 5 or more Children | 4,560 (25.7%) | 7,464 (64.2%) |
| Total | 209,747 (5.4%) | 282,666 (18.9%) |
Largest Zip Codes by Population in Florida
The largest zip codes in Florida by population are 34787 (86,913), 34953 (78,558), 33311 (75,435), 33411 (73,919), and 33024 (73,405).
1.34787
86,913 (0.40%)
2.34953
78,558 (0.36%)
3.33311
75,435 (0.35%)
4.33411
73,919 (0.34%)
5.33024
73,405 (0.34%)
6.33025
72,684 (0.34%)
7.33647
72,323 (0.33%)
8.33023
71,749 (0.33%)
9.33012
71,088 (0.33%)
10.32828
69,778 (0.32%)
11.33157
69,152 (0.32%)
12.32218
68,996 (0.32%)
13.33186
68,750 (0.32%)
14.33015
68,517 (0.32%)
15.32822
68,321 (0.32%)
16.33033
68,121 (0.31%)
17.32210
67,110 (0.31%)
18.34711
66,744 (0.31%)
19.32259
66,518 (0.31%)
20.33463
65,766 (0.30%)
21.32244
65,499 (0.30%)
22.33178
64,751 (0.30%)
23.33027
63,474 (0.29%)
24.32765
63,210 (0.29%)
25.32825
63,056 (0.29%)
26.32808
62,827 (0.29%)
27.32818
62,566 (0.29%)
28.33313
62,232 (0.29%)
29.34744
60,995 (0.28%)
30.33065
60,600 (0.28%)
Largest Cities by Population in Florida
The largest cities in Florida by population are Jacksonville (950,203), Miami (443,665), Tampa (388,768), Orlando (307,738), and St Petersburg (259,343).
950,203 (4.39%)
2.Miami
443,665 (2.05%)
3.Tampa
388,768 (1.80%)
4.Orlando
307,738 (1.42%)
259,343 (1.20%)
6.Hialeah
222,996 (1.03%)
210,520 (0.97%)
198,912 (0.92%)
198,259 (0.92%)
182,673 (0.84%)
170,472 (0.79%)
12.Hollywood
152,764 (0.71%)
13.Gainesville
142,414 (0.66%)
14.Miramar
135,158 (0.62%)
133,801 (0.62%)
16.Lehigh Acres
124,440 (0.58%)
17.Palm Bay
121,513 (0.56%)
117,588 (0.54%)
19.Clearwater
116,984 (0.54%)
20.Spring Hill
116,882 (0.54%)
21.Brandon
114,923 (0.53%)
22.Lakeland
114,404 (0.53%)
111,790 (0.52%)
111,618 (0.52%)
25.Davie
105,821 (0.49%)
26.Riverview
102,467 (0.47%)
27.Boca Raton
97,980 (0.45%)
28.Sunrise
96,510 (0.45%)
29.Deltona
94,373 (0.44%)
30.Alafaya
91,531 (0.42%)
Largest Counties by Population in Florida
The largest counties in Florida by population are Miami-Dade County (2,688,237), Broward County (1,940,907), Palm Beach County (1,494,805), Hillsborough County (1,468,560), and Orange County (1,427,403).
2,688,237 (12.43%)
1,940,907 (8.97%)
1,494,805 (6.91%)
1,468,560 (6.79%)
1,427,403 (6.60%)
995,708 (4.60%)
959,918 (4.44%)
772,902 (3.57%)
736,229 (3.40%)
610,723 (2.82%)
11.Pasco County
569,211 (2.63%)
558,520 (2.58%)
471,321 (2.18%)
439,392 (2.03%)
405,069 (1.87%)
393,745 (1.82%)
17.Lake County
386,829 (1.79%)
380,221 (1.76%)
378,225 (1.75%)
334,682 (1.55%)
321,296 (1.49%)
22.Leon County
294,128 (1.36%)
279,729 (1.29%)
278,722 (1.29%)
25.Clay County
219,650 (1.02%)
212,021 (0.98%)
196,621 (0.91%)
189,900 (0.88%)
188,994 (0.87%)
30.Bay County
181,055 (0.84%)
Race in Florida
The most populous races in Florida are White / Caucasian (13,807,410 | 63.8%), Hispanic or Latino (5,738,283 | 26.5%), and Black / African American (3,355,708 | 15.5%).
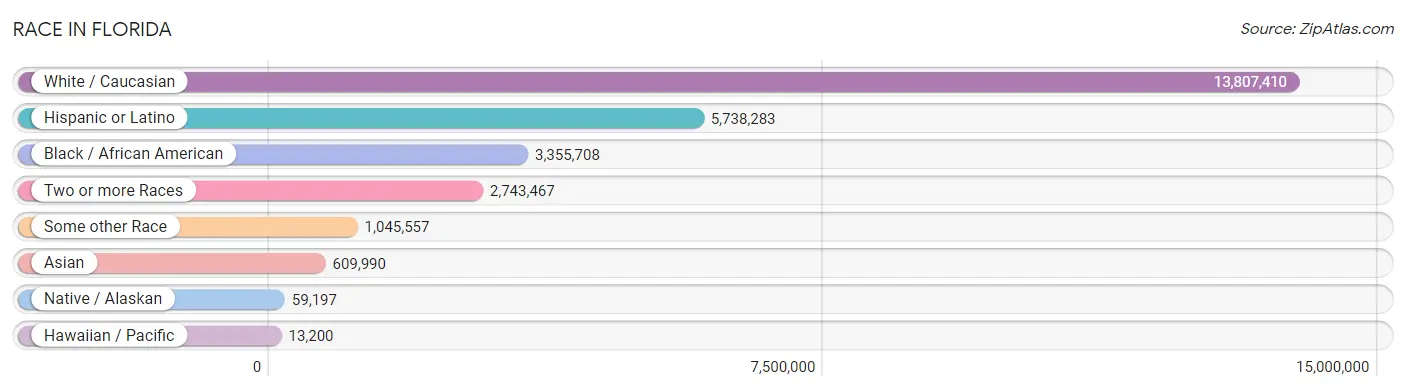
| Race | # Population | % Population |
| Asian | 609,990 | 2.8% |
| Black / African American | 3,355,708 | 15.5% |
| Hawaiian / Pacific | 13,200 | 0.1% |
| Hispanic or Latino | 5,738,283 | 26.5% |
| Native / Alaskan | 59,197 | 0.3% |
| White / Caucasian | 13,807,410 | 63.8% |
| Two or more Races | 2,743,467 | 12.7% |
| Some other Race | 1,045,557 | 4.8% |
| Total | 21,634,529 | 100.0% |
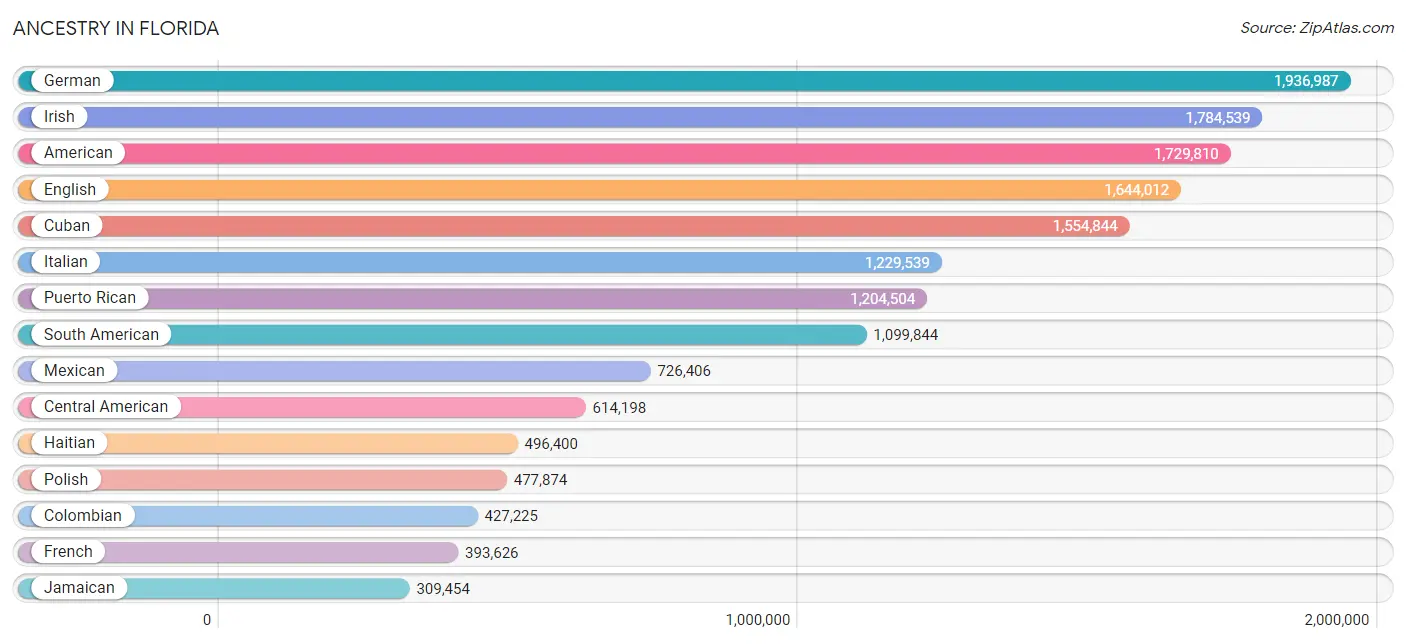
Ancestry in Florida
The most populous ancestries reported in Florida are German (1,936,987 | 8.9%), Irish (1,784,539 | 8.3%), American (1,729,810 | 8.0%), English (1,644,012 | 7.6%), and Cuban (1,554,844 | 7.2%), together accounting for 40.0% of all Florida residents.
| Ancestry | # Population | % Population |
| Afghan | 1,756 | 0.0% |
| African | 113,560 | 0.5% |
| Alaska Native | 228 | 0.0% |
| Alaskan Athabascan | 326 | 0.0% |
| Albanian | 16,814 | 0.1% |
| Aleut | 165 | 0.0% |
| Alsatian | 316 | 0.0% |
| American | 1,729,810 | 8.0% |
| Apache | 3,223 | 0.0% |
| Arab | 137,361 | 0.6% |
| Arapaho | 157 | 0.0% |
| Argentinean | 73,650 | 0.3% |
| Armenian | 12,396 | 0.1% |
| Assyrian / Chaldean / Syriac | 593 | 0.0% |
| Australian | 6,740 | 0.0% |
| Austrian | 45,407 | 0.2% |
| Bahamian | 31,698 | 0.2% |
| Bangladeshi | 1,772 | 0.0% |
| Barbadian | 6,917 | 0.0% |
| Basque | 2,466 | 0.0% |
| Belgian | 16,061 | 0.1% |
| Belizean | 4,723 | 0.0% |
| Bermudan | 1,037 | 0.0% |
| Bhutanese | 40,015 | 0.2% |
| Blackfeet | 8,247 | 0.0% |
| Bolivian | 15,621 | 0.1% |
| Brazilian | 106,672 | 0.5% |
| British | 121,940 | 0.6% |
| British West Indian | 17,476 | 0.1% |
| Bulgarian | 8,863 | 0.0% |
| Burmese | 44,662 | 0.2% |
| Cajun | 2,273 | 0.0% |
| Cambodian | 390 | 0.0% |
| Canadian | 59,982 | 0.3% |
| Cape Verdean | 2,886 | 0.0% |
| Carpatho Rusyn | 417 | 0.0% |
| Celtic | 3,110 | 0.0% |
| Central American | 614,198 | 2.8% |
| Central American Indian | 33,346 | 0.2% |
| Cherokee | 47,943 | 0.2% |
| Cheyenne | 347 | 0.0% |
| Chickasaw | 928 | 0.0% |
| Chilean | 32,298 | 0.2% |
| Chinese | 662 | 0.0% |
| Chippewa | 2,576 | 0.0% |
| Choctaw | 4,018 | 0.0% |
| Colombian | 427,225 | 2.0% |
| Comanche | 314 | 0.0% |
| Costa Rican | 26,435 | 0.1% |
| Cree | 394 | 0.0% |
| Creek | 7,281 | 0.0% |
| Croatian | 17,339 | 0.1% |
| Crow | 334 | 0.0% |
| Cuban | 1,554,844 | 7.2% |
| Cypriot | 916 | 0.0% |
| Czech | 48,978 | 0.2% |
| Czechoslovakian | 14,987 | 0.1% |
| Danish | 38,929 | 0.2% |
| Delaware | 734 | 0.0% |
| Dominican | 267,069 | 1.2% |
| Dutch | 151,982 | 0.7% |
| Dutch West Indian | 1,876 | 0.0% |
| Eastern European | 68,972 | 0.3% |
| Ecuadorian | 85,299 | 0.4% |
| Egyptian | 17,814 | 0.1% |
| English | 1,644,012 | 7.6% |
| Estonian | 2,017 | 0.0% |
| Ethiopian | 5,148 | 0.0% |
| European | 297,804 | 1.4% |
| Fijian | 631 | 0.0% |
| Filipino | 6,089 | 0.0% |
| Finnish | 26,256 | 0.1% |
| French | 393,626 | 1.8% |
| French American Indian | 1,394 | 0.0% |
| French Canadian | 103,541 | 0.5% |
| German | 1,936,987 | 8.9% |
| German Russian | 826 | 0.0% |
| Ghanaian | 2,760 | 0.0% |
| Greek | 87,002 | 0.4% |
| Guamanian / Chamorro | 4,821 | 0.0% |
| Guatemalan | 148,879 | 0.7% |
| Guyanese | 26,596 | 0.1% |
| Haitian | 496,400 | 2.3% |
| Hmong | 65 | 0.0% |
| Honduran | 156,033 | 0.7% |
| Hopi | 168 | 0.0% |
| Houma | 241 | 0.0% |
| Hungarian | 93,920 | 0.4% |
| Icelander | 2,342 | 0.0% |
| Indian (Asian) | 143,181 | 0.7% |
| Indonesian | 5,208 | 0.0% |
| Inupiat | 483 | 0.0% |
| Iranian | 15,752 | 0.1% |
| Iraqi | 4,086 | 0.0% |
| Irish | 1,784,539 | 8.3% |
| Iroquois | 4,360 | 0.0% |
| Israeli | 17,416 | 0.1% |
| Italian | 1,229,539 | 5.7% |
| Jamaican | 309,454 | 1.4% |
| Japanese | 7,694 | 0.0% |
| Jordanian | 4,686 | 0.0% |
| Kenyan | 2,417 | 0.0% |
| Kiowa | 97 | 0.0% |
| Korean | 171,931 | 0.8% |
| Laotian | 4,571 | 0.0% |
| Latvian | 4,797 | 0.0% |
| Lebanese | 43,481 | 0.2% |
| Liberian | 1,229 | 0.0% |
| Lithuanian | 38,740 | 0.2% |
| Lumbee | 1,071 | 0.0% |
| Luxembourger | 1,469 | 0.0% |
| Macedonian | 2,314 | 0.0% |
| Malaysian | 9,200 | 0.0% |
| Maltese | 2,465 | 0.0% |
| Marshallese | 15 | 0.0% |
| Menominee | 159 | 0.0% |
| Mexican | 726,406 | 3.4% |
| Mexican American Indian | 13,892 | 0.1% |
| Mongolian | 1,295 | 0.0% |
| Moroccan | 12,873 | 0.1% |
| Native Hawaiian | 11,077 | 0.1% |
| Navajo | 2,252 | 0.0% |
| Nepalese | 10 | 0.0% |
| New Zealander | 1,441 | 0.0% |
| Nicaraguan | 160,690 | 0.7% |
| Nigerian | 18,263 | 0.1% |
| Northern European | 19,723 | 0.1% |
| Norwegian | 123,209 | 0.6% |
| Okinawan | 308 | 0.0% |
| Osage | 542 | 0.0% |
| Ottawa | 382 | 0.0% |
| Paiute | 107 | 0.0% |
| Pakistani | 20,422 | 0.1% |
| Palestinian | 9,922 | 0.1% |
| Panamanian | 39,077 | 0.2% |
| Paraguayan | 3,975 | 0.0% |
| Pennsylvania German | 7,039 | 0.0% |
| Peruvian | 134,970 | 0.6% |
| Pima | 162 | 0.0% |
| Polish | 477,874 | 2.2% |
| Portuguese | 90,838 | 0.4% |
| Potawatomi | 1,207 | 0.0% |
| Pueblo | 489 | 0.0% |
| Puerto Rican | 1,204,504 | 5.6% |
| Puget Sound Salish | 6 | 0.0% |
| Romanian | 36,814 | 0.2% |
| Russian | 189,876 | 0.9% |
| Salvadoran | 80,792 | 0.4% |
| Samoan | 4,389 | 0.0% |
| Scandinavian | 41,181 | 0.2% |
| Scotch-Irish | 150,550 | 0.7% |
| Scottish | 301,025 | 1.4% |
| Seminole | 5,843 | 0.0% |
| Senegalese | 638 | 0.0% |
| Serbian | 11,186 | 0.1% |
| Shoshone | 186 | 0.0% |
| Sierra Leonean | 610 | 0.0% |
| Sioux | 2,909 | 0.0% |
| Slavic | 8,435 | 0.0% |
| Slovak | 30,881 | 0.1% |
| Slovene | 7,505 | 0.0% |
| Somali | 259 | 0.0% |
| South African | 8,297 | 0.0% |
| South American | 1,099,844 | 5.1% |
| South American Indian | 6,852 | 0.0% |
| Soviet Union | 129 | 0.0% |
| Spaniard | 76,287 | 0.4% |
| Spanish | 41,649 | 0.2% |
| Spanish American | 1,914 | 0.0% |
| Spanish American Indian | 750 | 0.0% |
| Sri Lankan | 100,942 | 0.5% |
| Subsaharan African | 166,873 | 0.8% |
| Sudanese | 1,667 | 0.0% |
| Swedish | 144,185 | 0.7% |
| Swiss | 33,802 | 0.2% |
| Syrian | 16,239 | 0.1% |
| Taiwanese | 131 | 0.0% |
| Thai | 209,886 | 1.0% |
| Tlingit-Haida | 189 | 0.0% |
| Tohono O'Odham | 64 | 0.0% |
| Tongan | 755 | 0.0% |
| Trinidadian and Tobagonian | 39,566 | 0.2% |
| Tsimshian | 20 | 0.0% |
| Turkish | 18,782 | 0.1% |
| U.S. Virgin Islander | 8,102 | 0.0% |
| Ugandan | 340 | 0.0% |
| Ukrainian | 62,132 | 0.3% |
| Uruguayan | 19,727 | 0.1% |
| Ute | 94 | 0.0% |
| Venezuelan | 303,842 | 1.4% |
| Vietnamese | 8,242 | 0.0% |
| Welsh | 96,293 | 0.4% |
| West Indian | 34,477 | 0.2% |
| Yakama | 3 | 0.0% |
| Yaqui | 228 | 0.0% |
| Yugoslavian | 14,834 | 0.1% |
| Yuman | 56 | 0.0% |
| Yup'ik | 51 | 0.0% |
| Zimbabwean | 952 | 0.0% | View All 199 Rows |
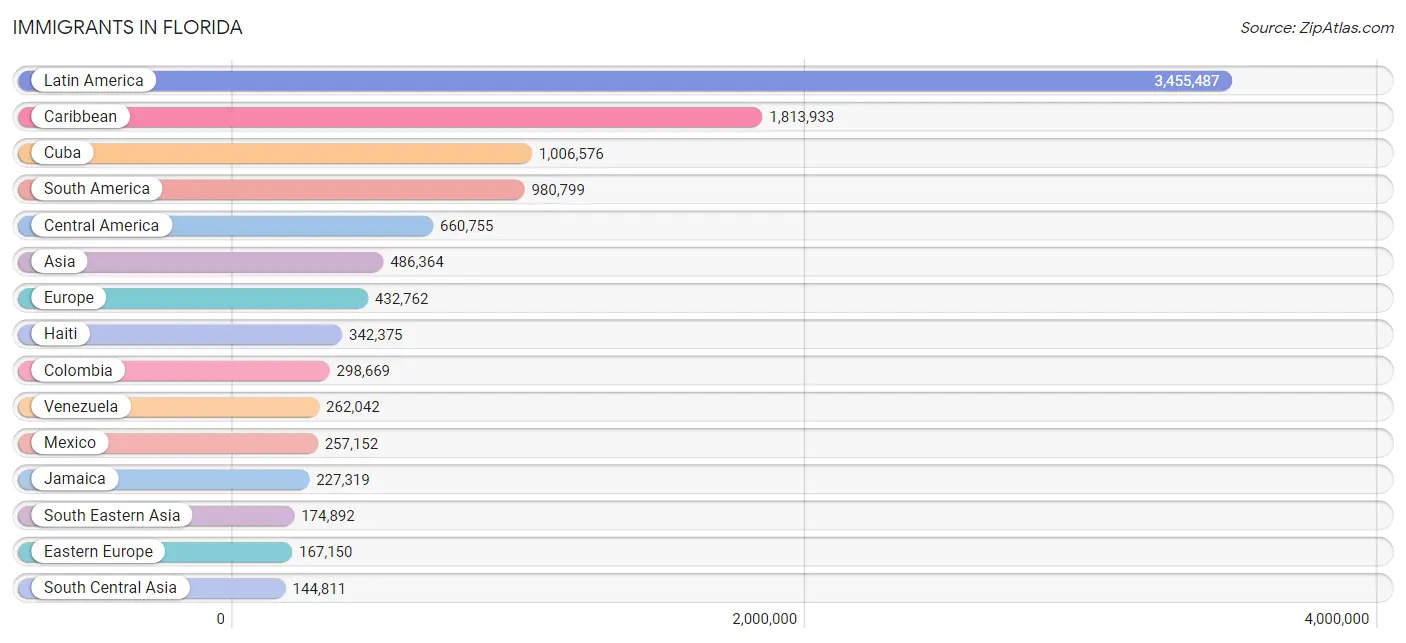
Immigrants in Florida
The most numerous immigrant groups reported in Florida came from Latin America (3,455,487 | 16.0%), Caribbean (1,813,933 | 8.4%), Cuba (1,006,576 | 4.6%), South America (980,799 | 4.5%), and Central America (660,755 | 3.0%), together accounting for 36.6% of all Florida residents.
| Immigration Origin | # Population | % Population |
| Afghanistan | 1,485 | 0.0% |
| Africa | 79,804 | 0.4% |
| Albania | 9,779 | 0.1% |
| Argentina | 57,263 | 0.3% |
| Armenia | 519 | 0.0% |
| Asia | 486,364 | 2.2% |
| Australia | 5,190 | 0.0% |
| Austria | 3,914 | 0.0% |
| Azores | 511 | 0.0% |
| Bahamas | 17,749 | 0.1% |
| Bangladesh | 13,053 | 0.1% |
| Barbados | 6,022 | 0.0% |
| Belarus | 3,802 | 0.0% |
| Belgium | 4,289 | 0.0% |
| Belize | 4,021 | 0.0% |
| Bolivia | 10,861 | 0.1% |
| Bosnia and Herzegovina | 8,695 | 0.0% |
| Brazil | 122,906 | 0.6% |
| Bulgaria | 6,883 | 0.0% |
| Cabo Verde | 738 | 0.0% |
| Cambodia | 3,268 | 0.0% |
| Cameroon | 1,288 | 0.0% |
| Canada | 109,132 | 0.5% |
| Caribbean | 1,813,933 | 8.4% |
| Central America | 660,755 | 3.0% |
| Chile | 22,715 | 0.1% |
| China | 68,658 | 0.3% |
| Colombia | 298,669 | 1.4% |
| Congo | 268 | 0.0% |
| Costa Rica | 16,570 | 0.1% |
| Croatia | 3,756 | 0.0% |
| Cuba | 1,006,576 | 4.6% |
| Czechoslovakia | 8,038 | 0.0% |
| Denmark | 1,613 | 0.0% |
| Dominica | 5,375 | 0.0% |
| Dominican Republic | 137,727 | 0.6% |
| Eastern Africa | 15,560 | 0.1% |
| Eastern Asia | 98,691 | 0.5% |
| Eastern Europe | 167,150 | 0.8% |
| Ecuador | 54,585 | 0.3% |
| Egypt | 13,998 | 0.1% |
| El Salvador | 49,838 | 0.2% |
| England | 37,723 | 0.2% |
| Eritrea | 735 | 0.0% |
| Ethiopia | 3,129 | 0.0% |
| Europe | 432,762 | 2.0% |
| Fiji | 379 | 0.0% |
| France | 20,008 | 0.1% |
| Germany | 54,272 | 0.3% |
| Ghana | 2,904 | 0.0% |
| Greece | 8,980 | 0.0% |
| Grenada | 3,183 | 0.0% |
| Guatemala | 97,632 | 0.4% |
| Guyana | 33,556 | 0.2% |
| Haiti | 342,375 | 1.6% |
| Honduras | 107,160 | 0.5% |
| Hong Kong | 4,585 | 0.0% |
| Hungary | 9,122 | 0.0% |
| India | 94,349 | 0.4% |
| Indonesia | 2,947 | 0.0% |
| Iran | 11,000 | 0.1% |
| Iraq | 4,966 | 0.0% |
| Ireland | 9,421 | 0.0% |
| Israel | 14,535 | 0.1% |
| Italy | 30,755 | 0.1% |
| Jamaica | 227,319 | 1.1% |
| Japan | 10,425 | 0.1% |
| Jordan | 5,245 | 0.0% |
| Kazakhstan | 3,402 | 0.0% |
| Kenya | 3,890 | 0.0% |
| Korea | 19,445 | 0.1% |
| Kuwait | 2,456 | 0.0% |
| Laos | 4,073 | 0.0% |
| Latin America | 3,455,487 | 16.0% |
| Latvia | 1,517 | 0.0% |
| Lebanon | 8,352 | 0.0% |
| Liberia | 1,950 | 0.0% |
| Lithuania | 3,330 | 0.0% |
| Malaysia | 2,635 | 0.0% |
| Mexico | 257,152 | 1.2% |
| Micronesia | 708 | 0.0% |
| Middle Africa | 3,210 | 0.0% |
| Moldova | 4,361 | 0.0% |
| Morocco | 9,164 | 0.0% |
| Nepal | 1,511 | 0.0% |
| Netherlands | 8,103 | 0.0% |
| Nicaragua | 105,066 | 0.5% |
| Nigeria | 10,443 | 0.1% |
| North Macedonia | 1,035 | 0.0% |
| Northern Africa | 27,949 | 0.1% |
| Northern Europe | 99,023 | 0.5% |
| Norway | 2,136 | 0.0% |
| Oceania | 9,516 | 0.0% |
| Pakistan | 13,569 | 0.1% |
| Panama | 22,972 | 0.1% |
| Peru | 96,693 | 0.4% |
| Philippines | 84,403 | 0.4% |
| Poland | 25,219 | 0.1% |
| Portugal | 9,493 | 0.0% |
| Romania | 14,943 | 0.1% |
| Russia | 31,076 | 0.1% |
| Saudi Arabia | 4,597 | 0.0% |
| Scotland | 5,920 | 0.0% |
| Senegal | 850 | 0.0% |
| Serbia | 3,718 | 0.0% |
| Sierra Leone | 595 | 0.0% |
| Singapore | 1,221 | 0.0% |
| Somalia | 157 | 0.0% |
| South Africa | 11,243 | 0.1% |
| South America | 980,799 | 4.5% |
| South Central Asia | 144,811 | 0.7% |
| South Eastern Asia | 174,892 | 0.8% |
| Southern Europe | 71,422 | 0.3% |
| Spain | 21,571 | 0.1% |
| Sri Lanka | 2,649 | 0.0% |
| St. Vincent and the Grenadines | 2,578 | 0.0% |
| Sudan | 1,317 | 0.0% |
| Sweden | 4,700 | 0.0% |
| Switzerland | 3,349 | 0.0% |
| Syria | 7,299 | 0.0% |
| Taiwan | 8,002 | 0.0% |
| Thailand | 12,303 | 0.1% |
| Trinidad and Tobago | 43,642 | 0.2% |
| Turkey | 10,969 | 0.1% |
| Uganda | 640 | 0.0% |
| Ukraine | 21,886 | 0.1% |
| Uruguay | 14,809 | 0.1% |
| Uzbekistan | 2,155 | 0.0% |
| Venezuela | 262,042 | 1.2% |
| Vietnam | 60,604 | 0.3% |
| West Indies | 2,367 | 0.0% |
| Western Africa | 19,597 | 0.1% |
| Western Asia | 63,773 | 0.3% |
| Western Europe | 94,162 | 0.4% |
| Yemen | 596 | 0.0% |
| Zaire | 540 | 0.0% |
| Zimbabwe | 1,974 | 0.0% | View All 137 Rows |
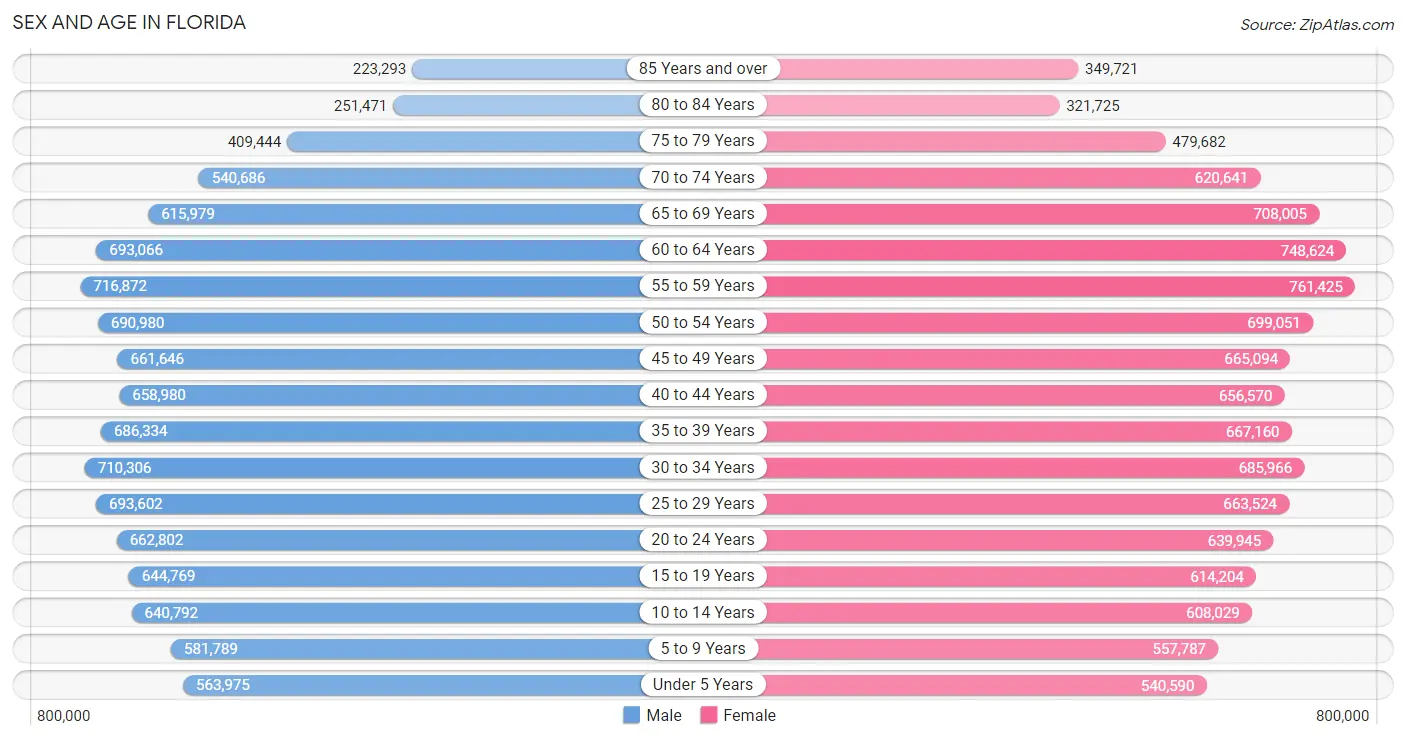
Sex and Age in Florida
Sex and Age in Florida
The most populous age groups in Florida are 55 to 59 Years (716,872 | 6.7%) for men and 55 to 59 Years (761,425 | 6.9%) for women.
| Age Bracket | Male | Female |
| Under 5 Years | 563,975 (5.3%) | 540,590 (4.9%) |
| 5 to 9 Years | 581,789 (5.5%) | 557,787 (5.1%) |
| 10 to 14 Years | 640,792 (6.0%) | 608,029 (5.5%) |
| 15 to 19 Years | 644,769 (6.1%) | 614,204 (5.6%) |
| 20 to 24 Years | 662,802 (6.2%) | 639,945 (5.8%) |
| 25 to 29 Years | 693,602 (6.5%) | 663,524 (6.0%) |
| 30 to 34 Years | 710,306 (6.7%) | 685,966 (6.2%) |
| 35 to 39 Years | 686,334 (6.5%) | 667,160 (6.1%) |
| 40 to 44 Years | 658,980 (6.2%) | 656,570 (6.0%) |
| 45 to 49 Years | 661,646 (6.2%) | 665,094 (6.0%) |
| 50 to 54 Years | 690,980 (6.5%) | 699,051 (6.4%) |
| 55 to 59 Years | 716,872 (6.7%) | 761,425 (6.9%) |
| 60 to 64 Years | 693,066 (6.5%) | 748,624 (6.8%) |
| 65 to 69 Years | 615,979 (5.8%) | 708,005 (6.4%) |
| 70 to 74 Years | 540,686 (5.1%) | 620,641 (5.7%) |
| 75 to 79 Years | 409,444 (3.8%) | 479,682 (4.4%) |
| 80 to 84 Years | 251,471 (2.4%) | 321,725 (2.9%) |
| 85 Years and over | 223,293 (2.1%) | 349,721 (3.2%) |
| Total | 10,646,786 (100.0%) | 10,987,743 (100.0%) |
Families and Households in Florida
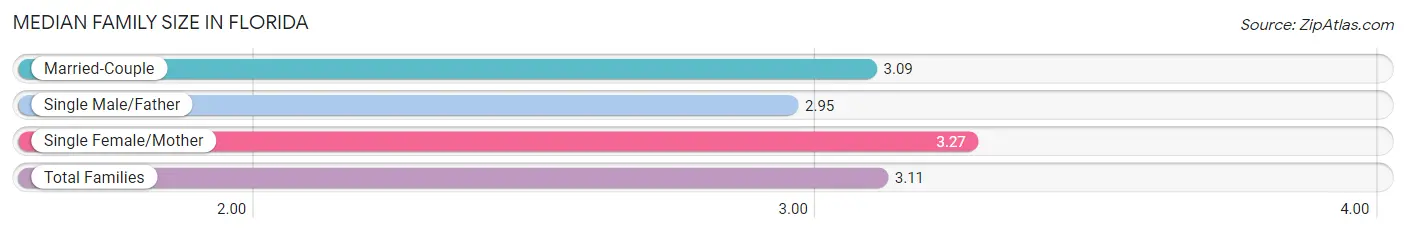
Median Family Size in Florida
The median family size in Florida is 3.11 persons per family, with single female/mother families (1,064,138 | 19.7%) accounting for the largest median family size of 3.27 persons per family. On the other hand, single male/father families (428,971 | 8.0%) represent the smallest median family size with 2.95 persons per family.
| Family Type | # Families | Family Size |
| Married-Couple | 3,905,043 (72.3%) | 3.09 |
| Single Male/Father | 428,971 (8.0%) | 2.95 |
| Single Female/Mother | 1,064,138 (19.7%) | 3.27 |
| Total Families | 5,398,152 (100.0%) | 3.11 |
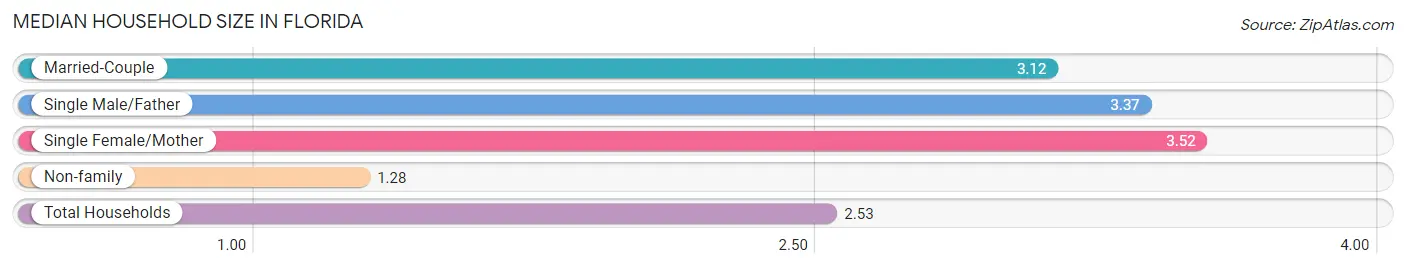
Median Household Size in Florida
The median household size in Florida is 2.53 persons per household, with single female/mother households (1,064,138 | 12.7%) accounting for the largest median household size of 3.52 persons per household. non-family households (2,955,289 | 35.4%) represent the smallest median household size with 1.28 persons per household.
| Household Type | # Households | Household Size |
| Married-Couple | 3,905,043 (46.8%) | 3.12 |
| Single Male/Father | 428,971 (5.1%) | 3.37 |
| Single Female/Mother | 1,064,138 (12.7%) | 3.52 |
| Non-family | 2,955,289 (35.4%) | 1.28 |
| Total Households | 8,353,441 (100.0%) | 2.53 |
Household Size by Marriage Status in Florida
Out of a total of 8,353,441 households in Florida, 5,398,152 (64.6%) are family households, while 2,955,289 (35.4%) are nonfamily households. The most numerous type of family households are 2-person households, comprising 2,564,673, and the most common type of nonfamily households are 1-person households, comprising 2,363,996.
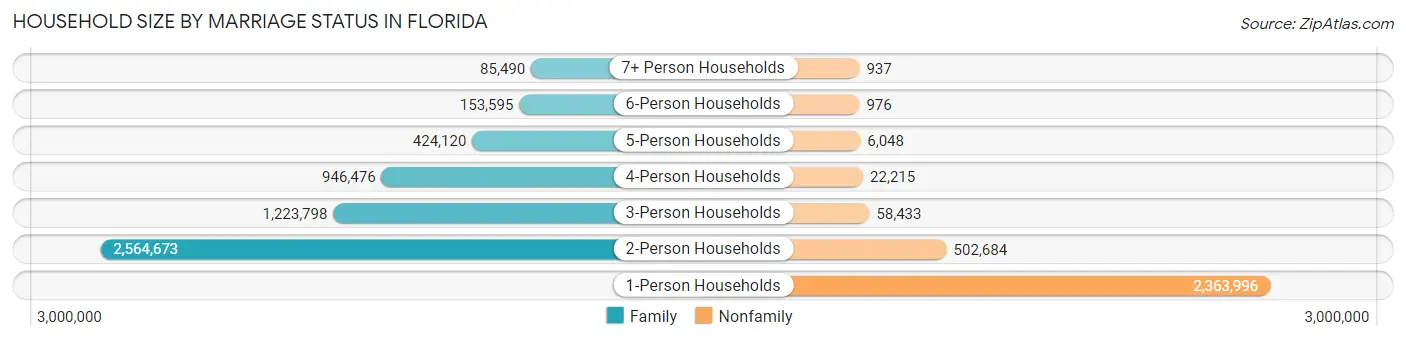
| Household Size | Family Households | Nonfamily Households |
| 1-Person Households | - | 2,363,996 (28.3%) |
| 2-Person Households | 2,564,673 (30.7%) | 502,684 (6.0%) |
| 3-Person Households | 1,223,798 (14.6%) | 58,433 (0.7%) |
| 4-Person Households | 946,476 (11.3%) | 22,215 (0.3%) |
| 5-Person Households | 424,120 (5.1%) | 6,048 (0.1%) |
| 6-Person Households | 153,595 (1.8%) | 976 (0.0%) |
| 7+ Person Households | 85,490 (1.0%) | 937 (0.0%) |
| Total | 5,398,152 (64.6%) | 2,955,289 (35.4%) |
Female Fertility in Florida
Fertility by Age in Florida
Average fertility rate in Florida is 48.0 births per 1,000 women. Women in the age bracket of 20 to 34 years have the highest fertility rate with 80.0 births per 1,000 women. Women in the age bracket of 20 to 34 years acount for 69.8% of all women with births.
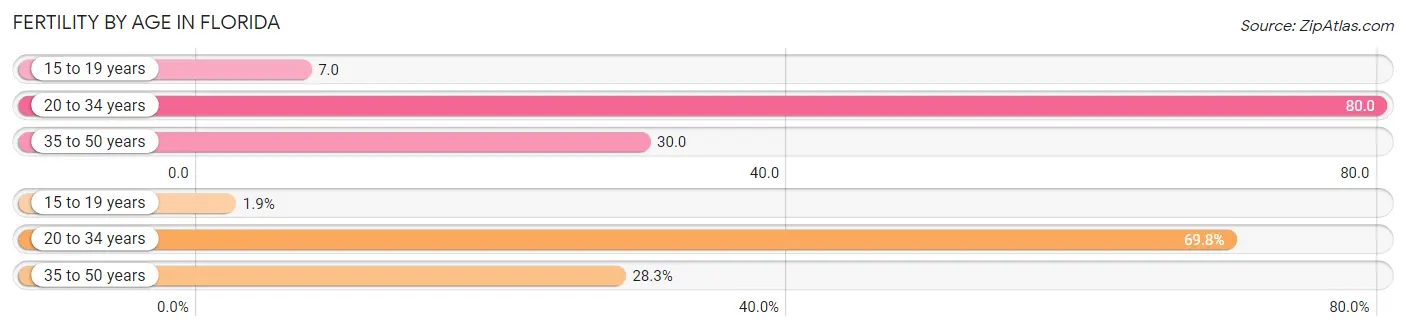
| Age Bracket | Women with Births | Births / 1,000 Women |
| 15 to 19 years | 4,307 (1.9%) | 7.0 |
| 20 to 34 years | 159,109 (69.8%) | 80.0 |
| 35 to 50 years | 64,599 (28.3%) | 30.0 |
| Total | 228,015 (100.0%) | 48.0 |
Fertility by Age by Marriage Status in Florida
62.3% of women with births (228,015) in Florida are married. The highest percentage of unmarried women with births falls into 15 to 19 years age bracket with 88.7% of them unmarried at the time of birth, while the lowest percentage of unmarried women with births belong to 35 to 50 years age bracket with 26.5% of them unmarried.
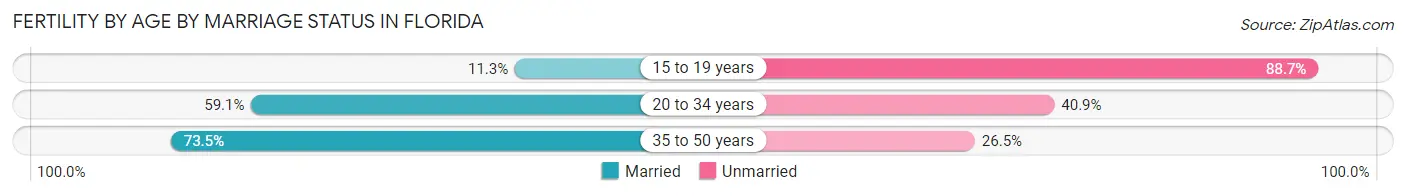
| Age Bracket | Married | Unmarried |
| 15 to 19 years | 487 (11.3%) | 3,820 (88.7%) |
| 20 to 34 years | 94,033 (59.1%) | 65,076 (40.9%) |
| 35 to 50 years | 47,480 (73.5%) | 17,119 (26.5%) |
| Total | 142,053 (62.3%) | 85,962 (37.7%) |
Fertility by Education in Florida
Average fertility rate in Florida is 48.0 births per 1,000 women. Women with the education attainment of graduate degree have the highest fertility rate of 57.0 births per 1,000 women, while women with the education attainment of less than high school have the lowest fertility at 34.0 births per 1,000 women. Women with the education attainment of college or associate's degree represent 30.5% of all women with births.
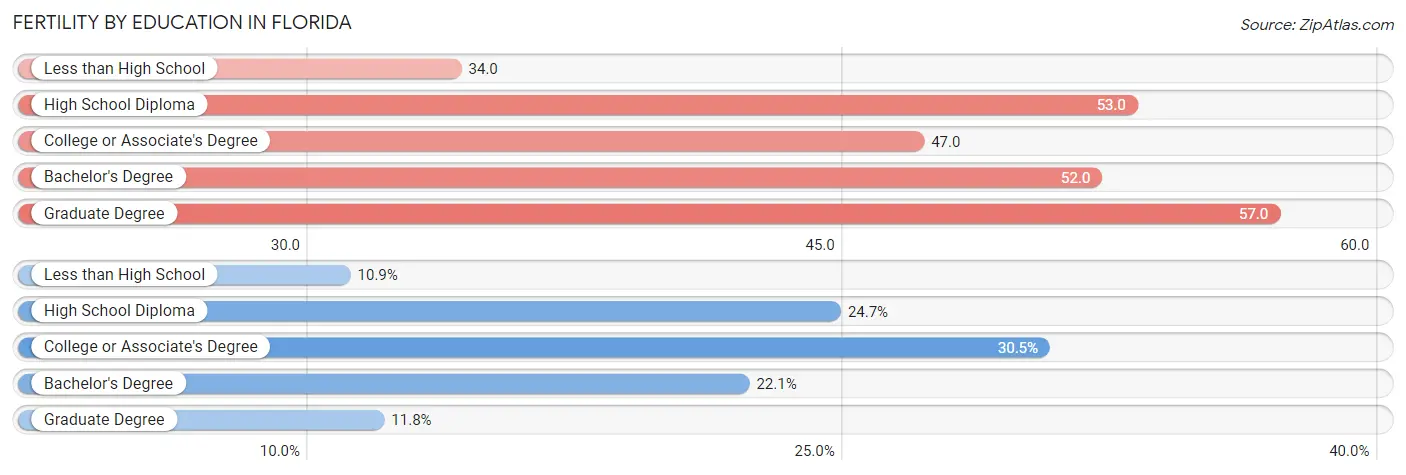
| Educational Attainment | Women with Births | Births / 1,000 Women |
| Less than High School | 24,811 (10.9%) | 34.0 |
| High School Diploma | 56,232 (24.7%) | 53.0 |
| College or Associate's Degree | 69,623 (30.5%) | 47.0 |
| Bachelor's Degree | 50,374 (22.1%) | 52.0 |
| Graduate Degree | 26,975 (11.8%) | 57.0 |
| Total | 228,015 (100.0%) | 48.0 |
Fertility by Education by Marriage Status in Florida
37.7% of women with births in Florida are unmarried. Women with the educational attainment of graduate degree are most likely to be married with 88.4% of them married at childbirth, while women with the educational attainment of high school diploma are least likely to be married with 55.6% of them unmarried at childbirth.
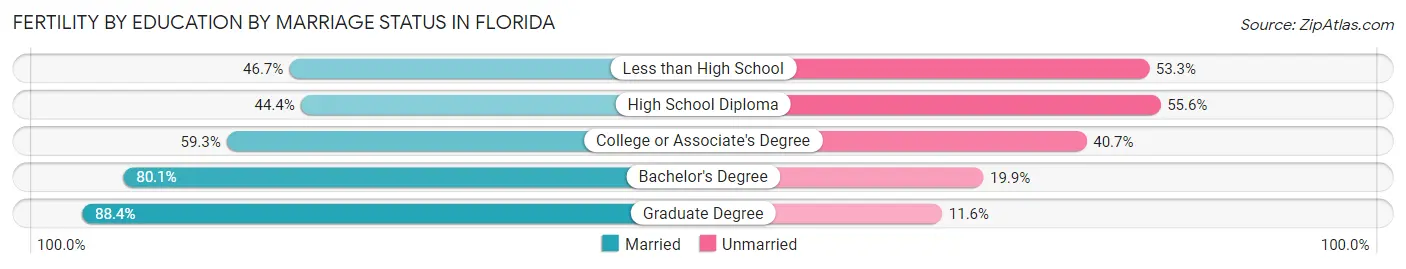
| Educational Attainment | Married | Unmarried |
| Less than High School | 11,587 (46.7%) | 13,224 (53.3%) |
| High School Diploma | 24,967 (44.4%) | 31,265 (55.6%) |
| College or Associate's Degree | 41,286 (59.3%) | 28,337 (40.7%) |
| Bachelor's Degree | 40,350 (80.1%) | 10,024 (19.9%) |
| Graduate Degree | 23,846 (88.4%) | 3,129 (11.6%) |
| Total | 142,053 (62.3%) | 85,962 (37.7%) |
Employment Characteristics in Florida
Employment by Class of Employer in Florida
Among the 9,897,435 employed individuals in Florida, private company employees (6,800,217 | 68.7%), not-for-profit organizations (653,570 | 6.6%), and local government employees (651,870 | 6.6%) make up the most common classes of employment.
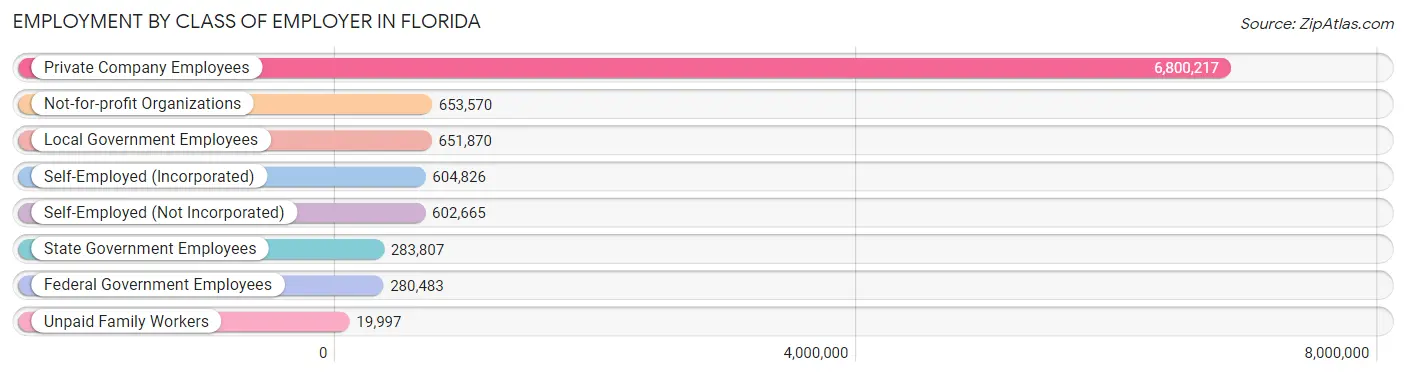
| Employer Class | # Employees | % Employees |
| Private Company Employees | 6,800,217 | 68.7% |
| Self-Employed (Incorporated) | 604,826 | 6.1% |
| Self-Employed (Not Incorporated) | 602,665 | 6.1% |
| Not-for-profit Organizations | 653,570 | 6.6% |
| Local Government Employees | 651,870 | 6.6% |
| State Government Employees | 283,807 | 2.9% |
| Federal Government Employees | 280,483 | 2.8% |
| Unpaid Family Workers | 19,997 | 0.2% |
| Total | 9,897,435 | 100.0% |
Employment Status by Age in Florida
According to the labor force statistics for Florida, out of the total population over 16 years of age (17,893,588), 59.4% or 10,628,791 individuals are in the labor force, with 5.0% or 531,440 of them unemployed. The age group with the highest labor force participation rate is 25 to 29 years, with 83.1% or 1,127,772 individuals in the labor force. Within the labor force, the 16 to 19 years age range has the highest percentage of unemployed individuals, with 15.4% or 54,493 of them being unemployed.
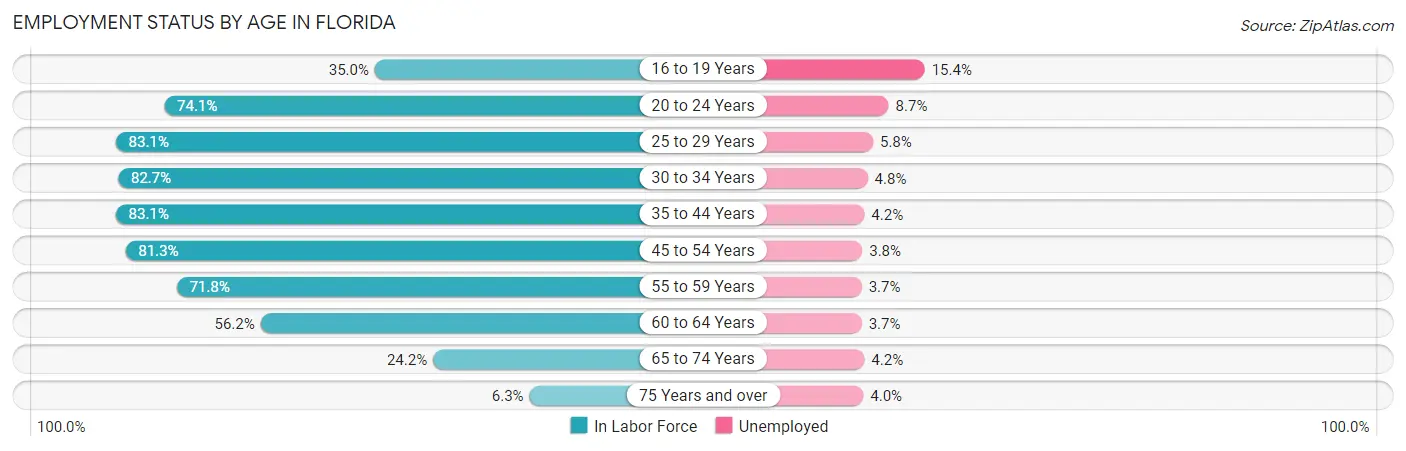
| Age Bracket | In Labor Force | Unemployed |
| 16 to 19 Years | 353,848 (35.0%) | 54,493 (15.4%) |
| 20 to 24 Years | 965,336 (74.1%) | 83,984 (8.7%) |
| 25 to 29 Years | 1,127,772 (83.1%) | 65,411 (5.8%) |
| 30 to 34 Years | 1,154,717 (82.7%) | 55,426 (4.8%) |
| 35 to 44 Years | 2,217,976 (83.1%) | 93,155 (4.2%) |
| 45 to 54 Years | 2,208,735 (81.3%) | 83,932 (3.8%) |
| 55 to 59 Years | 1,061,417 (71.8%) | 39,272 (3.7%) |
| 60 to 64 Years | 810,230 (56.2%) | 29,979 (3.7%) |
| 65 to 74 Years | 601,445 (24.2%) | 25,261 (4.2%) |
| 75 Years and over | 128,226 (6.3%) | 5,129 (4.0%) |
| Total | 10,628,791 (59.4%) | 531,440 (5.0%) |
Employment Status by Educational Attainment in Florida
According to labor force statistics for Florida, 77.6% of individuals (8,581,939) out of the total population between 25 and 64 years of age (11,059,200) are in the labor force, with 4.3% or 369,023 of them being unemployed. The group with the highest labor force participation rate are those with the educational attainment of bachelor's degree or higher, with 84.7% or 3,098,674 individuals in the labor force. Within the labor force, individuals with less than high school education have the highest percentage of unemployment, with 7.0% or 48,242 of them being unemployed.
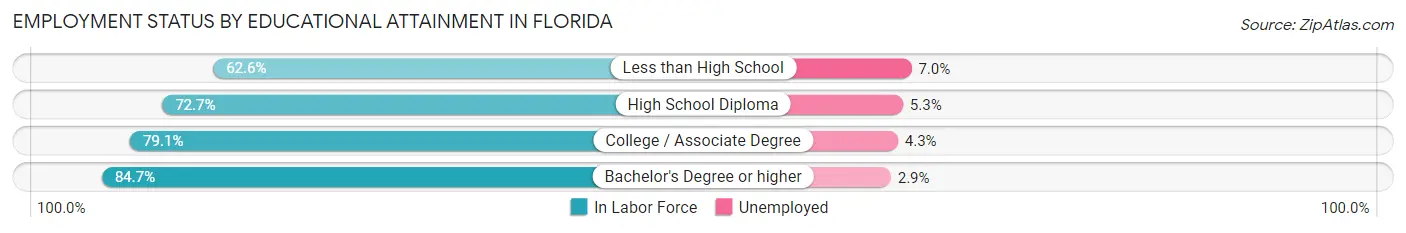
| Educational Attainment | In Labor Force | Unemployed |
| Less than High School | 689,173 (62.6%) | 77,064 (7.0%) |
| High School Diploma | 2,165,645 (72.7%) | 157,881 (5.3%) |
| College / Associate Degree | 2,626,906 (79.1%) | 142,803 (4.3%) |
| Bachelor's Degree or higher | 3,098,674 (84.7%) | 106,094 (2.9%) |
| Total | 8,581,939 (77.6%) | 475,546 (4.3%) |
Employment Occupations by Sex in Florida
Management, Business, Science and Arts Occupations
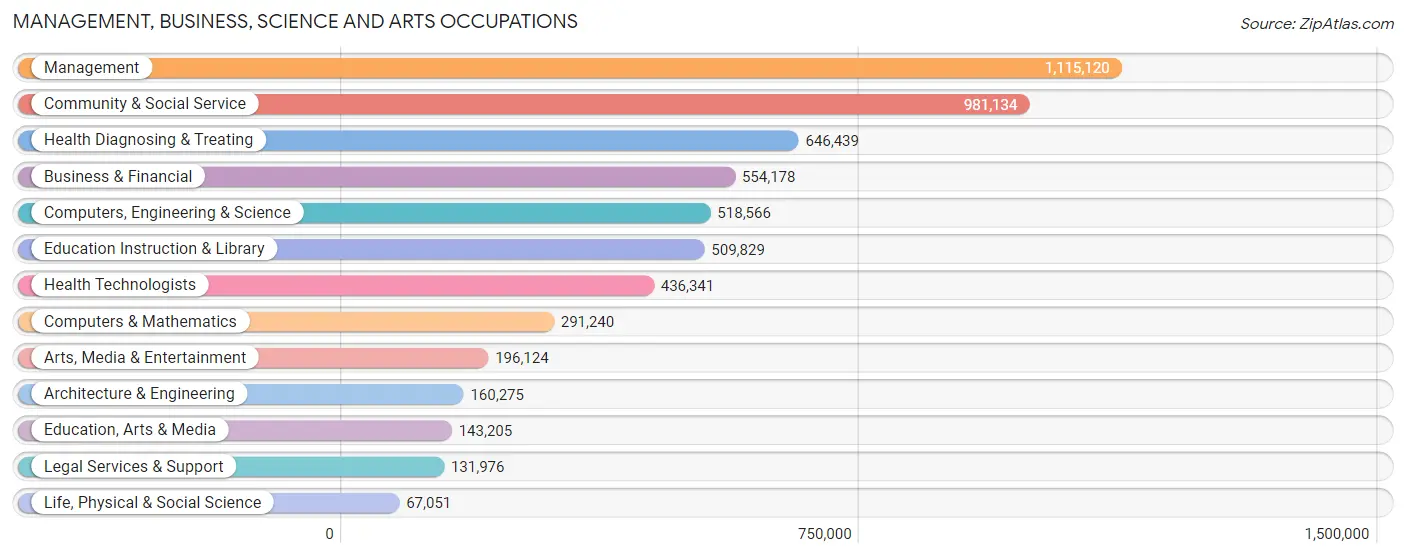
The most common Management, Business, Science and Arts occupations in Florida are Management (1,115,120 | 11.1%), Community & Social Service (981,134 | 9.8%), Health Diagnosing & Treating (646,439 | 6.5%), Business & Financial (554,178 | 5.5%), and Computers, Engineering & Science (518,566 | 5.2%).
Management, Business, Science and Arts Occupations by Sex
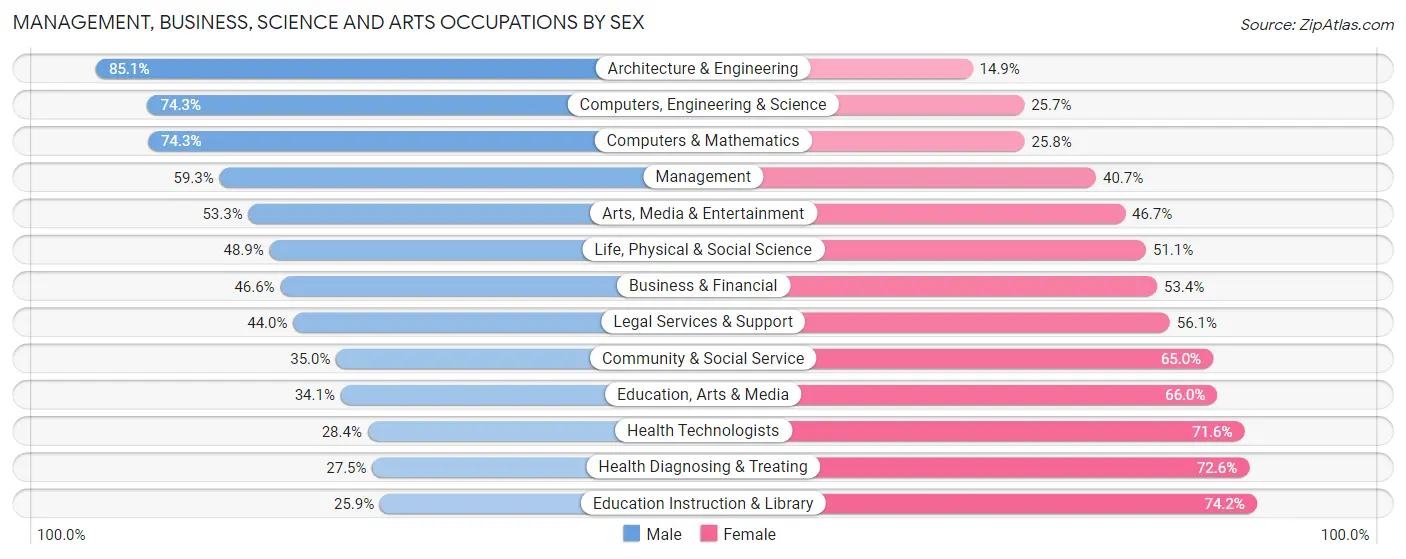
Within the Management, Business, Science and Arts occupations in Florida, the most male-oriented occupations are Architecture & Engineering (85.1%), Computers, Engineering & Science (74.3%), and Computers & Mathematics (74.3%), while the most female-oriented occupations are Education Instruction & Library (74.2%), Health Diagnosing & Treating (72.6%), and Health Technologists (71.6%).
| Occupation | Male | Female |
| Management | 661,662 (59.3%) | 453,458 (40.7%) |
| Business & Financial | 258,433 (46.6%) | 295,745 (53.4%) |
| Computers, Engineering & Science | 385,439 (74.3%) | 133,127 (25.7%) |
| Computers & Mathematics | 216,255 (74.3%) | 74,985 (25.8%) |
| Architecture & Engineering | 136,389 (85.1%) | 23,886 (14.9%) |
| Life, Physical & Social Science | 32,795 (48.9%) | 34,256 (51.1%) |
| Community & Social Service | 343,089 (35.0%) | 638,045 (65.0%) |
| Education, Arts & Media | 48,763 (34.1%) | 94,442 (65.9%) |
| Legal Services & Support | 58,006 (44.0%) | 73,970 (56.0%) |
| Education Instruction & Library | 131,795 (25.9%) | 378,034 (74.2%) |
| Arts, Media & Entertainment | 104,525 (53.3%) | 91,599 (46.7%) |
| Health Diagnosing & Treating | 177,430 (27.5%) | 469,009 (72.6%) |
| Health Technologists | 124,027 (28.4%) | 312,314 (71.6%) |
| Total (Category) | 1,826,053 (47.9%) | 1,989,384 (52.1%) |
| Total (Overall) | 5,270,242 (52.6%) | 4,753,495 (47.4%) |
Services Occupations
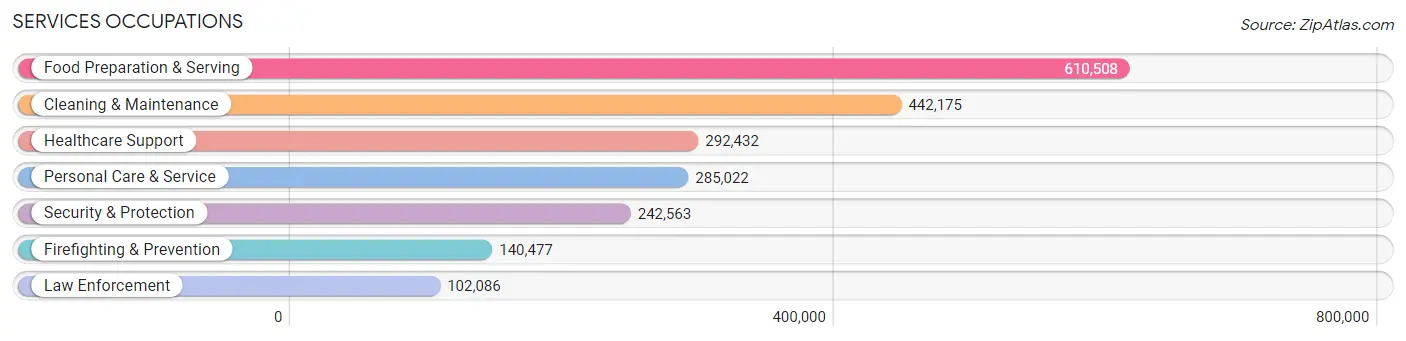
The most common Services occupations in Florida are Food Preparation & Serving (610,508 | 6.1%), Cleaning & Maintenance (442,175 | 4.4%), Healthcare Support (292,432 | 2.9%), Personal Care & Service (285,022 | 2.8%), and Security & Protection (242,563 | 2.4%).
Services Occupations by Sex
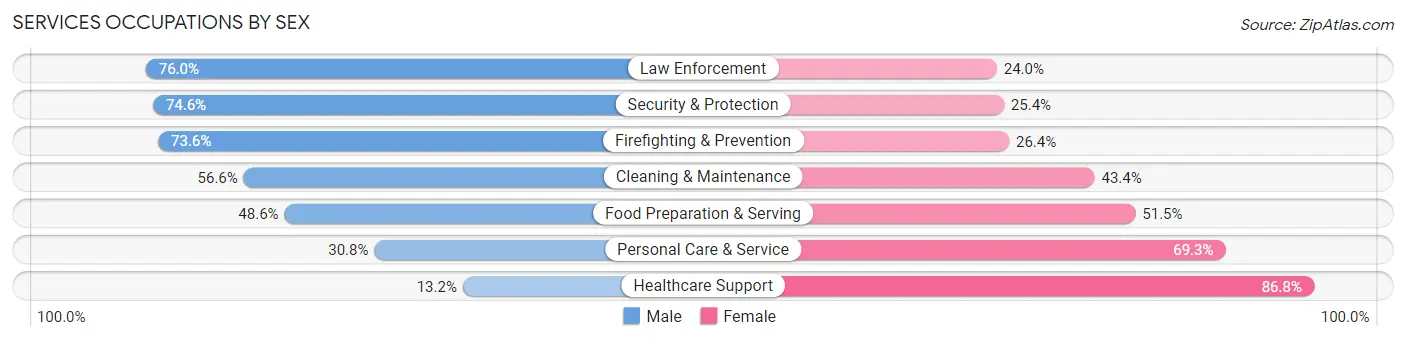
Within the Services occupations in Florida, the most male-oriented occupations are Law Enforcement (76.0%), Security & Protection (74.6%), and Firefighting & Prevention (73.6%), while the most female-oriented occupations are Healthcare Support (86.8%), Personal Care & Service (69.3%), and Food Preparation & Serving (51.4%).
| Occupation | Male | Female |
| Healthcare Support | 38,718 (13.2%) | 253,714 (86.8%) |
| Security & Protection | 180,911 (74.6%) | 61,652 (25.4%) |
| Firefighting & Prevention | 103,333 (73.6%) | 37,144 (26.4%) |
| Law Enforcement | 77,578 (76.0%) | 24,508 (24.0%) |
| Food Preparation & Serving | 296,432 (48.5%) | 314,076 (51.4%) |
| Cleaning & Maintenance | 250,391 (56.6%) | 191,784 (43.4%) |
| Personal Care & Service | 87,647 (30.7%) | 197,375 (69.3%) |
| Total (Category) | 854,099 (45.6%) | 1,018,601 (54.4%) |
| Total (Overall) | 5,270,242 (52.6%) | 4,753,495 (47.4%) |
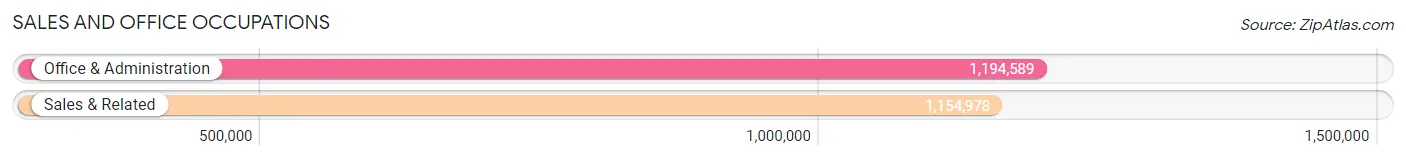
Sales and Office Occupations
The most common Sales and Office occupations in Florida are Office & Administration (1,194,589 | 11.9%), and Sales & Related (1,154,978 | 11.5%).
Sales and Office Occupations by Sex
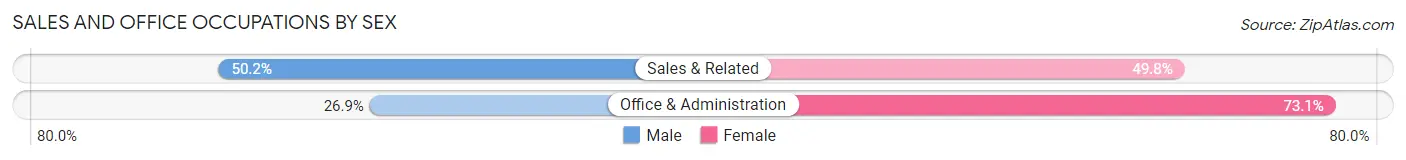
| Occupation | Male | Female |
| Sales & Related | 579,358 (50.2%) | 575,620 (49.8%) |
| Office & Administration | 321,480 (26.9%) | 873,109 (73.1%) |
| Total (Category) | 900,838 (38.3%) | 1,448,729 (61.7%) |
| Total (Overall) | 5,270,242 (52.6%) | 4,753,495 (47.4%) |
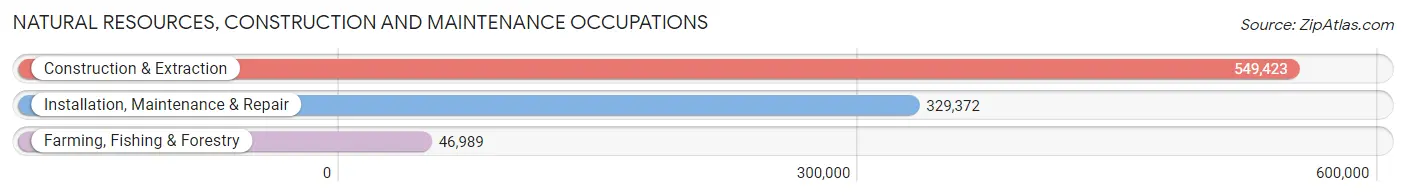
Natural Resources, Construction and Maintenance Occupations
The most common Natural Resources, Construction and Maintenance occupations in Florida are Construction & Extraction (549,423 | 5.5%), Installation, Maintenance & Repair (329,372 | 3.3%), and Farming, Fishing & Forestry (46,989 | 0.5%).
Natural Resources, Construction and Maintenance Occupations by Sex
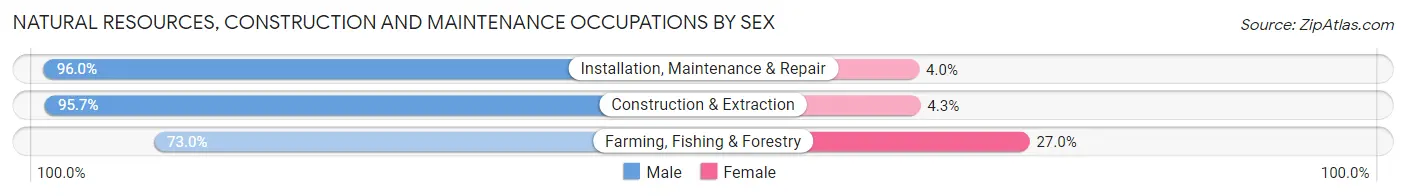
| Occupation | Male | Female |
| Farming, Fishing & Forestry | 34,321 (73.0%) | 12,668 (27.0%) |
| Construction & Extraction | 526,043 (95.7%) | 23,380 (4.3%) |
| Installation, Maintenance & Repair | 316,205 (96.0%) | 13,167 (4.0%) |
| Total (Category) | 876,569 (94.7%) | 49,215 (5.3%) |
| Total (Overall) | 5,270,242 (52.6%) | 4,753,495 (47.4%) |
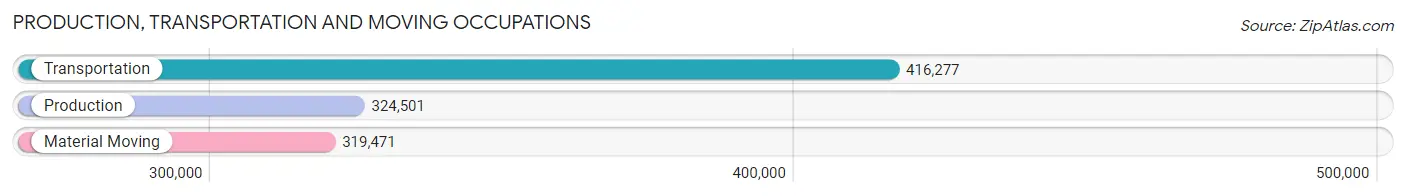
Production, Transportation and Moving Occupations
The most common Production, Transportation and Moving occupations in Florida are Transportation (416,277 | 4.2%), Production (324,501 | 3.2%), and Material Moving (319,471 | 3.2%).
Production, Transportation and Moving Occupations by Sex
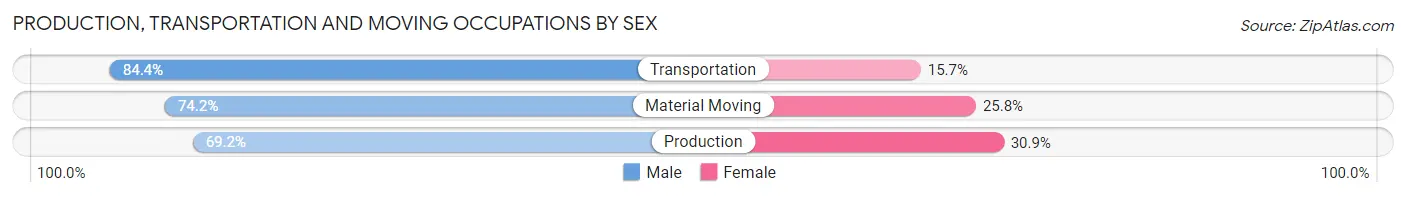
| Occupation | Male | Female |
| Production | 224,385 (69.2%) | 100,116 (30.8%) |
| Transportation | 351,124 (84.4%) | 65,153 (15.7%) |
| Material Moving | 237,174 (74.2%) | 82,297 (25.8%) |
| Total (Category) | 812,683 (76.6%) | 247,566 (23.4%) |
| Total (Overall) | 5,270,242 (52.6%) | 4,753,495 (47.4%) |
Employment Industries by Sex in Florida
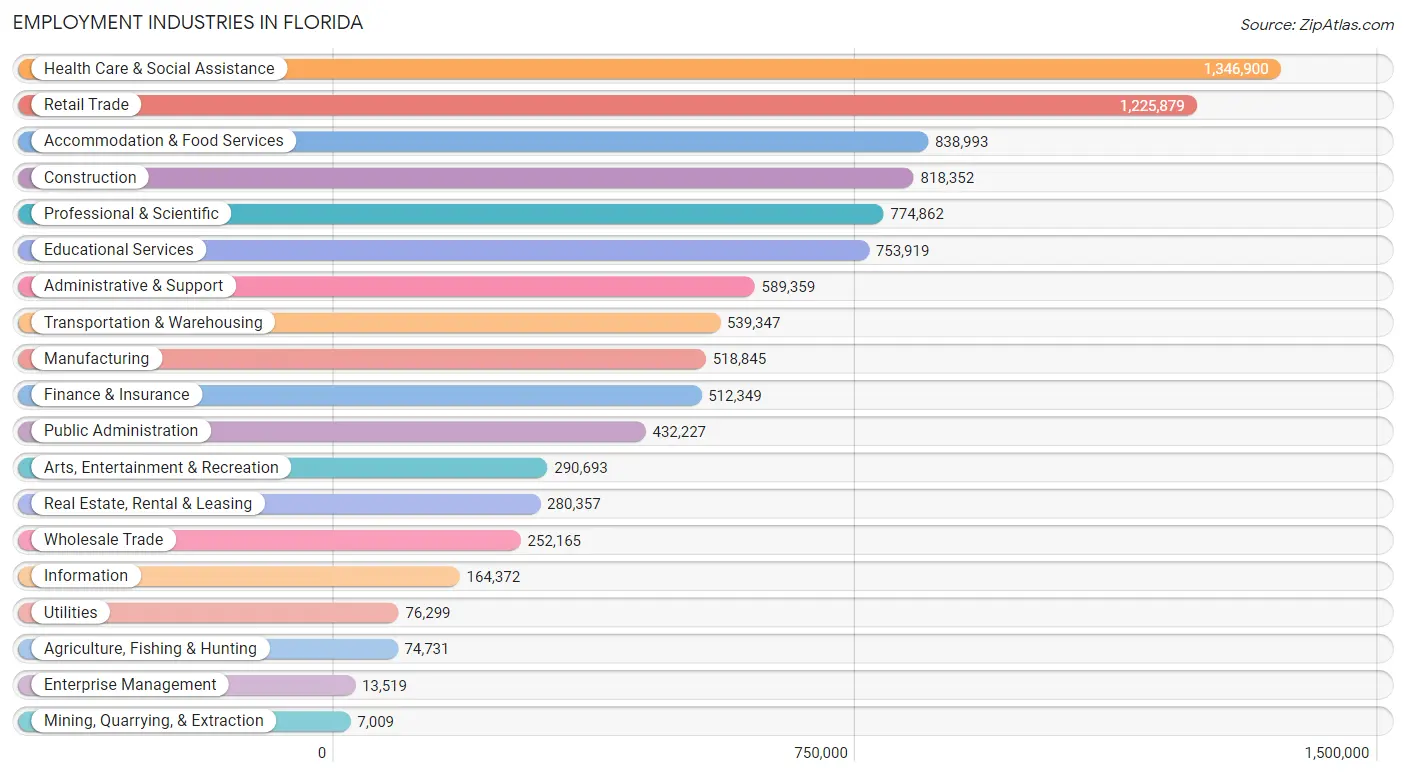
Employment Industries in Florida
The major employment industries in Florida include Health Care & Social Assistance (1,346,900 | 13.4%), Retail Trade (1,225,879 | 12.2%), Accommodation & Food Services (838,993 | 8.4%), Construction (818,352 | 8.2%), and Professional & Scientific (774,862 | 7.7%).
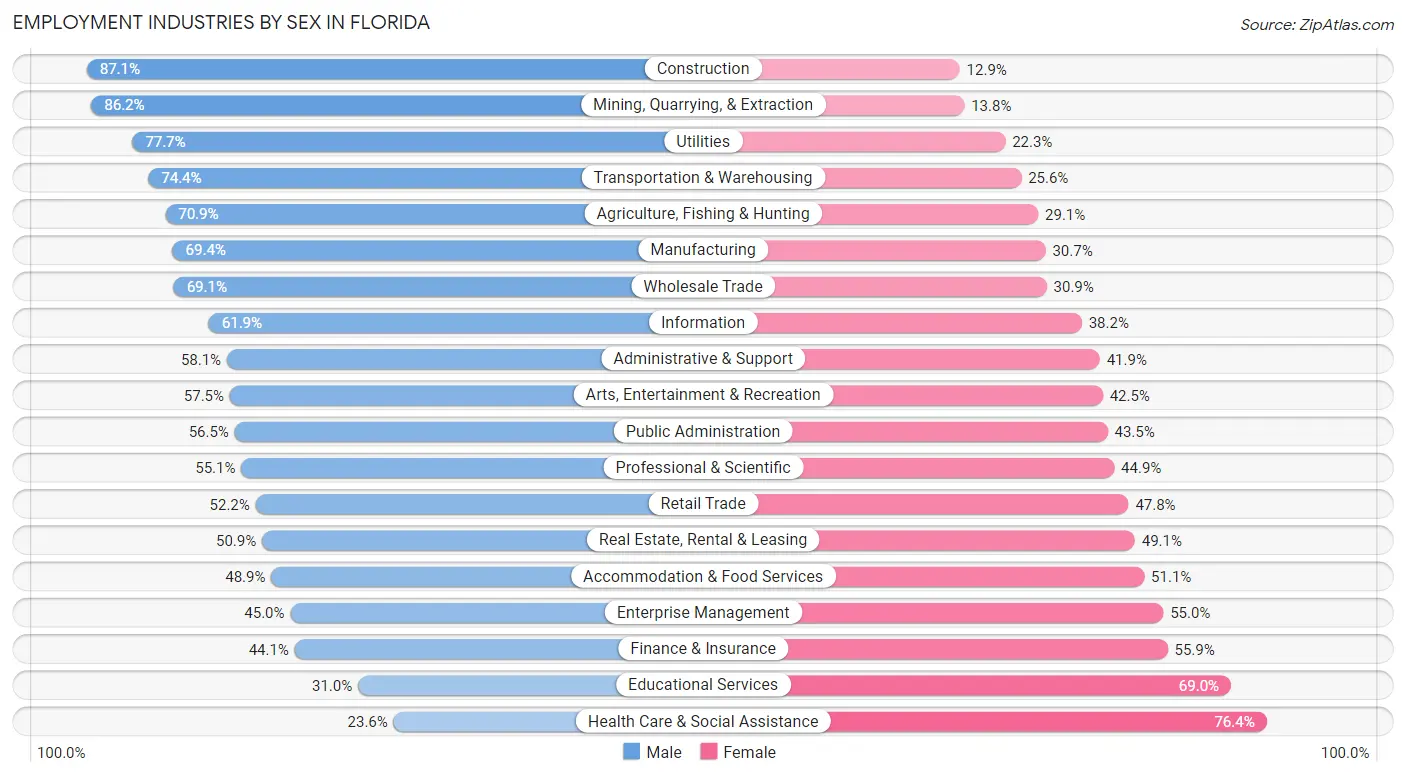
Employment Industries by Sex in Florida
The Florida industries that see more men than women are Construction (87.1%), Mining, Quarrying, & Extraction (86.2%), and Utilities (77.7%), whereas the industries that tend to have a higher number of women are Health Care & Social Assistance (76.4%), Educational Services (69.0%), and Finance & Insurance (55.9%).
| Industry | Male | Female |
| Agriculture, Fishing & Hunting | 52,971 (70.9%) | 21,760 (29.1%) |
| Mining, Quarrying, & Extraction | 6,040 (86.2%) | 969 (13.8%) |
| Construction | 712,978 (87.1%) | 105,374 (12.9%) |
| Manufacturing | 359,815 (69.4%) | 159,030 (30.6%) |
| Wholesale Trade | 174,299 (69.1%) | 77,866 (30.9%) |
| Retail Trade | 639,670 (52.2%) | 586,209 (47.8%) |
| Transportation & Warehousing | 401,170 (74.4%) | 138,177 (25.6%) |
| Utilities | 59,278 (77.7%) | 17,021 (22.3%) |
| Information | 101,669 (61.9%) | 62,703 (38.2%) |
| Finance & Insurance | 225,909 (44.1%) | 286,440 (55.9%) |
| Real Estate, Rental & Leasing | 142,577 (50.9%) | 137,780 (49.1%) |
| Professional & Scientific | 427,250 (55.1%) | 347,612 (44.9%) |
| Enterprise Management | 6,082 (45.0%) | 7,437 (55.0%) |
| Administrative & Support | 342,559 (58.1%) | 246,800 (41.9%) |
| Educational Services | 233,531 (31.0%) | 520,388 (69.0%) |
| Health Care & Social Assistance | 318,110 (23.6%) | 1,028,790 (76.4%) |
| Arts, Entertainment & Recreation | 167,189 (57.5%) | 123,504 (42.5%) |
| Accommodation & Food Services | 410,531 (48.9%) | 428,462 (51.1%) |
| Public Administration | 244,241 (56.5%) | 187,986 (43.5%) |
| Total | 5,270,242 (52.6%) | 4,753,495 (47.4%) |
Education in Florida
School Enrollment in Florida
The most common levels of schooling among the 4,796,025 students in Florida are college / undergraduate (1,097,277 | 22.9%), high school (1,007,418 | 21.0%), and middle school (983,091 | 20.5%).
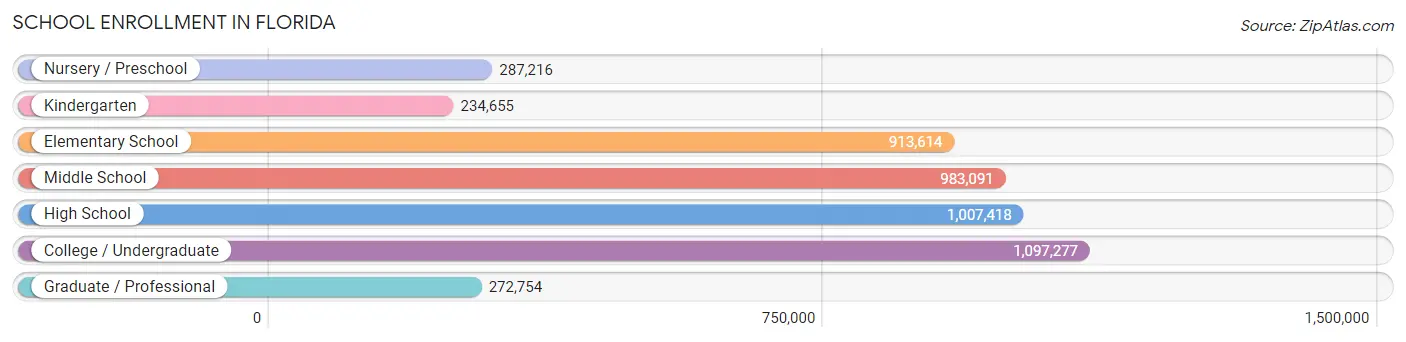
| School Level | # Students | % Students |
| Nursery / Preschool | 287,216 | 6.0% |
| Kindergarten | 234,655 | 4.9% |
| Elementary School | 913,614 | 19.1% |
| Middle School | 983,091 | 20.5% |
| High School | 1,007,418 | 21.0% |
| College / Undergraduate | 1,097,277 | 22.9% |
| Graduate / Professional | 272,754 | 5.7% |
| Total | 4,796,025 | 100.0% |
School Enrollment by Age by Funding Source in Florida
Out of a total of 4,796,025 students who are enrolled in schools in Florida, 935,225 (19.5%) attend a private institution, while the remaining 3,860,800 (80.5%) are enrolled in public schools. The age group of 3 to 4 year olds has the highest likelihood of being enrolled in private schools, with 105,963 (46.0% in the age bracket) enrolled. Conversely, the age group of 15 to 17 year olds has the lowest likelihood of being enrolled in a private school, with 622,778 (87.0% in the age bracket) attending a public institution.
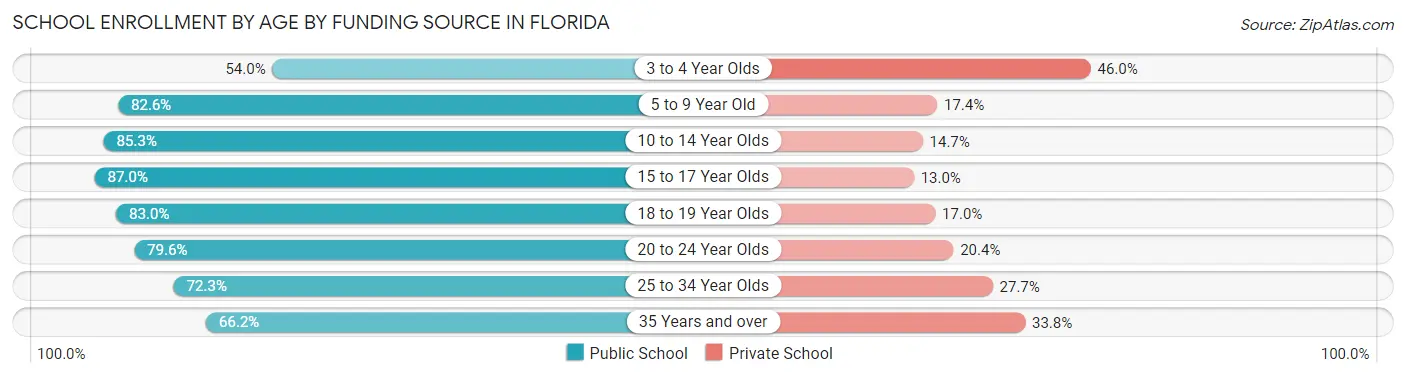
| Age Bracket | Public School | Private School |
| 3 to 4 Year Olds | 124,433 (54.0%) | 105,963 (46.0%) |
| 5 to 9 Year Old | 891,776 (82.6%) | 187,708 (17.4%) |
| 10 to 14 Year Olds | 1,039,028 (85.3%) | 179,060 (14.7%) |
| 15 to 17 Year Olds | 622,778 (87.0%) | 93,347 (13.0%) |
| 18 to 19 Year Olds | 317,504 (83.0%) | 65,209 (17.0%) |
| 20 to 24 Year Olds | 429,998 (79.6%) | 110,237 (20.4%) |
| 25 to 34 Year Olds | 233,626 (72.3%) | 89,686 (27.7%) |
| 35 Years and over | 202,414 (66.2%) | 103,258 (33.8%) |
| Total | 3,860,800 (80.5%) | 935,225 (19.5%) |
Educational Attainment by Field of Study in Florida
Business (1,272,085 | 23.7%), education (646,706 | 12.1%), science & technology (582,874 | 10.9%), engineering (413,563 | 7.7%), and social sciences (389,097 | 7.3%) are the most common fields of study among 5,363,050 individuals in Florida who have obtained a bachelor's degree or higher.
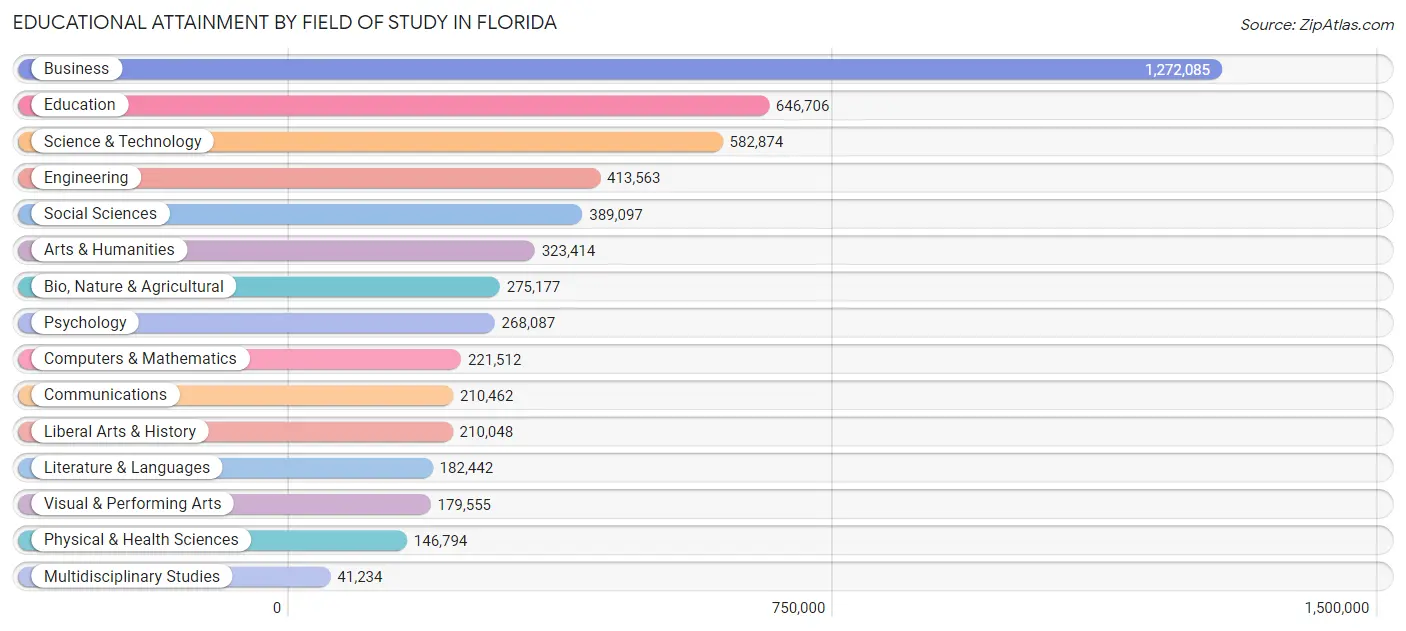
| Field of Study | # Graduates | % Graduates |
| Computers & Mathematics | 221,512 | 4.1% |
| Bio, Nature & Agricultural | 275,177 | 5.1% |
| Physical & Health Sciences | 146,794 | 2.7% |
| Psychology | 268,087 | 5.0% |
| Social Sciences | 389,097 | 7.3% |
| Engineering | 413,563 | 7.7% |
| Multidisciplinary Studies | 41,234 | 0.8% |
| Science & Technology | 582,874 | 10.9% |
| Business | 1,272,085 | 23.7% |
| Education | 646,706 | 12.1% |
| Literature & Languages | 182,442 | 3.4% |
| Liberal Arts & History | 210,048 | 3.9% |
| Visual & Performing Arts | 179,555 | 3.4% |
| Communications | 210,462 | 3.9% |
| Arts & Humanities | 323,414 | 6.0% |
| Total | 5,363,050 | 100.0% |
Transportation & Commute in Florida
Vehicle Availability by Sex in Florida
The most prevalent vehicle ownership categories in Florida are males with 2 vehicles (2,353,358, accounting for 45.2%) and females with 2 vehicles (1,977,556, making up 50.8%).
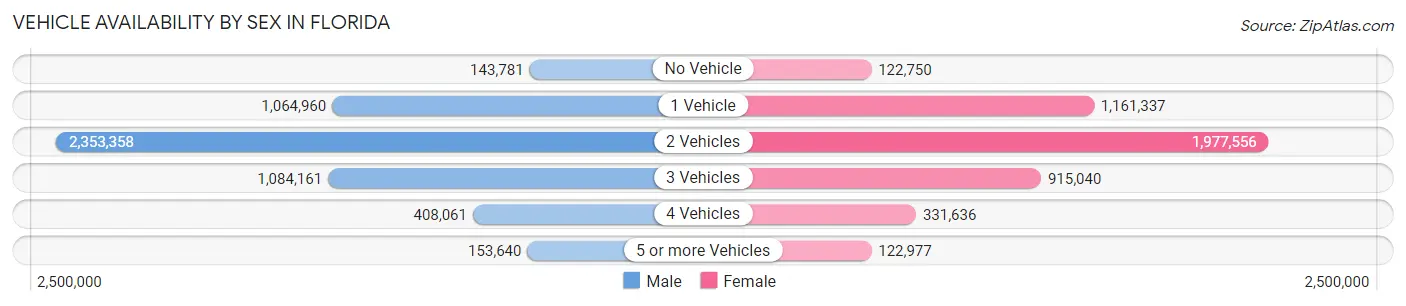
| Vehicles Available | Male | Female |
| No Vehicle | 143,781 (2.8%) | 122,750 (2.6%) |
| 1 Vehicle | 1,064,960 (20.4%) | 1,161,337 (25.1%) |
| 2 Vehicles | 2,353,358 (45.2%) | 1,977,556 (42.7%) |
| 3 Vehicles | 1,084,161 (20.8%) | 915,040 (19.8%) |
| 4 Vehicles | 408,061 (7.8%) | 331,636 (7.2%) |
| 5 or more Vehicles | 153,640 (2.9%) | 122,977 (2.7%) |
| Total | 5,207,961 (100.0%) | 4,631,296 (100.0%) |
Commute Time in Florida
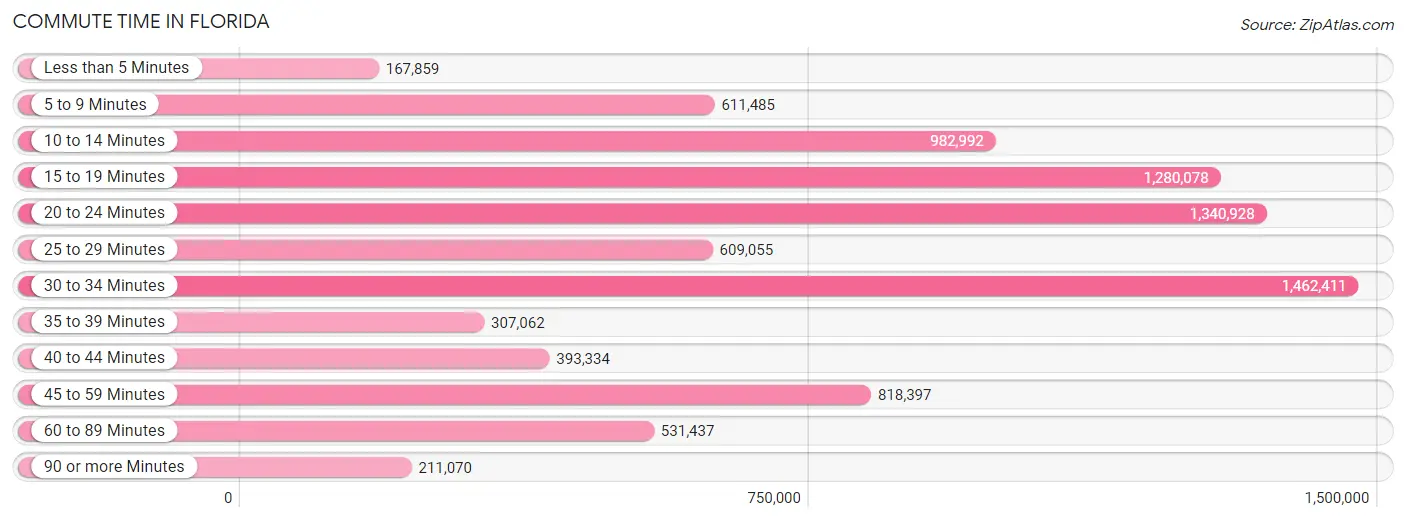
The most frequently occuring commute durations in Florida are 30 to 34 minutes (1,462,411 commuters, 16.8%), 20 to 24 minutes (1,340,928 commuters, 15.4%), and 15 to 19 minutes (1,280,078 commuters, 14.7%).
| Commute Time | # Commuters | % Commuters |
| Less than 5 Minutes | 167,859 | 1.9% |
| 5 to 9 Minutes | 611,485 | 7.0% |
| 10 to 14 Minutes | 982,992 | 11.3% |
| 15 to 19 Minutes | 1,280,078 | 14.7% |
| 20 to 24 Minutes | 1,340,928 | 15.4% |
| 25 to 29 Minutes | 609,055 | 7.0% |
| 30 to 34 Minutes | 1,462,411 | 16.8% |
| 35 to 39 Minutes | 307,062 | 3.5% |
| 40 to 44 Minutes | 393,334 | 4.5% |
| 45 to 59 Minutes | 818,397 | 9.4% |
| 60 to 89 Minutes | 531,437 | 6.1% |
| 90 or more Minutes | 211,070 | 2.4% |
Commute Time by Sex in Florida
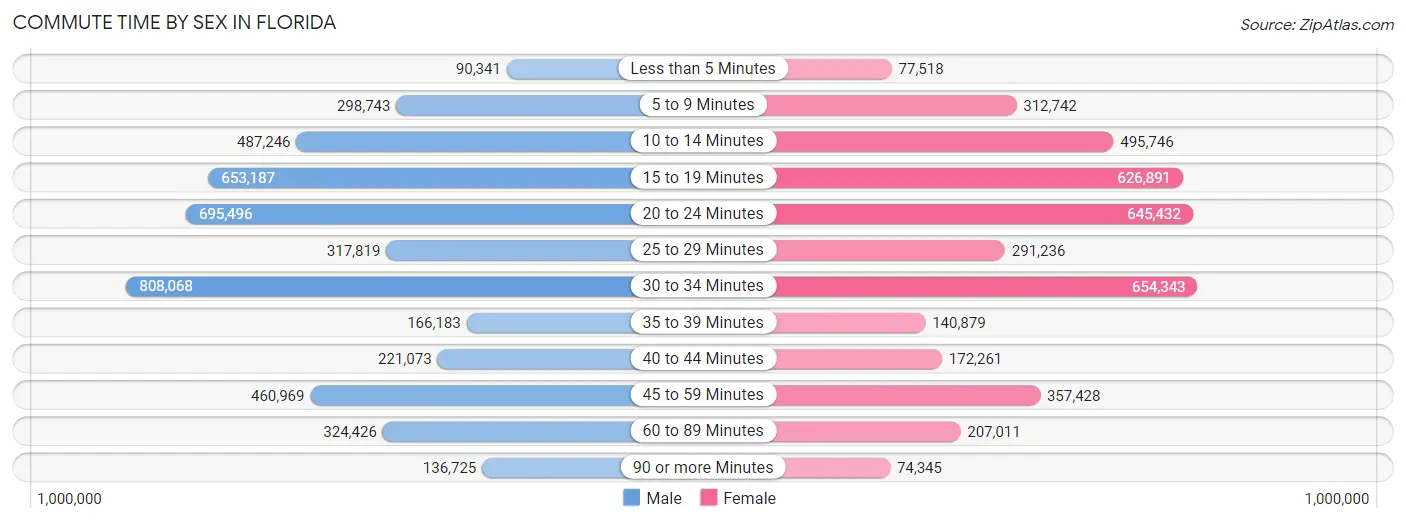
The most common commute times in Florida are 30 to 34 minutes (808,068 commuters, 17.3%) for males and 30 to 34 minutes (654,343 commuters, 16.1%) for females.
| Commute Time | Male | Female |
| Less than 5 Minutes | 90,341 (1.9%) | 77,518 (1.9%) |
| 5 to 9 Minutes | 298,743 (6.4%) | 312,742 (7.7%) |
| 10 to 14 Minutes | 487,246 (10.5%) | 495,746 (12.2%) |
| 15 to 19 Minutes | 653,187 (14.0%) | 626,891 (15.5%) |
| 20 to 24 Minutes | 695,496 (14.9%) | 645,432 (15.9%) |
| 25 to 29 Minutes | 317,819 (6.8%) | 291,236 (7.2%) |
| 30 to 34 Minutes | 808,068 (17.3%) | 654,343 (16.1%) |
| 35 to 39 Minutes | 166,183 (3.6%) | 140,879 (3.5%) |
| 40 to 44 Minutes | 221,073 (4.7%) | 172,261 (4.3%) |
| 45 to 59 Minutes | 460,969 (9.9%) | 357,428 (8.8%) |
| 60 to 89 Minutes | 324,426 (7.0%) | 207,011 (5.1%) |
| 90 or more Minutes | 136,725 (2.9%) | 74,345 (1.8%) |
Time of Departure to Work by Sex in Florida
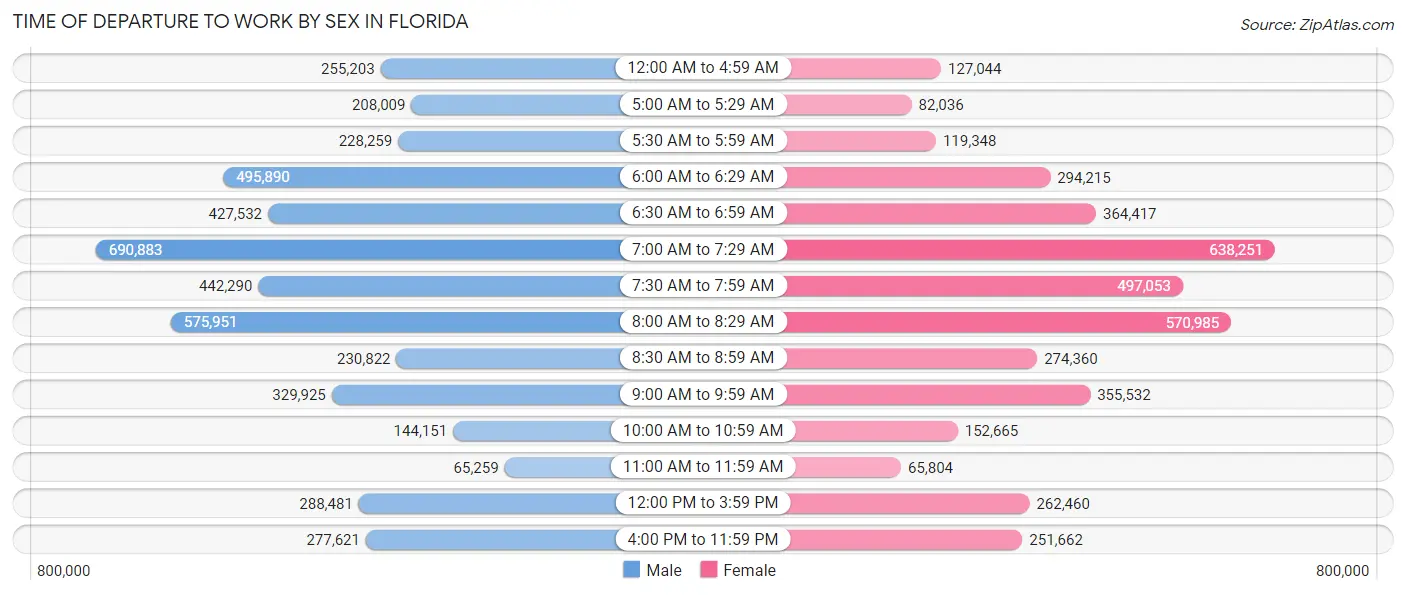
The most frequent times of departure to work in Florida are 7:00 AM to 7:29 AM (690,883, 14.8%) for males and 7:00 AM to 7:29 AM (638,251, 15.7%) for females.
| Time of Departure | Male | Female |
| 12:00 AM to 4:59 AM | 255,203 (5.5%) | 127,044 (3.1%) |
| 5:00 AM to 5:29 AM | 208,009 (4.5%) | 82,036 (2.0%) |
| 5:30 AM to 5:59 AM | 228,259 (4.9%) | 119,348 (2.9%) |
| 6:00 AM to 6:29 AM | 495,890 (10.6%) | 294,215 (7.2%) |
| 6:30 AM to 6:59 AM | 427,532 (9.2%) | 364,417 (9.0%) |
| 7:00 AM to 7:29 AM | 690,883 (14.8%) | 638,251 (15.7%) |
| 7:30 AM to 7:59 AM | 442,290 (9.5%) | 497,053 (12.3%) |
| 8:00 AM to 8:29 AM | 575,951 (12.4%) | 570,985 (14.1%) |
| 8:30 AM to 8:59 AM | 230,822 (5.0%) | 274,360 (6.8%) |
| 9:00 AM to 9:59 AM | 329,925 (7.1%) | 355,532 (8.8%) |
| 10:00 AM to 10:59 AM | 144,151 (3.1%) | 152,665 (3.8%) |
| 11:00 AM to 11:59 AM | 65,259 (1.4%) | 65,804 (1.6%) |
| 12:00 PM to 3:59 PM | 288,481 (6.2%) | 262,460 (6.5%) |
| 4:00 PM to 11:59 PM | 277,621 (6.0%) | 251,662 (6.2%) |
| Total | 4,660,276 (100.0%) | 4,055,832 (100.0%) |
Housing Occupancy in Florida
Occupancy by Ownership in Florida
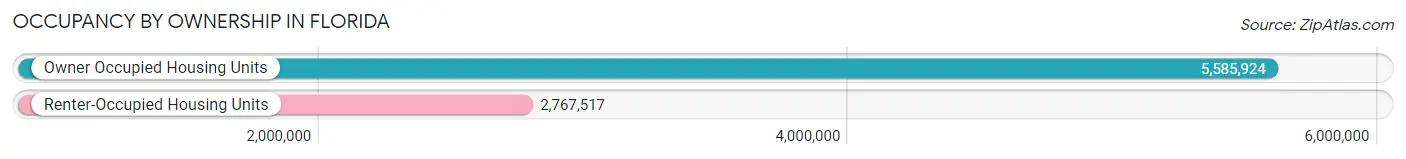
Of the total 8,353,441 dwellings in Florida, owner-occupied units account for 5,585,924 (66.9%), while renter-occupied units make up 2,767,517 (33.1%).
| Occupancy | # Housing Units | % Housing Units |
| Owner Occupied Housing Units | 5,585,924 | 66.9% |
| Renter-Occupied Housing Units | 2,767,517 | 33.1% |
| Total Occupied Housing Units | 8,353,441 | 100.0% |
Occupancy by Household Size in Florida
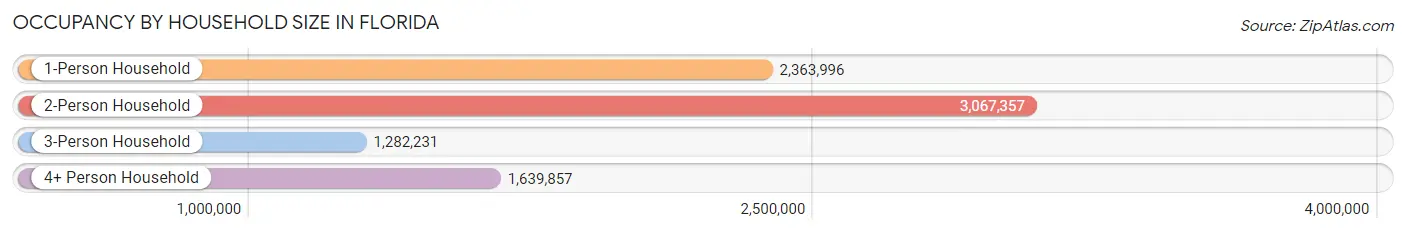
| Household Size | # Housing Units | % Housing Units |
| 1-Person Household | 2,363,996 | 28.3% |
| 2-Person Household | 3,067,357 | 36.7% |
| 3-Person Household | 1,282,231 | 15.3% |
| 4+ Person Household | 1,639,857 | 19.6% |
| Total Housing Units | 8,353,441 | 100.0% |
Occupancy by Ownership by Household Size in Florida
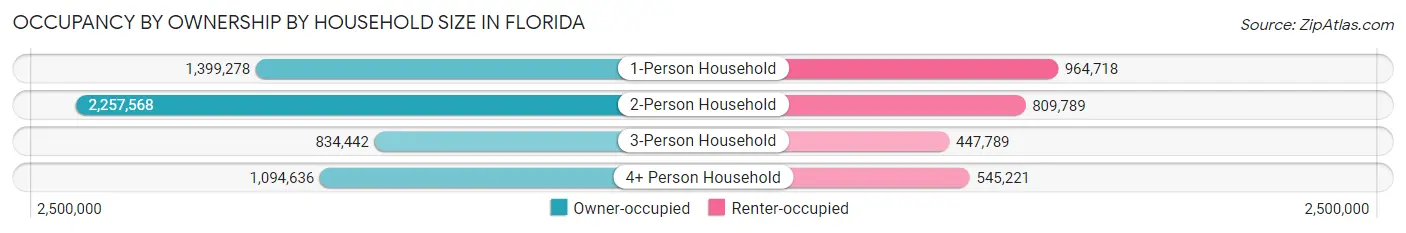
| Household Size | Owner-occupied | Renter-occupied |
| 1-Person Household | 1,399,278 (59.2%) | 964,718 (40.8%) |
| 2-Person Household | 2,257,568 (73.6%) | 809,789 (26.4%) |
| 3-Person Household | 834,442 (65.1%) | 447,789 (34.9%) |
| 4+ Person Household | 1,094,636 (66.7%) | 545,221 (33.3%) |
| Total Housing Units | 5,585,924 (66.9%) | 2,767,517 (33.1%) |
Occupancy by Educational Attainment in Florida
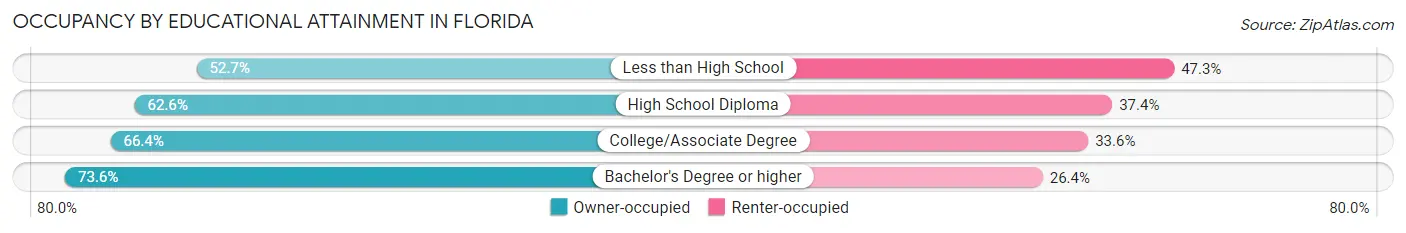
| Household Size | Owner-occupied | Renter-occupied |
| Less than High School | 377,186 (52.7%) | 338,197 (47.3%) |
| High School Diploma | 1,261,007 (62.6%) | 754,676 (37.4%) |
| College/Associate Degree | 1,736,189 (66.4%) | 880,185 (33.6%) |
| Bachelor's Degree or higher | 2,211,542 (73.6%) | 794,459 (26.4%) |
Occupancy by Age of Householder in Florida
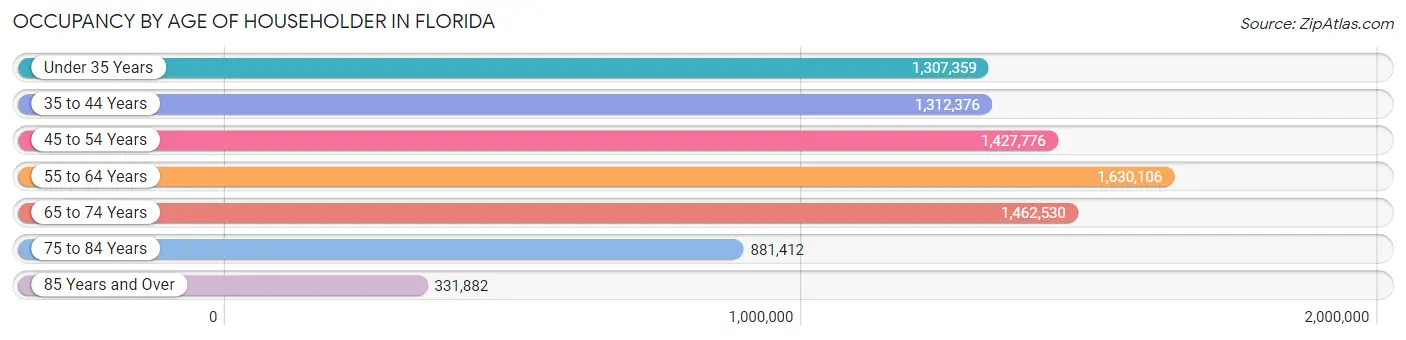
| Age Bracket | # Households | % Households |
| Under 35 Years | 1,307,359 | 15.7% |
| 35 to 44 Years | 1,312,376 | 15.7% |
| 45 to 54 Years | 1,427,776 | 17.1% |
| 55 to 64 Years | 1,630,106 | 19.5% |
| 65 to 74 Years | 1,462,530 | 17.5% |
| 75 to 84 Years | 881,412 | 10.5% |
| 85 Years and Over | 331,882 | 4.0% |
| Total | 8,353,441 | 100.0% |
Housing Finances in Florida
Median Income by Occupancy in Florida

| Occupancy Type | # Households | Median Income |
| Owner-Occupied | 5,585,924 (66.9%) | $80,831 |
| Renter-Occupied | 2,767,517 (33.1%) | $48,731 |
| Average | 8,353,441 (100.0%) | $67,917 |
Occupancy by Householder Income Bracket in Florida
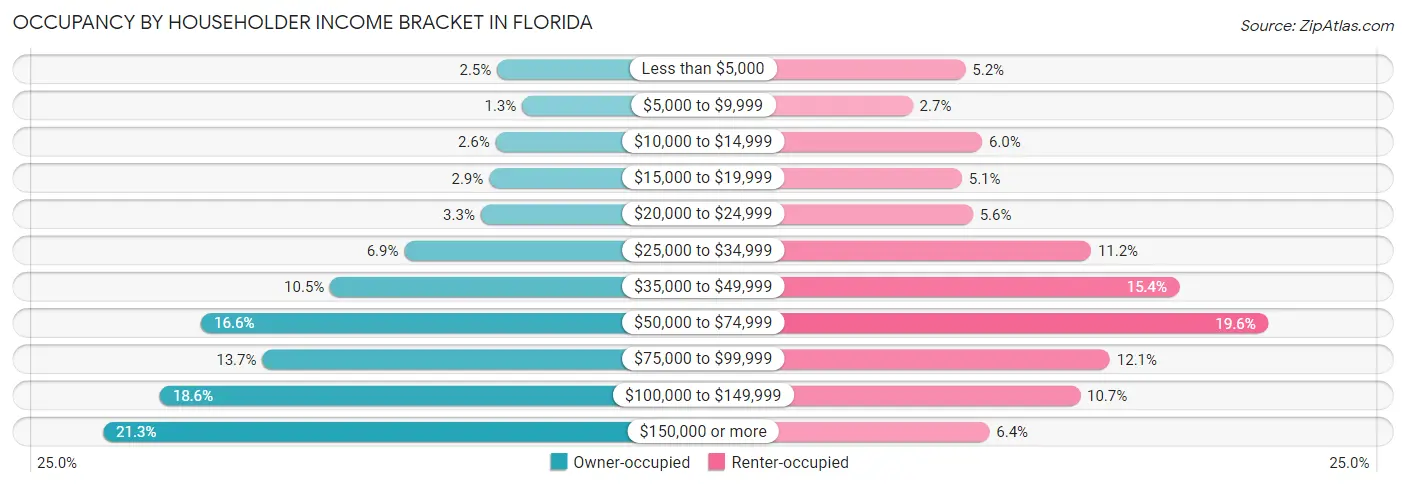
| Income Bracket | Owner-occupied | Renter-occupied |
| Less than $5,000 | 139,505 (2.5%) | 144,858 (5.2%) |
| $5,000 to $9,999 | 73,113 (1.3%) | 75,231 (2.7%) |
| $10,000 to $14,999 | 143,435 (2.6%) | 166,596 (6.0%) |
| $15,000 to $19,999 | 160,917 (2.9%) | 139,966 (5.1%) |
| $20,000 to $24,999 | 183,197 (3.3%) | 154,516 (5.6%) |
| $25,000 to $34,999 | 386,721 (6.9%) | 310,210 (11.2%) |
| $35,000 to $49,999 | 583,982 (10.4%) | 425,988 (15.4%) |
| $50,000 to $74,999 | 926,812 (16.6%) | 542,894 (19.6%) |
| $75,000 to $99,999 | 764,017 (13.7%) | 335,243 (12.1%) |
| $100,000 to $149,999 | 1,036,877 (18.6%) | 295,857 (10.7%) |
| $150,000 or more | 1,187,348 (21.3%) | 176,158 (6.4%) |
| Total | 5,585,924 (100.0%) | 2,767,517 (100.0%) |
Monthly Housing Cost Tiers in Florida
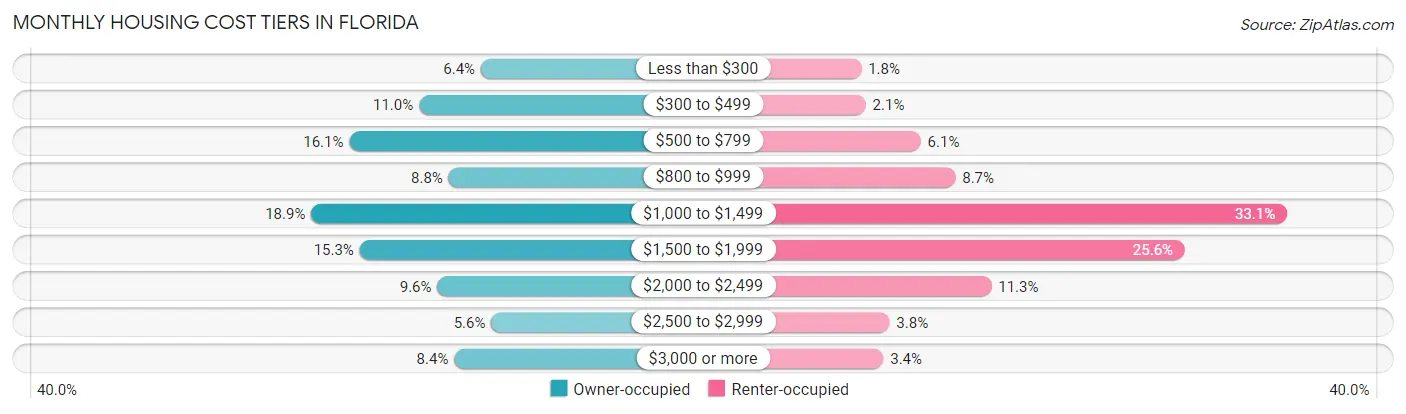
| Monthly Cost | Owner-occupied | Renter-occupied |
| Less than $300 | 356,814 (6.4%) | 48,302 (1.8%) |
| $300 to $499 | 611,794 (11.0%) | 57,436 (2.1%) |
| $500 to $799 | 898,916 (16.1%) | 169,559 (6.1%) |
| $800 to $999 | 489,931 (8.8%) | 240,201 (8.7%) |
| $1,000 to $1,499 | 1,055,184 (18.9%) | 916,228 (33.1%) |
| $1,500 to $1,999 | 855,982 (15.3%) | 708,315 (25.6%) |
| $2,000 to $2,499 | 535,997 (9.6%) | 313,651 (11.3%) |
| $2,500 to $2,999 | 314,280 (5.6%) | 105,904 (3.8%) |
| $3,000 or more | 467,026 (8.4%) | 93,413 (3.4%) |
| Total | 5,585,924 (100.0%) | 2,767,517 (100.0%) |
Physical Housing Characteristics in Florida
Housing Structures in Florida
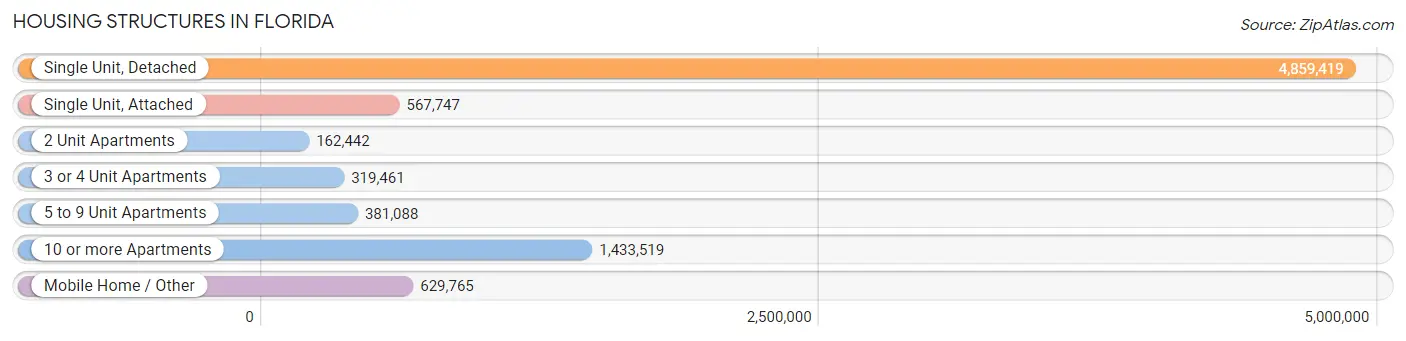
| Structure Type | # Housing Units | % Housing Units |
| Single Unit, Detached | 4,859,419 | 58.2% |
| Single Unit, Attached | 567,747 | 6.8% |
| 2 Unit Apartments | 162,442 | 1.9% |
| 3 or 4 Unit Apartments | 319,461 | 3.8% |
| 5 to 9 Unit Apartments | 381,088 | 4.6% |
| 10 or more Apartments | 1,433,519 | 17.2% |
| Mobile Home / Other | 629,765 | 7.5% |
| Total | 8,353,441 | 100.0% |
Housing Structures by Occupancy in Florida
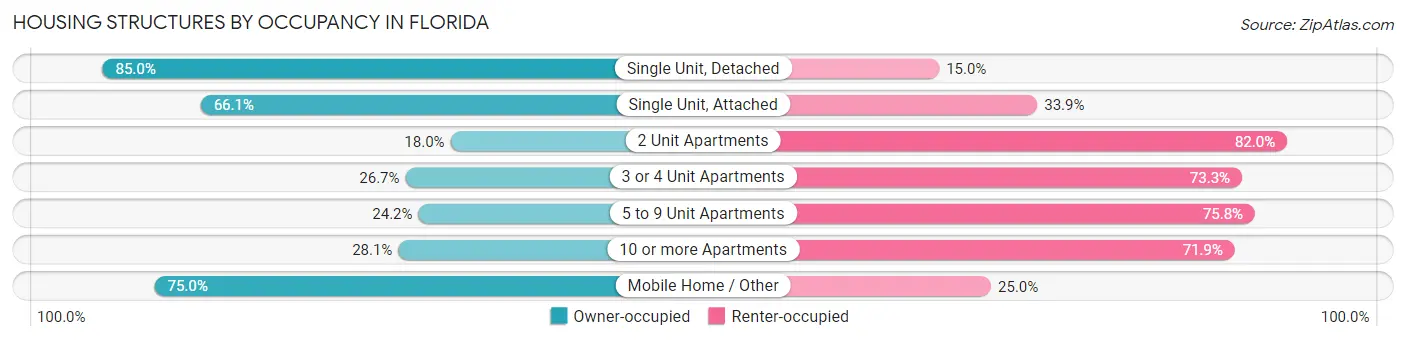
| Structure Type | Owner-occupied | Renter-occupied |
| Single Unit, Detached | 4,129,418 (85.0%) | 730,001 (15.0%) |
| Single Unit, Attached | 375,197 (66.1%) | 192,550 (33.9%) |
| 2 Unit Apartments | 29,273 (18.0%) | 133,169 (82.0%) |
| 3 or 4 Unit Apartments | 85,273 (26.7%) | 234,188 (73.3%) |
| 5 to 9 Unit Apartments | 92,182 (24.2%) | 288,906 (75.8%) |
| 10 or more Apartments | 402,412 (28.1%) | 1,031,107 (71.9%) |
| Mobile Home / Other | 472,169 (75.0%) | 157,596 (25.0%) |
| Total | 5,585,924 (66.9%) | 2,767,517 (33.1%) |
Housing Structures by Number of Rooms in Florida
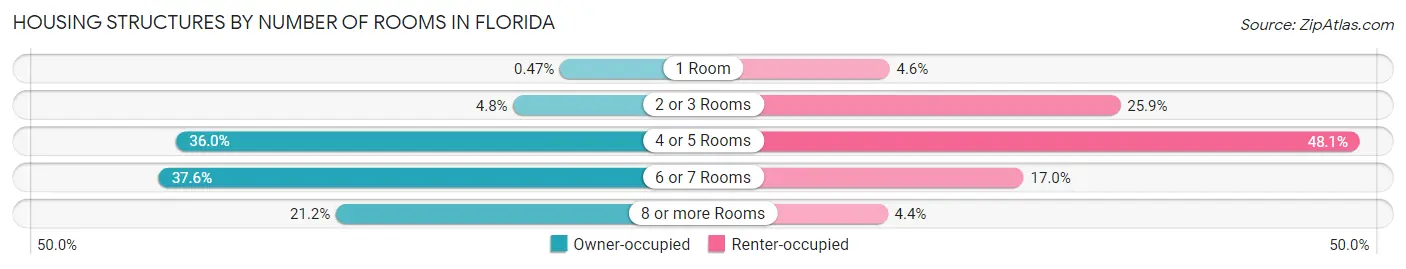
| Number of Rooms | Owner-occupied | Renter-occupied |
| 1 Room | 25,999 (0.5%) | 127,021 (4.6%) |
| 2 or 3 Rooms | 267,809 (4.8%) | 717,574 (25.9%) |
| 4 or 5 Rooms | 2,008,822 (36.0%) | 1,330,720 (48.1%) |
| 6 or 7 Rooms | 2,099,877 (37.6%) | 470,130 (17.0%) |
| 8 or more Rooms | 1,183,417 (21.2%) | 122,072 (4.4%) |
| Total | 5,585,924 (100.0%) | 2,767,517 (100.0%) |
Housing Structure by Heating Type in Florida
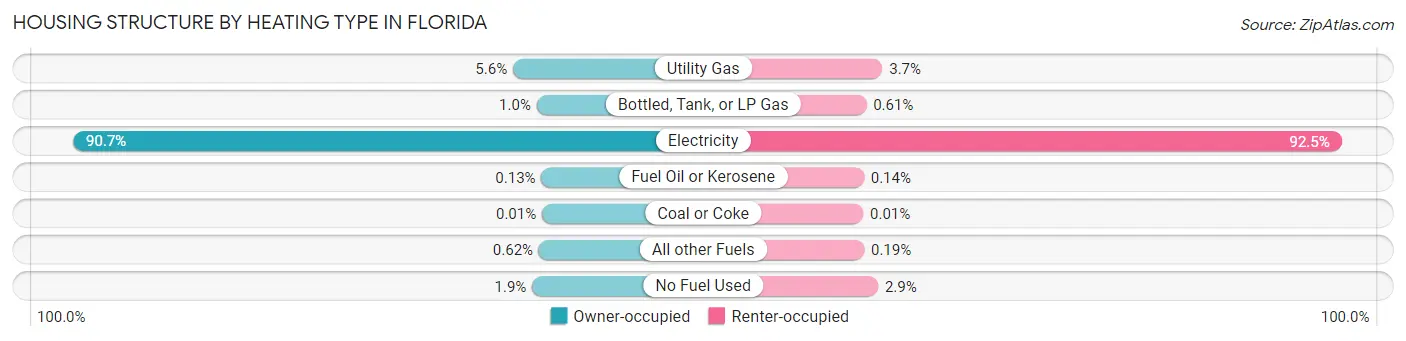
| Heating Type | Owner-occupied | Renter-occupied |
| Utility Gas | 314,327 (5.6%) | 102,914 (3.7%) |
| Bottled, Tank, or LP Gas | 58,332 (1.0%) | 16,956 (0.6%) |
| Electricity | 5,064,043 (90.7%) | 2,558,436 (92.4%) |
| Fuel Oil or Kerosene | 7,229 (0.1%) | 3,749 (0.1%) |
| Coal or Coke | 466 (0.0%) | 396 (0.0%) |
| All other Fuels | 34,626 (0.6%) | 5,156 (0.2%) |
| No Fuel Used | 106,901 (1.9%) | 79,910 (2.9%) |
| Total | 5,585,924 (100.0%) | 2,767,517 (100.0%) |
Household Vehicle Usage in Florida
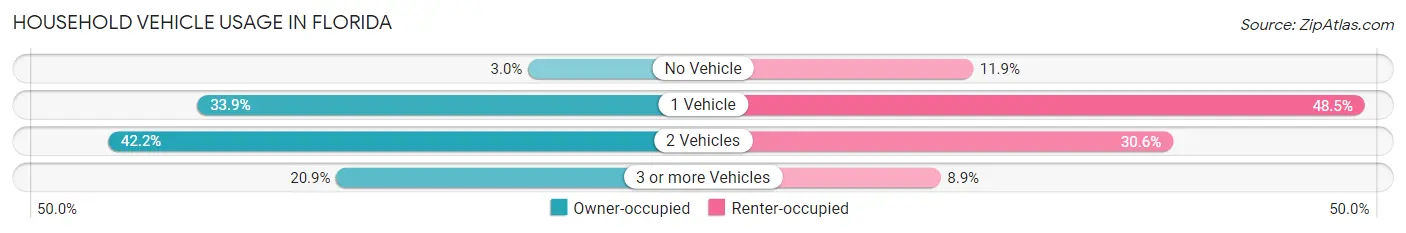
| Vehicles per Household | Owner-occupied | Renter-occupied |
| No Vehicle | 167,258 (3.0%) | 330,444 (11.9%) |
| 1 Vehicle | 1,892,762 (33.9%) | 1,342,903 (48.5%) |
| 2 Vehicles | 2,358,510 (42.2%) | 847,542 (30.6%) |
| 3 or more Vehicles | 1,167,394 (20.9%) | 246,628 (8.9%) |
| Total | 5,585,924 (100.0%) | 2,767,517 (100.0%) |
Real Estate & Mortgages in Florida
Real Estate and Mortgage Overview in Florida
| Characteristic | Without Mortgage | With Mortgage |
| Housing Units | 2,419,459 | 3,166,465 |
| Median Property Value | $257,500 | $314,800 |
| Median Household Income | $61,487 | $813,825 |
| Monthly Housing Costs | $590 | $432,377 |
| Real Estate Taxes | $2,002 | $98,224 |
Property Value by Mortgage Status in Florida
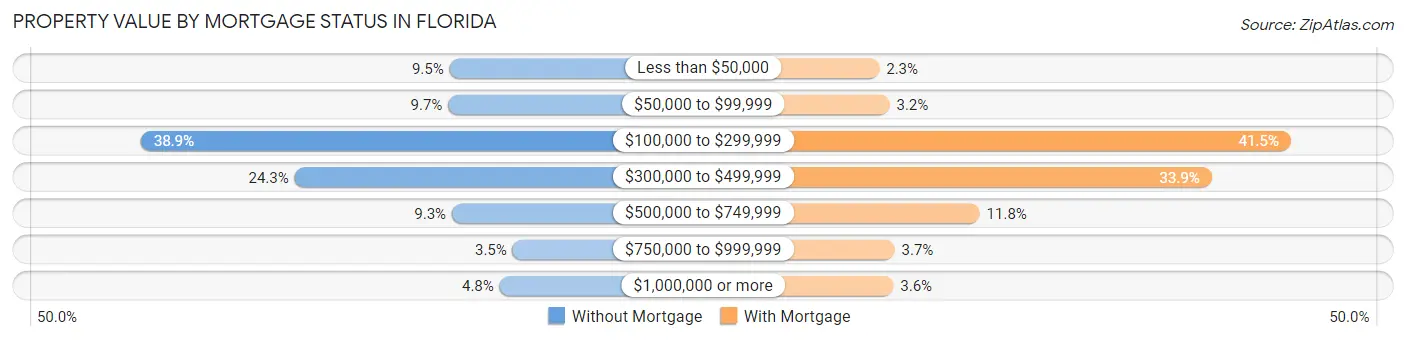
| Property Value | Without Mortgage | With Mortgage |
| Less than $50,000 | 230,475 (9.5%) | 71,622 (2.3%) |
| $50,000 to $99,999 | 233,756 (9.7%) | 102,735 (3.2%) |
| $100,000 to $299,999 | 941,914 (38.9%) | 1,312,485 (41.4%) |
| $300,000 to $499,999 | 587,761 (24.3%) | 1,073,757 (33.9%) |
| $500,000 to $749,999 | 225,067 (9.3%) | 374,221 (11.8%) |
| $750,000 to $999,999 | 85,260 (3.5%) | 117,725 (3.7%) |
| $1,000,000 or more | 115,226 (4.8%) | 113,920 (3.6%) |
| Total | 2,419,459 (100.0%) | 3,166,465 (100.0%) |
Household Income by Mortgage Status in Florida
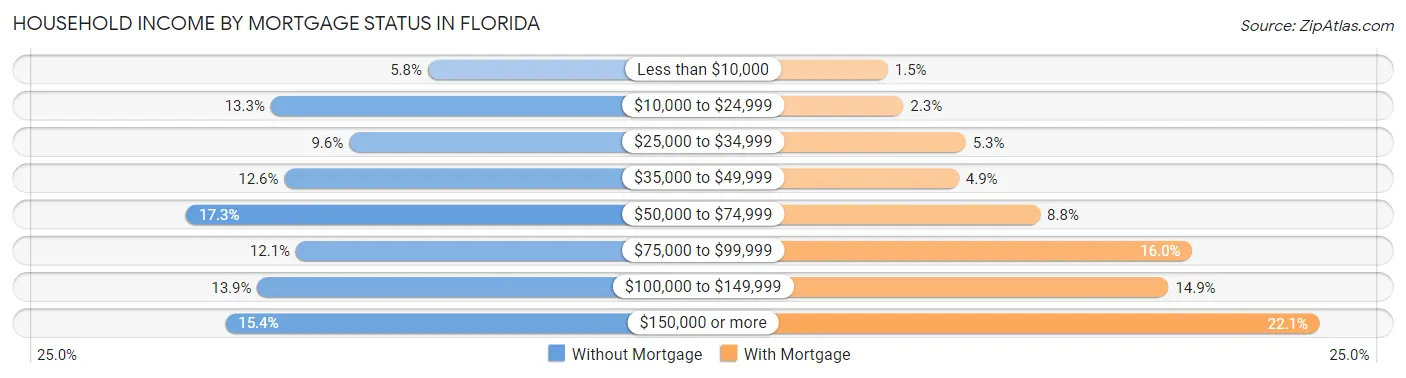
| Household Income | Without Mortgage | With Mortgage |
| Less than $10,000 | 140,377 (5.8%) | 48,760 (1.5%) |
| $10,000 to $24,999 | 321,253 (13.3%) | 72,241 (2.3%) |
| $25,000 to $34,999 | 230,971 (9.6%) | 166,296 (5.2%) |
| $35,000 to $49,999 | 305,514 (12.6%) | 155,750 (4.9%) |
| $50,000 to $74,999 | 418,859 (17.3%) | 278,468 (8.8%) |
| $75,000 to $99,999 | 292,169 (12.1%) | 507,953 (16.0%) |
| $100,000 to $149,999 | 336,793 (13.9%) | 471,848 (14.9%) |
| $150,000 or more | 373,523 (15.4%) | 700,084 (22.1%) |
| Total | 2,419,459 (100.0%) | 3,166,465 (100.0%) |
Property Value to Household Income Ratio in Florida
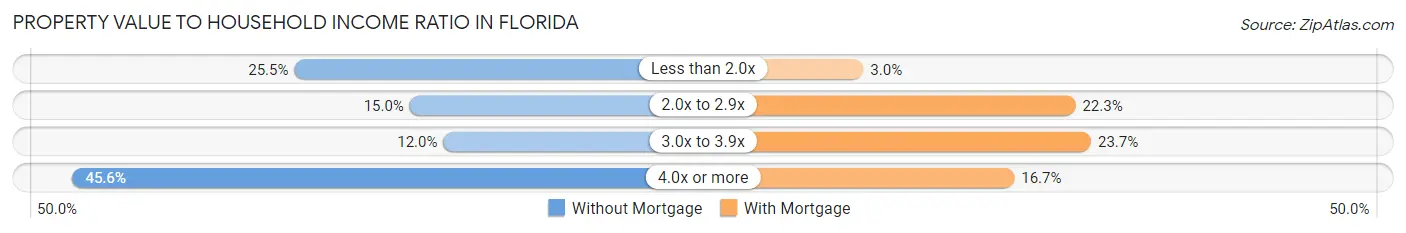
| Value-to-Income Ratio | Without Mortgage | With Mortgage |
| Less than 2.0x | 617,291 (25.5%) | 96,121 (3.0%) |
| 2.0x to 2.9x | 363,581 (15.0%) | 706,095 (22.3%) |
| 3.0x to 3.9x | 289,963 (12.0%) | 750,699 (23.7%) |
| 4.0x or more | 1,104,272 (45.6%) | 529,952 (16.7%) |
| Total | 2,419,459 (100.0%) | 3,166,465 (100.0%) |
Real Estate Taxes by Mortgage Status in Florida
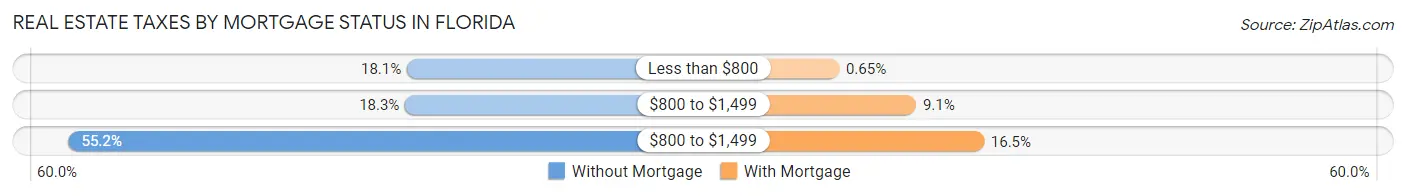
| Property Taxes | Without Mortgage | With Mortgage |
| Less than $800 | 437,773 (18.1%) | 20,427 (0.6%) |
| $800 to $1,499 | 442,527 (18.3%) | 287,757 (9.1%) |
| $800 to $1,499 | 1,335,062 (55.2%) | 523,296 (16.5%) |
| Total | 2,419,459 (100.0%) | 3,166,465 (100.0%) |
Health & Disability in Florida
Health Insurance Coverage by Age in Florida
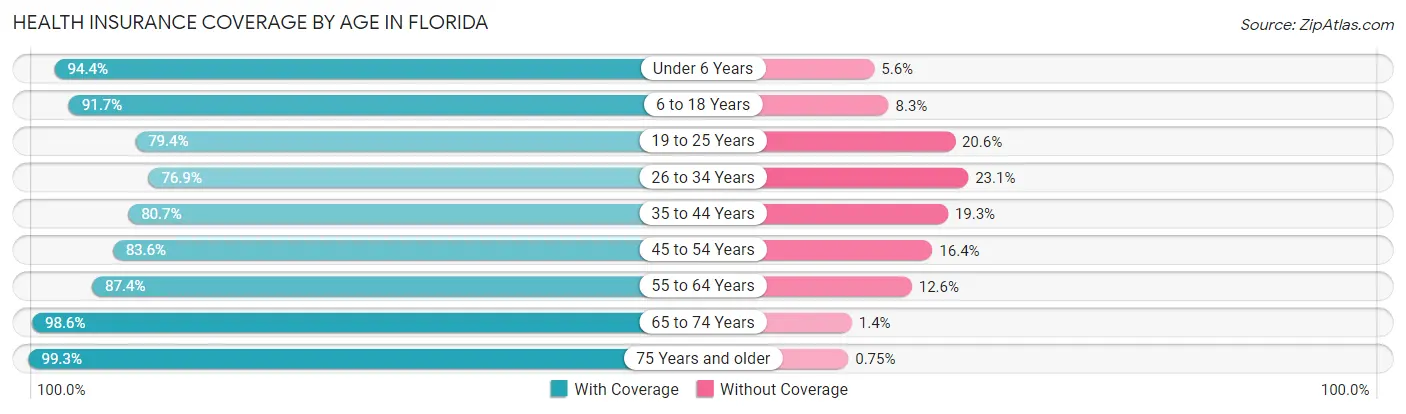
| Age Bracket | With Coverage | Without Coverage |
| Under 6 Years | 1,252,109 (94.4%) | 74,466 (5.6%) |
| 6 to 18 Years | 2,910,018 (91.7%) | 262,100 (8.3%) |
| 19 to 25 Years | 1,414,132 (79.4%) | 367,758 (20.6%) |
| 26 to 34 Years | 1,854,594 (76.9%) | 557,459 (23.1%) |
| 35 to 44 Years | 2,106,739 (80.7%) | 504,668 (19.3%) |
| 45 to 54 Years | 2,243,115 (83.6%) | 440,949 (16.4%) |
| 55 to 64 Years | 2,527,427 (87.4%) | 364,118 (12.6%) |
| 65 to 74 Years | 2,422,587 (98.6%) | 34,573 (1.4%) |
| 75 Years and older | 1,948,917 (99.3%) | 14,634 (0.7%) |
| Total | 18,679,638 (87.7%) | 2,620,725 (12.3%) |
Health Insurance Coverage by Citizenship Status in Florida
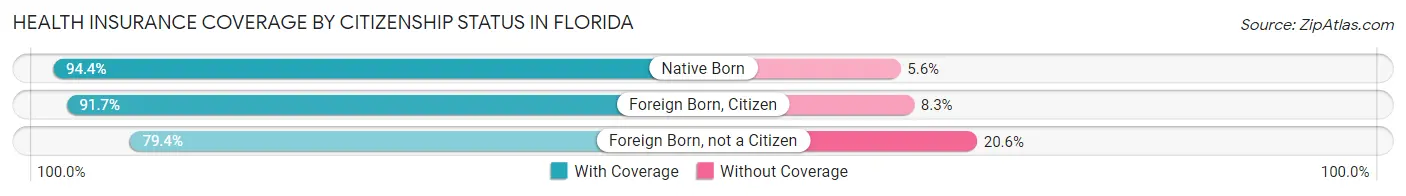
| Citizenship Status | With Coverage | Without Coverage |
| Native Born | 1,252,109 (94.4%) | 74,466 (5.6%) |
| Foreign Born, Citizen | 2,910,018 (91.7%) | 262,100 (8.3%) |
| Foreign Born, not a Citizen | 1,414,132 (79.4%) | 367,758 (20.6%) |
Health Insurance Coverage by Household Income in Florida
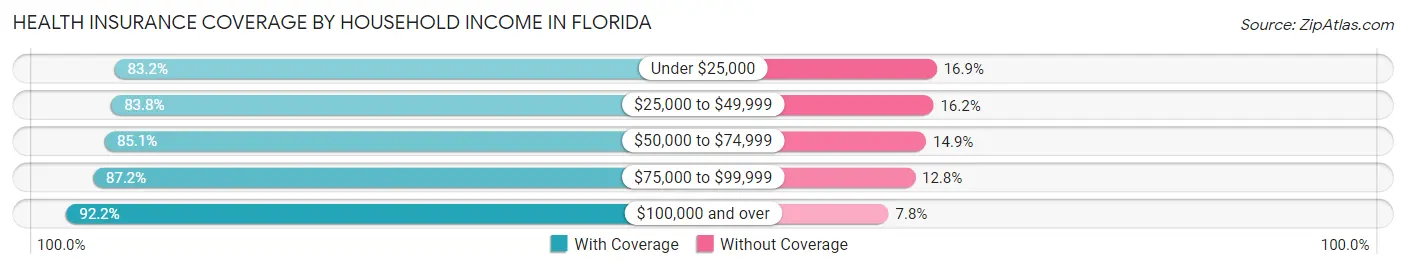
| Household Income | With Coverage | Without Coverage |
| Under $25,000 | 2,024,779 (83.2%) | 410,447 (16.9%) |
| $25,000 to $49,999 | 3,096,980 (83.8%) | 600,501 (16.2%) |
| $50,000 to $74,999 | 3,117,003 (85.1%) | 544,368 (14.9%) |
| $75,000 to $99,999 | 2,646,452 (87.2%) | 387,987 (12.8%) |
| $100,000 and over | 7,625,580 (92.2%) | 648,203 (7.8%) |
Public vs Private Health Insurance Coverage by Age in Florida
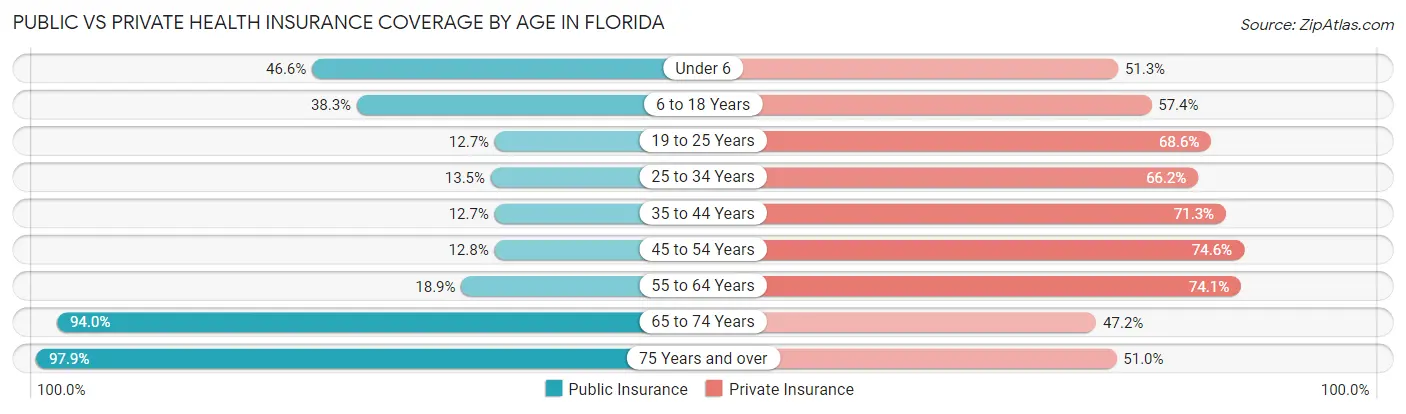
| Age Bracket | Public Insurance | Private Insurance |
| Under 6 | 618,539 (46.6%) | 679,971 (51.3%) |
| 6 to 18 Years | 1,215,251 (38.3%) | 1,822,101 (57.4%) |
| 19 to 25 Years | 226,285 (12.7%) | 1,221,502 (68.5%) |
| 25 to 34 Years | 324,376 (13.5%) | 1,595,609 (66.1%) |
| 35 to 44 Years | 332,668 (12.7%) | 1,861,989 (71.3%) |
| 45 to 54 Years | 343,070 (12.8%) | 2,003,415 (74.6%) |
| 55 to 64 Years | 547,391 (18.9%) | 2,142,593 (74.1%) |
| 65 to 74 Years | 2,309,146 (94.0%) | 1,159,961 (47.2%) |
| 75 Years and over | 1,922,014 (97.9%) | 1,000,658 (51.0%) |
| Total | 7,838,740 (36.8%) | 13,487,799 (63.3%) |
Disability Status by Sex by Age in Florida
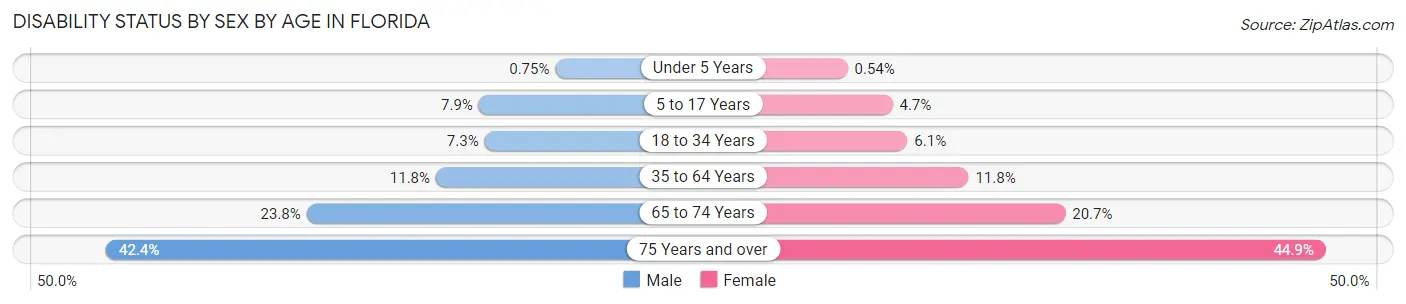
| Age Bracket | Male | Female |
| Under 5 Years | 4,209 (0.7%) | 2,945 (0.5%) |
| 5 to 17 Years | 125,730 (7.9%) | 71,982 (4.7%) |
| 18 to 34 Years | 163,630 (7.3%) | 135,668 (6.1%) |
| 35 to 64 Years | 474,182 (11.8%) | 491,610 (11.8%) |
| 65 to 74 Years | 271,895 (23.8%) | 273,058 (20.7%) |
| 75 Years and over | 365,425 (42.4%) | 495,167 (44.9%) |
Disability Class by Sex by Age in Florida
Disability Class: Hearing Difficulty
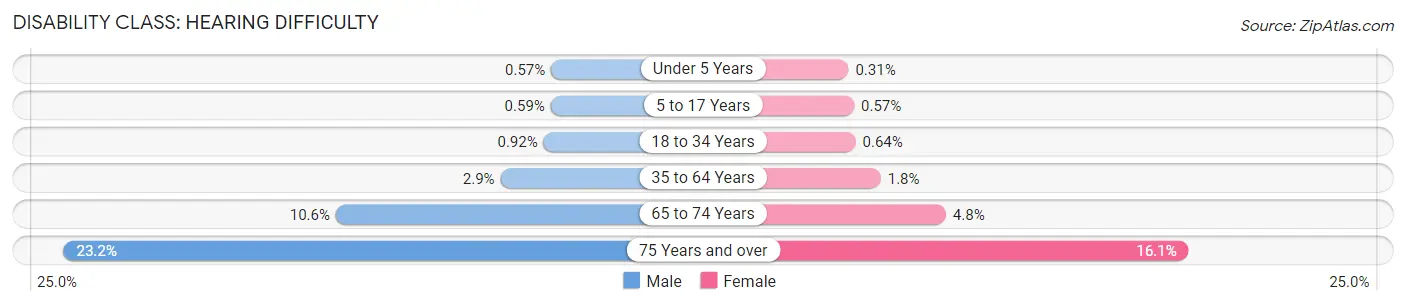
| Age Bracket | Male | Female |
| Under 5 Years | 3,224 (0.6%) | 1,684 (0.3%) |
| 5 to 17 Years | 9,429 (0.6%) | 8,709 (0.6%) |
| 18 to 34 Years | 20,610 (0.9%) | 14,146 (0.6%) |
| 35 to 64 Years | 117,151 (2.9%) | 75,704 (1.8%) |
| 65 to 74 Years | 120,499 (10.6%) | 63,569 (4.8%) |
| 75 Years and over | 199,636 (23.2%) | 177,418 (16.1%) |
Disability Class: Vision Difficulty
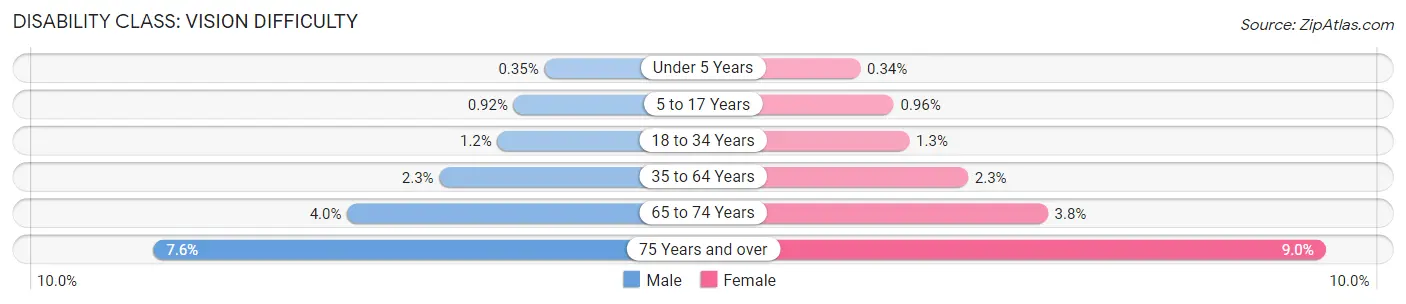
| Age Bracket | Male | Female |
| Under 5 Years | 1,977 (0.4%) | 1,863 (0.3%) |
| 5 to 17 Years | 14,791 (0.9%) | 14,621 (1.0%) |
| 18 to 34 Years | 27,241 (1.2%) | 27,843 (1.3%) |
| 35 to 64 Years | 92,286 (2.3%) | 98,011 (2.3%) |
| 65 to 74 Years | 45,755 (4.0%) | 50,301 (3.8%) |
| 75 Years and over | 65,563 (7.6%) | 99,046 (9.0%) |
Disability Class: Cognitive Difficulty
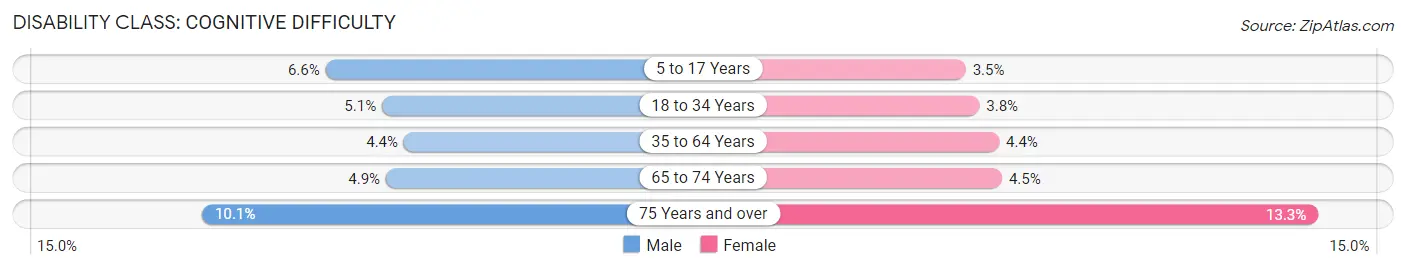
| Age Bracket | Male | Female |
| 5 to 17 Years | 105,879 (6.6%) | 52,699 (3.5%) |
| 18 to 34 Years | 112,768 (5.1%) | 85,174 (3.8%) |
| 35 to 64 Years | 178,032 (4.4%) | 182,979 (4.4%) |
| 65 to 74 Years | 56,381 (4.9%) | 58,698 (4.5%) |
| 75 Years and over | 86,583 (10.1%) | 146,183 (13.3%) |
Disability Class: Ambulatory Difficulty
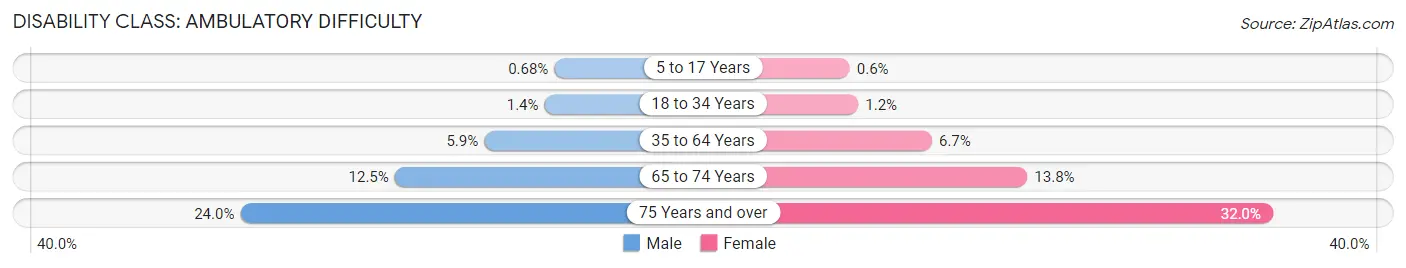
| Age Bracket | Male | Female |
| 5 to 17 Years | 10,909 (0.7%) | 9,162 (0.6%) |
| 18 to 34 Years | 31,428 (1.4%) | 27,457 (1.2%) |
| 35 to 64 Years | 236,184 (5.9%) | 280,097 (6.7%) |
| 65 to 74 Years | 142,960 (12.5%) | 181,355 (13.8%) |
| 75 Years and over | 206,542 (24.0%) | 352,830 (32.0%) |
Disability Class: Self-Care Difficulty
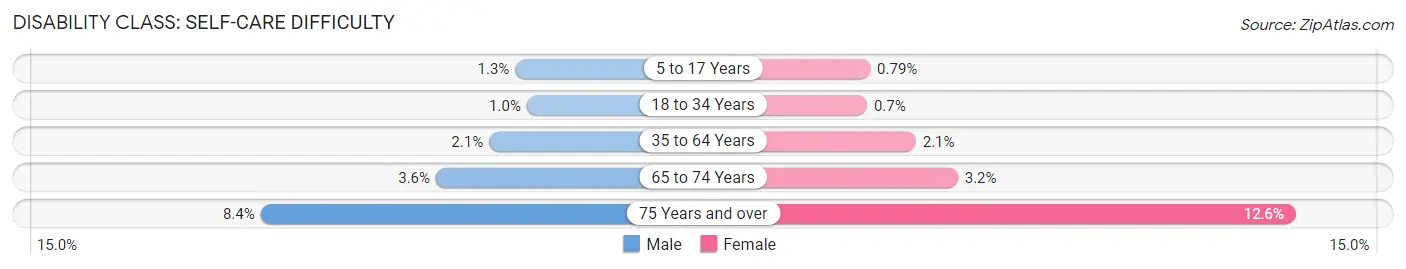
| Age Bracket | Male | Female |
| 5 to 17 Years | 21,392 (1.3%) | 12,019 (0.8%) |
| 18 to 34 Years | 22,803 (1.0%) | 15,691 (0.7%) |
| 35 to 64 Years | 82,960 (2.1%) | 86,033 (2.1%) |
| 65 to 74 Years | 40,539 (3.5%) | 42,568 (3.2%) |
| 75 Years and over | 72,604 (8.4%) | 139,410 (12.6%) |
Technology Access in Florida
Computing Device Access in Florida
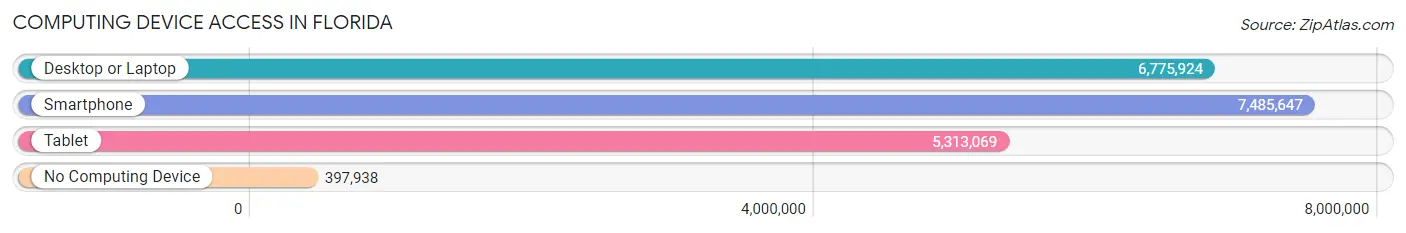
| Device Type | # Households | % Households |
| Desktop or Laptop | 6,775,924 | 81.1% |
| Smartphone | 7,485,647 | 89.6% |
| Tablet | 5,313,069 | 63.6% |
| No Computing Device | 397,938 | 4.8% |
| Total | 8,353,441 | 100.0% |
Internet Access in Florida
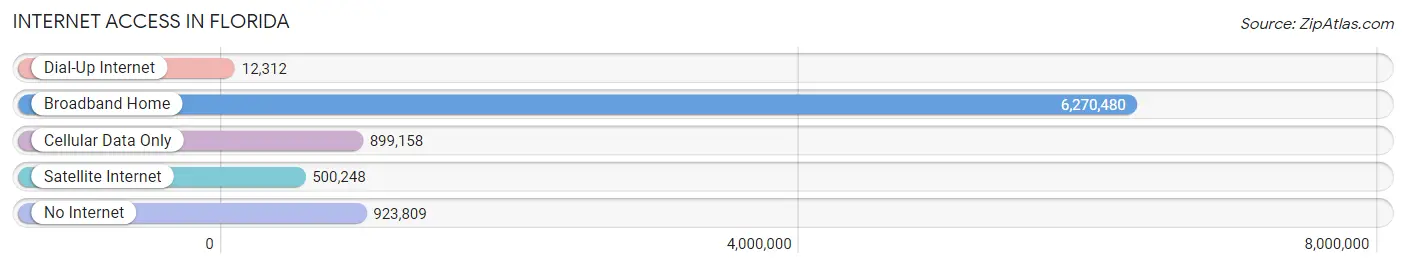
| Internet Type | # Households | % Households |
| Dial-Up Internet | 12,312 | 0.2% |
| Broadband Home | 6,270,480 | 75.1% |
| Cellular Data Only | 899,158 | 10.8% |
| Satellite Internet | 500,248 | 6.0% |
| No Internet | 923,809 | 11.1% |
| Total | 8,353,441 | 100.0% |
Florida Summary
Florida is a state located in the southeastern region of the United States. It is bordered by Alabama to the northwest, Georgia to the north, and the Gulf of Mexico to the south and west. Florida is the 22nd most populous state in the United States, with a population of 21.3 million in 2019. It is the third most populous state in the country after California and Texas.
History
The first people to inhabit the area now known as Florida were Native Americans, including the Calusa, Apalachee, Timucua, and Ais tribes. The first Europeans to explore the area were Spanish explorers, led by Juan Ponce de Leon, who arrived in 1513. The Spanish established a number of settlements in the area, including St. Augustine, which is the oldest continuously inhabited European settlement in the United States.
In 1819, the United States acquired Florida from Spain through the Adams-Onis Treaty. Florida became a U.S. territory in 1821 and was admitted to the Union as the 27th state in 1845. During the Civil War, Florida seceded from the Union in 1861 and joined the Confederate States of America. After the war, Florida was readmitted to the Union in 1868.
Geography
Florida is the 22nd largest state in the United States, covering an area of 65,755 square miles. It is the southernmost state in the continental United States and is bordered by Alabama to the northwest, Georgia to the north, and the Gulf of Mexico to the south and west. Florida has a coastline of 1,350 miles, making it the longest coastline of any state in the United States.
The state is divided into 67 counties and is home to a number of distinct geographic regions, including the Everglades, the Florida Keys, and the Gulf Coast. The highest point in the state is Britton Hill, which is located in Walton County and has an elevation of 345 feet. The lowest point in the state is the Atlantic Ocean, which has an elevation of 0 feet.
Economy
Florida has a diverse and vibrant economy that is driven by a number of industries, including tourism, agriculture, manufacturing, and finance. The state is home to a number of major corporations, including Walt Disney World, Universal Studios, and Publix Super Markets.
Tourism is a major contributor to the state’s economy, with over 112 million visitors in 2019. Florida is home to a number of popular tourist destinations, including Walt Disney World, Universal Studios, and the Kennedy Space Center.
Agriculture is also an important part of the state’s economy, with the state producing a variety of crops, including oranges, tomatoes, sugarcane, and strawberries.
Demographics
As of 2019, the population of Florida was 21.3 million, making it the third most populous state in the United States after California and Texas. The state has a population density of 350 people per square mile, making it the seventh most densely populated state in the country.
The largest racial group in Florida is White, making up 57.9% of the population. The second largest racial group is Hispanic or Latino, making up 25.7% of the population. Other racial groups include African American (15.8%), Asian (3.2%), and Native American (0.5%).
The median household income in Florida is $53,267, which is slightly lower than the national median of $57,652. The poverty rate in the state is 13.7%, which is slightly higher than the national poverty rate of 11.8%.
Common Questions
When was Florida Incorporated?
Florida was Incorporated into the Union on Mar 3, 1845.
What is the Total Area of Florida?
Total Area of Florida is 65,758 Square Miles.
What is the Total Land Area of Florida?
Total Land Area of Florida is 53,603 Square Miles.
What is the Total Water Area of Florida?
Total Water Area of Florida is 12,154 Square Miles.
What is the Average Elevation in Florida?
Average Elevation in Florida is 100 Feet.
What is the Highest Elevation in Florida?
Highest Elevation in Florida is 345 Feet.
What is the Lowest Elevation in Florida?
Lowest Elevation in Florida is 0 Feet.
What is the Population Density in Florida?
Population Density in Florida is 403.6 People per Square Mile.
What is Per Capita Income in Florida?
Per Capita income in Florida is $38,850.
What is the Median Family Income in Florida?
Median Family Income in Florida is $81,514.
What is the Median Household income in Florida?
Median Household Income in Florida is $67,917.
What is Income or Wage Gap in Florida?
Income or Wage Gap in Florida is 22.6%.
Women in Florida earn 77.4 cents for every dollar earned by a man.
What is Family Income Deficit in Florida?
Family Income Deficit in Florida is $10,542.
Families that are below poverty line in Florida earn $10,542 less on average than the poverty threshold level.
What is Inequality or Gini Index in Florida?
Inequality or Gini Index in Florida is 0.49.
What is the Total Population of Florida?
Total Population of Florida is 21,634,529.
What is the Total Male Population of Florida?
Total Male Population of Florida is 10,646,786.
What is the Total Female Population of Florida?
Total Female Population of Florida is 10,987,743.
What is the Ratio of Males per 100 Females in Florida?
There are 96.90 Males per 100 Females in Florida.
What is the Ratio of Females per 100 Males in Florida?
There are 103.20 Females per 100 Males in Florida.
What is the Median Population Age in Florida?
Median Population Age in Florida is 42.4 Years.
What is the Average Family Size in Florida
Average Family Size in Florida is 3.1 People.
What is the Average Household Size in Florida
Average Household Size in Florida is 2.5 People.
How Large is the Labor Force in Florida?
There are 10,628,791 People in the Labor Forcein in Florida.
What is the Percentage of People in the Labor Force in Florida?
59.4% of People are in the Labor Force in Florida.
What is the Unemployment Rate in Florida?
Unemployment Rate in Florida is 5.0%.