Blacklake, CA Map & Demographics
Blacklake Map
Blacklake Overview
$68,731
PER CAPITA INCOME
$163,854
AVG FAMILY INCOME
$125,100
AVG HOUSEHOLD INCOME
65.5%
WAGE / INCOME GAP [ % ]
34.5¢/ $1
WAGE / INCOME GAP [ $ ]
0.32
INEQUALITY / GINI INDEX
824
TOTAL POPULATION
440
MALE POPULATION
384
FEMALE POPULATION
114.58
MALES / 100 FEMALES
87.27
FEMALES / 100 MALES
64.7
MEDIAN AGE
2.5
AVG FAMILY SIZE
1.9
AVG HOUSEHOLD SIZE
282
LABOR FORCE [ PEOPLE ]
38.3%
PERCENT IN LABOR FORCE
Income in Blacklake
Income Overview in Blacklake
Per Capita Income in Blacklake is $68,731, while median incomes of families and households are $163,854 and $125,100 respectively.
| Characteristic | Number | Measure |
| Per Capita Income | 824 | $68,731 |
| Median Family Income | 232 | $163,854 |
| Mean Family Income | 232 | $168,221 |
| Median Household Income | 428 | $125,100 |
| Mean Household Income | 428 | $127,430 |
| Income Deficit | 232 | $0 |
| Wage / Income Gap (%) | 824 | 65.47% |
| Wage / Income Gap ($) | 824 | 34.53¢ per $1 |
| Gini / Inequality Index | 824 | 0.32 |
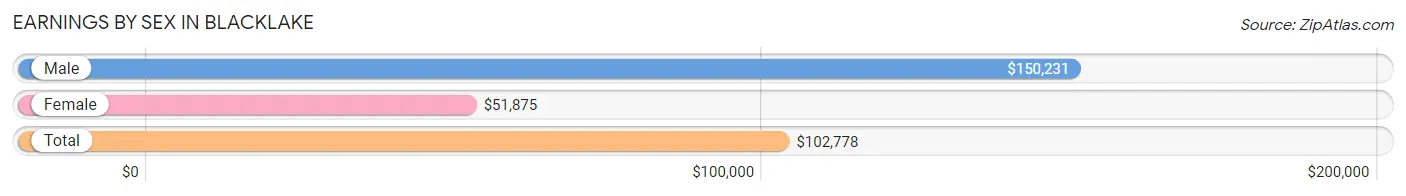
Earnings by Sex in Blacklake
Average Earnings in Blacklake are $102,778, $150,231 for men and $51,875 for women, a difference of 65.5%.
| Sex | Number | Average Earnings |
| Male | 179 (61.7%) | $150,231 |
| Female | 111 (38.3%) | $51,875 |
| Total | 290 (100.0%) | $102,778 |
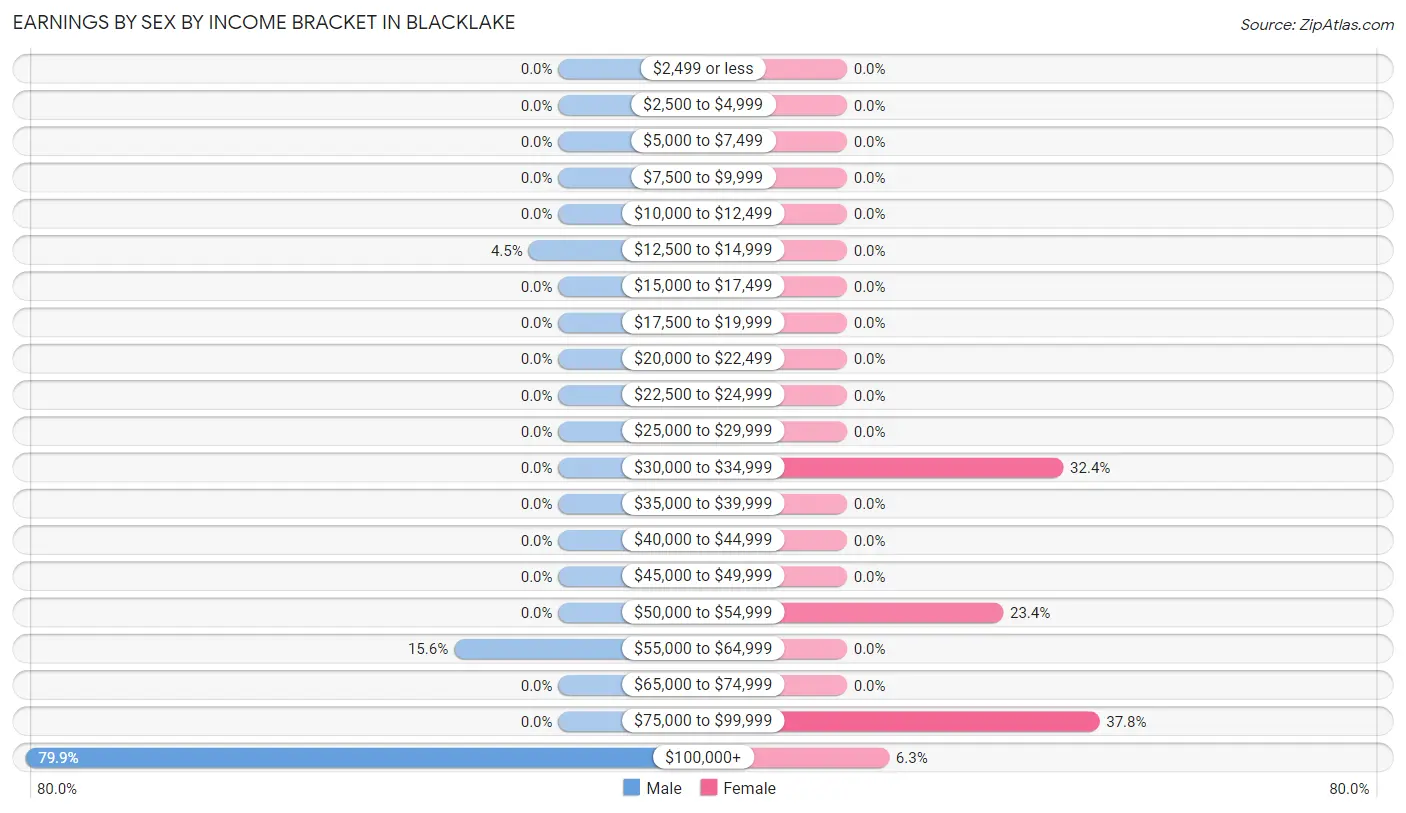
Earnings by Sex by Income Bracket in Blacklake
The most common earnings brackets in Blacklake are $100,000+ for men (143 | 79.9%) and $75,000 to $99,999 for women (42 | 37.8%).
| Income | Male | Female |
| $2,499 or less | 0 (0.0%) | 0 (0.0%) |
| $2,500 to $4,999 | 0 (0.0%) | 0 (0.0%) |
| $5,000 to $7,499 | 0 (0.0%) | 0 (0.0%) |
| $7,500 to $9,999 | 0 (0.0%) | 0 (0.0%) |
| $10,000 to $12,499 | 0 (0.0%) | 0 (0.0%) |
| $12,500 to $14,999 | 8 (4.5%) | 0 (0.0%) |
| $15,000 to $17,499 | 0 (0.0%) | 0 (0.0%) |
| $17,500 to $19,999 | 0 (0.0%) | 0 (0.0%) |
| $20,000 to $22,499 | 0 (0.0%) | 0 (0.0%) |
| $22,500 to $24,999 | 0 (0.0%) | 0 (0.0%) |
| $25,000 to $29,999 | 0 (0.0%) | 0 (0.0%) |
| $30,000 to $34,999 | 0 (0.0%) | 36 (32.4%) |
| $35,000 to $39,999 | 0 (0.0%) | 0 (0.0%) |
| $40,000 to $44,999 | 0 (0.0%) | 0 (0.0%) |
| $45,000 to $49,999 | 0 (0.0%) | 0 (0.0%) |
| $50,000 to $54,999 | 0 (0.0%) | 26 (23.4%) |
| $55,000 to $64,999 | 28 (15.6%) | 0 (0.0%) |
| $65,000 to $74,999 | 0 (0.0%) | 0 (0.0%) |
| $75,000 to $99,999 | 0 (0.0%) | 42 (37.8%) |
| $100,000+ | 143 (79.9%) | 7 (6.3%) |
| Total | 179 (100.0%) | 111 (100.0%) |
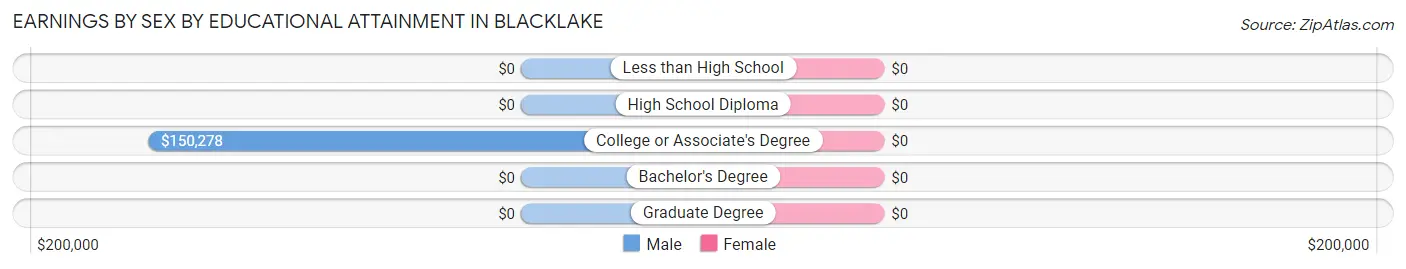
Earnings by Sex by Educational Attainment in Blacklake
| Educational Attainment | Male Income | Female Income |
| Less than High School | - | - |
| High School Diploma | - | - |
| College or Associate's Degree | $150,278 | $0 |
| Bachelor's Degree | - | - |
| Graduate Degree | - | - |
| Total | $151,898 | $75,685 |
Family Income in Blacklake
Family Income Brackets in Blacklake
According to the Blacklake family income data, there are 100 families falling into the $150,000 to $199,999 income range, which is the most common income bracket and makes up 43.1% of all families.
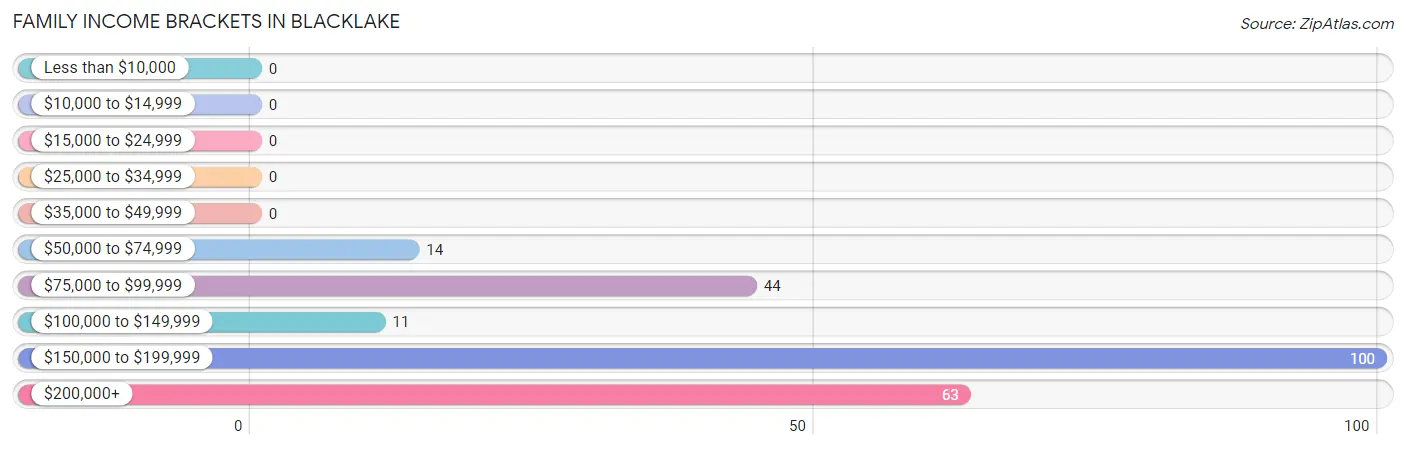
| Income Bracket | # Families | % Families |
| Less than $10,000 | 0 | 0.0% |
| $10,000 to $14,999 | 0 | 0.0% |
| $15,000 to $24,999 | 0 | 0.0% |
| $25,000 to $34,999 | 0 | 0.0% |
| $35,000 to $49,999 | 0 | 0.0% |
| $50,000 to $74,999 | 14 | 6.0% |
| $75,000 to $99,999 | 44 | 19.0% |
| $100,000 to $149,999 | 11 | 4.7% |
| $150,000 to $199,999 | 100 | 43.1% |
| $200,000+ | 63 | 27.2% |
Family Income by Famaliy Size in Blacklake
2-person families (184 | 79.3%) account for the highest median family income in Blacklake with $161,190 per family, while 2-person families (184 | 79.3%) have the highest median income of $80,595 per family member.
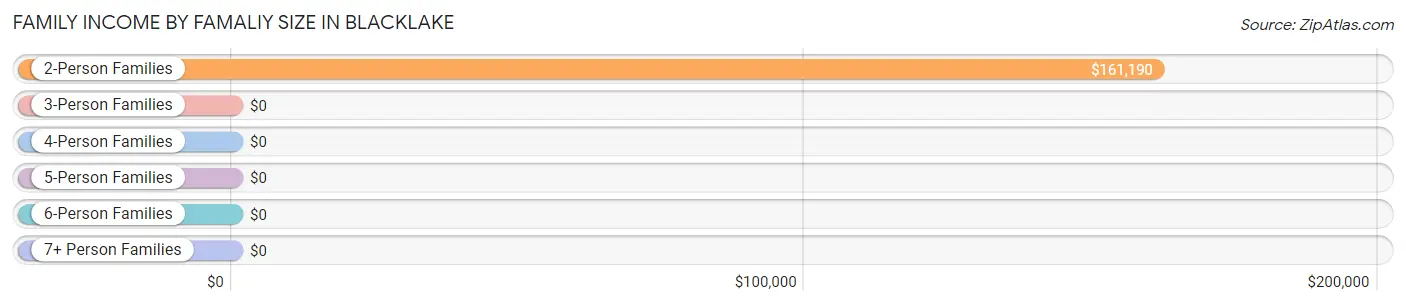
| Income Bracket | # Families | Median Income |
| 2-Person Families | 184 (79.3%) | $161,190 |
| 3-Person Families | 0 (0.0%) | $0 |
| 4-Person Families | 48 (20.7%) | $0 |
| 5-Person Families | 0 (0.0%) | $0 |
| 6-Person Families | 0 (0.0%) | $0 |
| 7+ Person Families | 0 (0.0%) | $0 |
| Total | 232 (100.0%) | $163,854 |
Family Income by Number of Earners in Blacklake
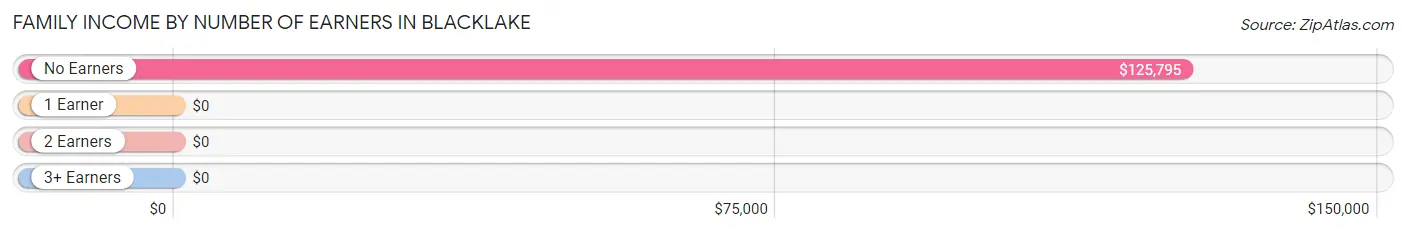
| Number of Earners | # Families | Median Income |
| No Earners | 123 (53.0%) | $125,795 |
| 1 Earner | 34 (14.7%) | $0 |
| 2 Earners | 69 (29.7%) | $0 |
| 3+ Earners | 6 (2.6%) | $0 |
| Total | 232 (100.0%) | $163,854 |
Household Income in Blacklake
Household Income Brackets in Blacklake
With 119 households falling in the category, the $150,000 to $199,999 income range is the most frequent in Blacklake, accounting for 27.8% of all households.
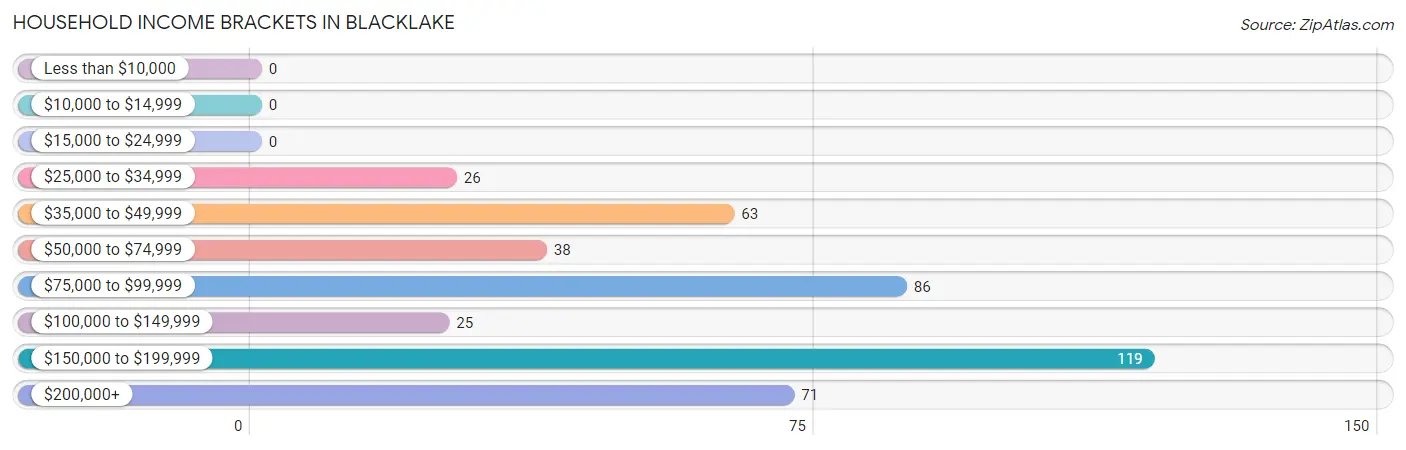
| Income Bracket | # Households | % Households |
| Less than $10,000 | 0 | 0.0% |
| $10,000 to $14,999 | 0 | 0.0% |
| $15,000 to $24,999 | 0 | 0.0% |
| $25,000 to $34,999 | 26 | 6.1% |
| $35,000 to $49,999 | 63 | 14.7% |
| $50,000 to $74,999 | 38 | 8.9% |
| $75,000 to $99,999 | 86 | 20.1% |
| $100,000 to $149,999 | 25 | 5.8% |
| $150,000 to $199,999 | 119 | 27.8% |
| $200,000+ | 71 | 16.6% |
Household Income by Householder Age in Blacklake
The median household income in Blacklake is $125,100, with the highest median household income of $180,685 found in the 45 to 64 years age bracket for the primary householder. A total of 127 households (29.7%) fall into this category. Meanwhile, the 15 to 24 years age bracket for the primary householder has the lowest median household income of $0, with 28 households (6.5%) in this group.
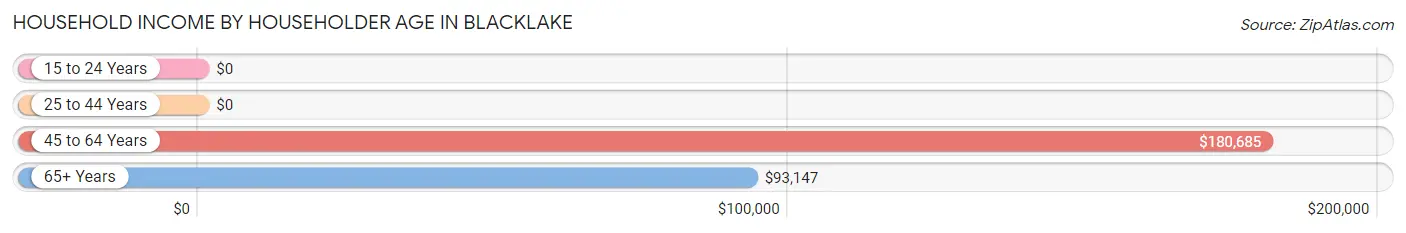
| Income Bracket | # Households | Median Income |
| 15 to 24 Years | 28 (6.5%) | $0 |
| 25 to 44 Years | 0 (0.0%) | $0 |
| 45 to 64 Years | 127 (29.7%) | $180,685 |
| 65+ Years | 273 (63.8%) | $93,147 |
| Total | 428 (100.0%) | $125,100 |
Poverty in Blacklake
Income Below Poverty by Sex and Age in Blacklake
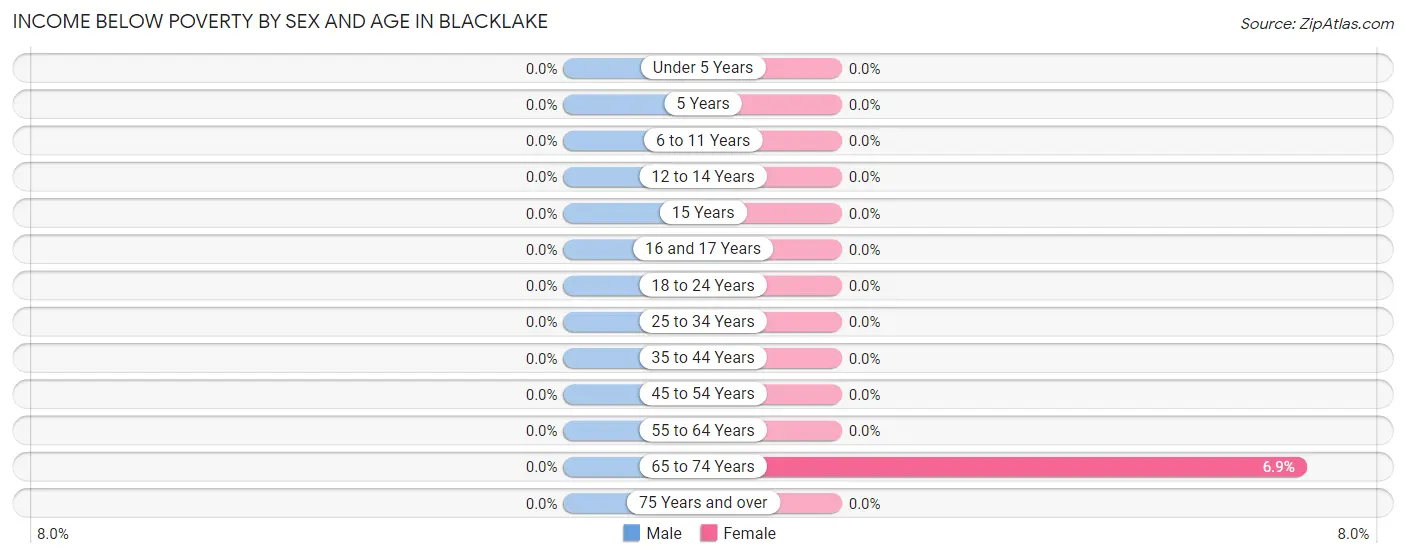
| Age Bracket | Male | Female |
| Under 5 Years | 0 (0.0%) | 0 (0.0%) |
| 5 Years | 0 (0.0%) | 0 (0.0%) |
| 6 to 11 Years | 0 (0.0%) | 0 (0.0%) |
| 12 to 14 Years | 0 (0.0%) | 0 (0.0%) |
| 15 Years | 0 (0.0%) | 0 (0.0%) |
| 16 and 17 Years | 0 (0.0%) | 0 (0.0%) |
| 18 to 24 Years | 0 (0.0%) | 0 (0.0%) |
| 25 to 34 Years | 0 (0.0%) | 0 (0.0%) |
| 35 to 44 Years | 0 (0.0%) | 0 (0.0%) |
| 45 to 54 Years | 0 (0.0%) | 0 (0.0%) |
| 55 to 64 Years | 0 (0.0%) | 0 (0.0%) |
| 65 to 74 Years | 0 (0.0%) | 8 (6.9%) |
| 75 Years and over | 0 (0.0%) | 0 (0.0%) |
| Total | 0 (0.0%) | 8 (2.1%) |
Income Above Poverty by Sex and Age in Blacklake
According to the poverty statistics in Blacklake, males aged 6 to 11 years and females aged 18 to 24 years are the age groups that are most secure financially, with 100.0% of males and 100.0% of females in these age groups living above the poverty line.
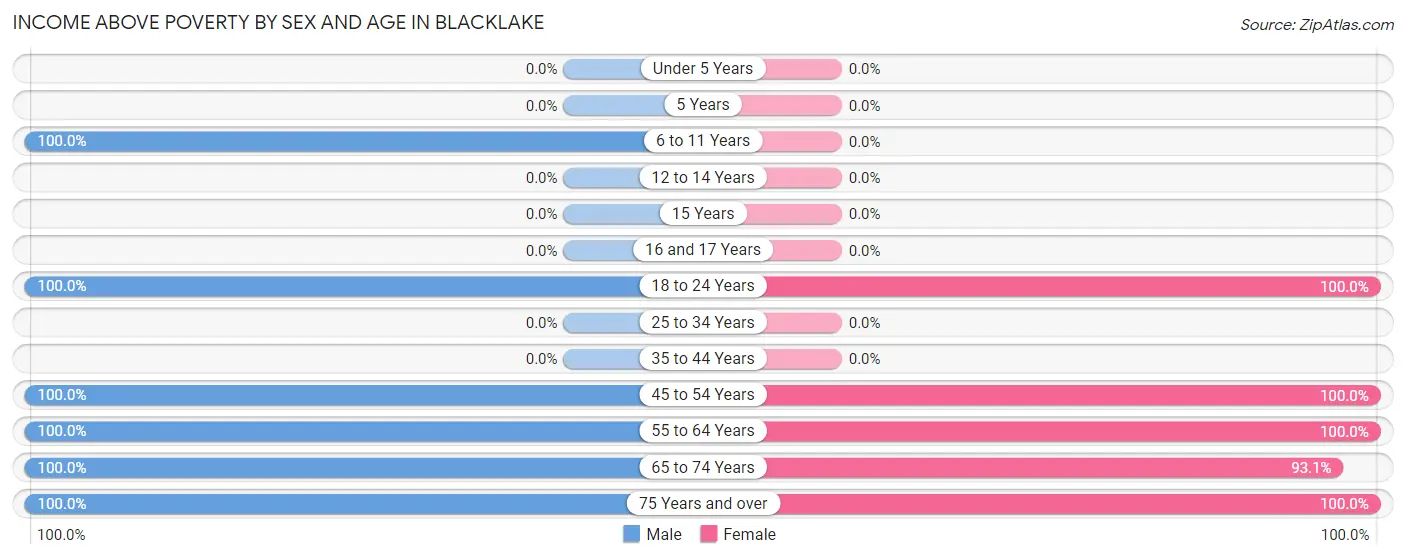
| Age Bracket | Male | Female |
| Under 5 Years | 0 (0.0%) | 0 (0.0%) |
| 5 Years | 0 (0.0%) | 0 (0.0%) |
| 6 to 11 Years | 87 (100.0%) | 0 (0.0%) |
| 12 to 14 Years | 0 (0.0%) | 0 (0.0%) |
| 15 Years | 0 (0.0%) | 0 (0.0%) |
| 16 and 17 Years | 0 (0.0%) | 0 (0.0%) |
| 18 to 24 Years | 44 (100.0%) | 36 (100.0%) |
| 25 to 34 Years | 0 (0.0%) | 0 (0.0%) |
| 35 to 44 Years | 0 (0.0%) | 0 (0.0%) |
| 45 to 54 Years | 45 (100.0%) | 49 (100.0%) |
| 55 to 64 Years | 97 (100.0%) | 60 (100.0%) |
| 65 to 74 Years | 61 (100.0%) | 108 (93.1%) |
| 75 Years and over | 106 (100.0%) | 123 (100.0%) |
| Total | 440 (100.0%) | 376 (97.9%) |
Income Below Poverty Among Married-Couple Families in Blacklake
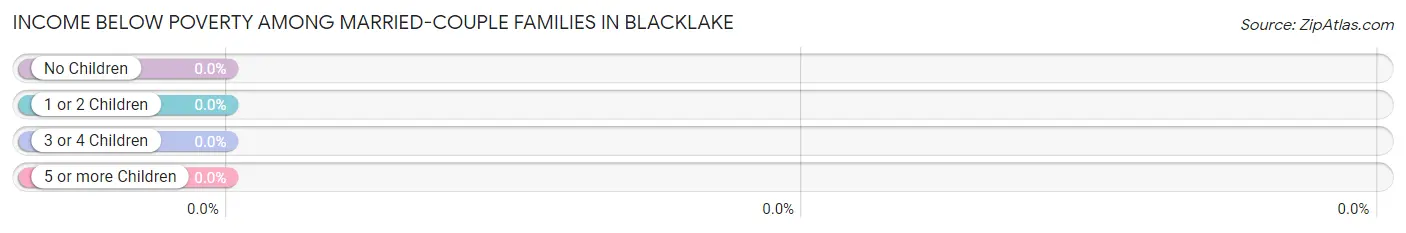
| Children | Above Poverty | Below Poverty |
| No Children | 190 (100.0%) | 0 (0.0%) |
| 1 or 2 Children | 42 (100.0%) | 0 (0.0%) |
| 3 or 4 Children | 0 (0.0%) | 0 (0.0%) |
| 5 or more Children | 0 (0.0%) | 0 (0.0%) |
| Total | 232 (100.0%) | 0 (0.0%) |
Income Below Poverty Among Single-Parent Households in Blacklake
| Children | Single Father | Single Mother |
| No Children | 0 (0.0%) | 0 (0.0%) |
| 1 or 2 Children | 0 (0.0%) | 0 (0.0%) |
| 3 or 4 Children | 0 (0.0%) | 0 (0.0%) |
| 5 or more Children | 0 (0.0%) | 0 (0.0%) |
| Total | 0 (0.0%) | 0 (0.0%) |
Income Below Poverty Among Married-Couple vs Single-Parent Households in Blacklake
| Children | Married-Couple Families | Single-Parent Households |
| No Children | 0 (0.0%) | 0 (0.0%) |
| 1 or 2 Children | 0 (0.0%) | 0 (0.0%) |
| 3 or 4 Children | 0 (0.0%) | 0 (0.0%) |
| 5 or more Children | 0 (0.0%) | 0 (0.0%) |
| Total | 0 (0.0%) | 0 (0.0%) |
Race in Blacklake
The most populous races in Blacklake are White / Caucasian (773 | 93.8%), Two or more Races (32 | 3.9%), and Hispanic or Latino (24 | 2.9%).
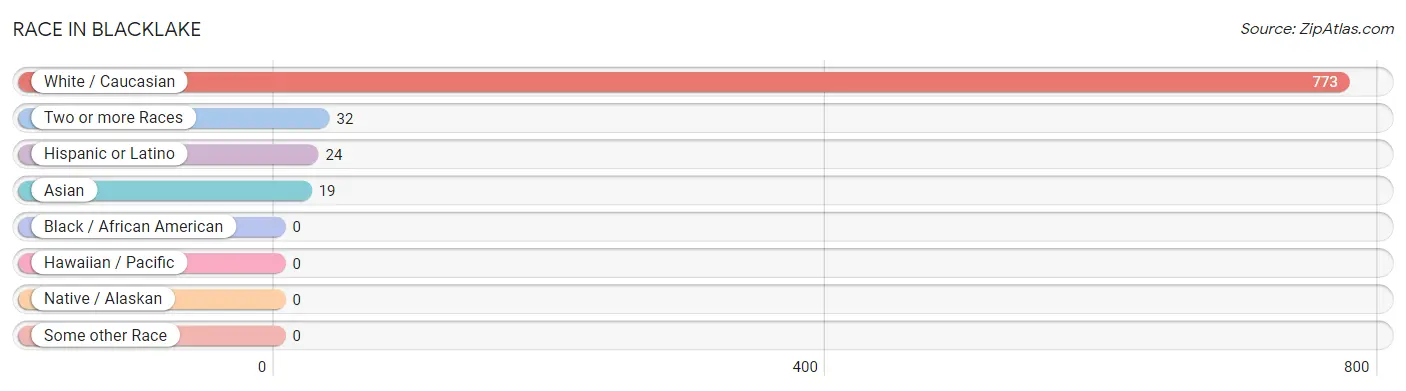
| Race | # Population | % Population |
| Asian | 19 | 2.3% |
| Black / African American | 0 | 0.0% |
| Hawaiian / Pacific | 0 | 0.0% |
| Hispanic or Latino | 24 | 2.9% |
| Native / Alaskan | 0 | 0.0% |
| White / Caucasian | 773 | 93.8% |
| Two or more Races | 32 | 3.9% |
| Some other Race | 0 | 0.0% |
| Total | 824 | 100.0% |
Ancestry in Blacklake
The most populous ancestries reported in Blacklake are Irish (169 | 20.5%), English (166 | 20.2%), German (108 | 13.1%), Scottish (86 | 10.4%), and Polish (69 | 8.4%), together accounting for 72.6% of all Blacklake residents.
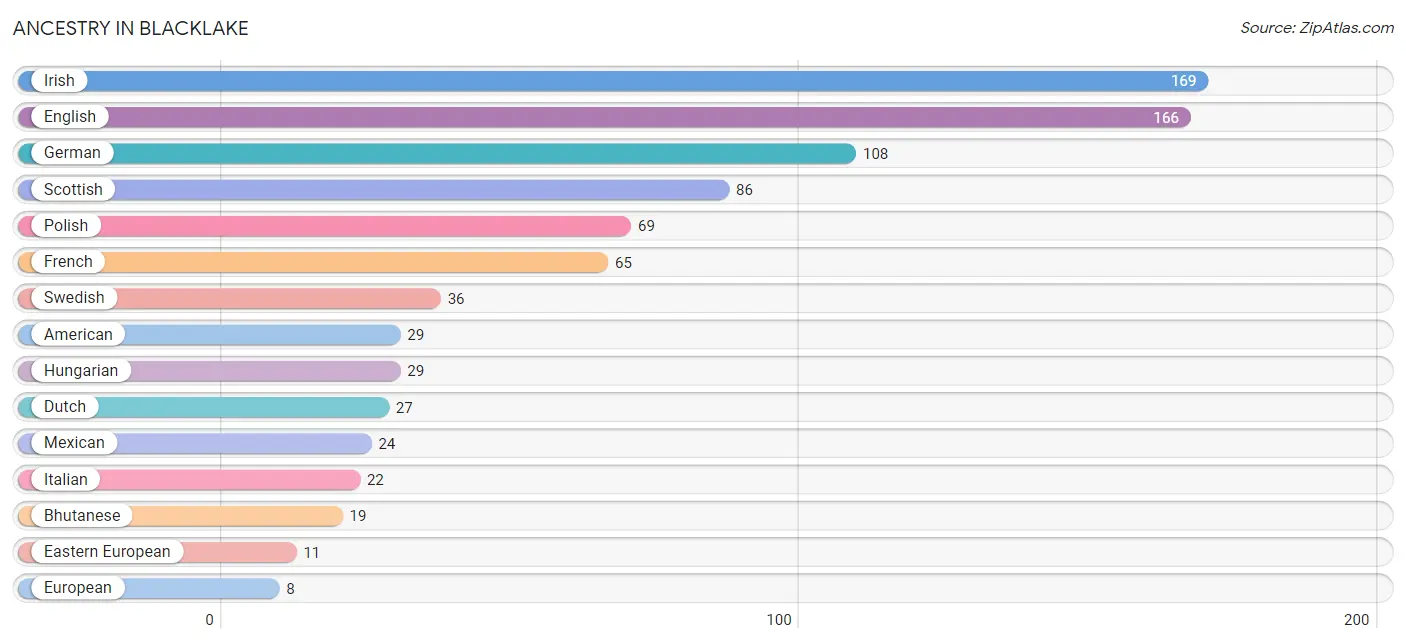
| Ancestry | # Population | % Population |
| American | 29 | 3.5% |
| Bhutanese | 19 | 2.3% |
| Dutch | 27 | 3.3% |
| Eastern European | 11 | 1.3% |
| English | 166 | 20.2% |
| European | 8 | 1.0% |
| French | 65 | 7.9% |
| German | 108 | 13.1% |
| Hungarian | 29 | 3.5% |
| Irish | 169 | 20.5% |
| Italian | 22 | 2.7% |
| Laotian | 8 | 1.0% |
| Mexican | 24 | 2.9% |
| Polish | 69 | 8.4% |
| Scotch-Irish | 6 | 0.7% |
| Scottish | 86 | 10.4% |
| Swedish | 36 | 4.4% | View All 17 Rows |
Immigrants in Blacklake
The most numerous immigrant groups reported in Blacklake came from Europe (21 | 2.5%), Western Europe (21 | 2.5%), Germany (13 | 1.6%), and Netherlands (8 | 1.0%), together accounting for 7.6% of all Blacklake residents.
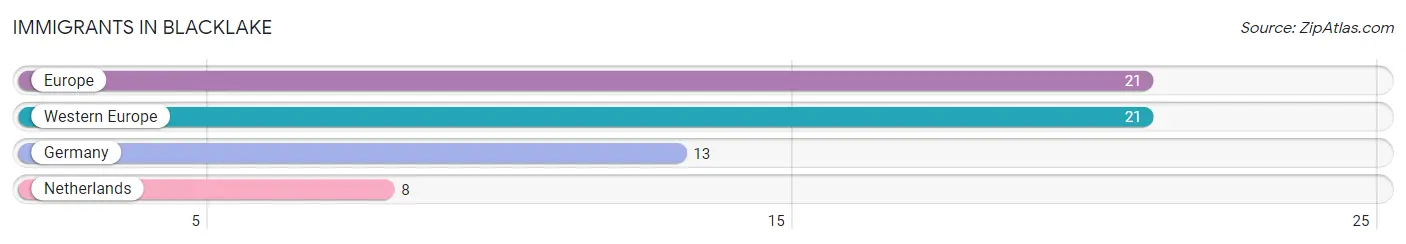
| Immigration Origin | # Population | % Population |
| Europe | 21 | 2.5% |
| Germany | 13 | 1.6% |
| Netherlands | 8 | 1.0% |
| Western Europe | 21 | 2.5% | View All 4 Rows |
Sex and Age in Blacklake
Sex and Age in Blacklake
The most populous age groups in Blacklake are 60 to 64 Years (97 | 22.1%) for men and 70 to 74 Years (88 | 22.9%) for women.
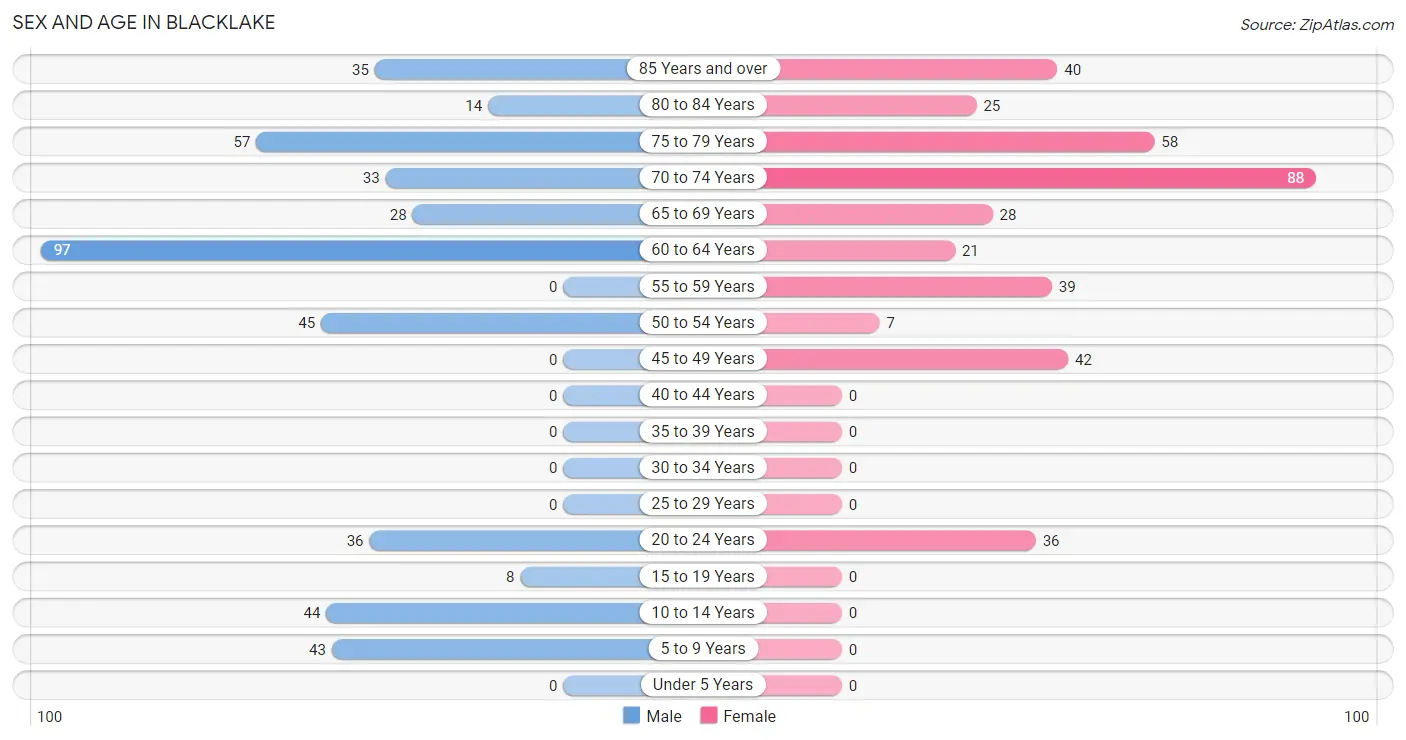
| Age Bracket | Male | Female |
| Under 5 Years | 0 (0.0%) | 0 (0.0%) |
| 5 to 9 Years | 43 (9.8%) | 0 (0.0%) |
| 10 to 14 Years | 44 (10.0%) | 0 (0.0%) |
| 15 to 19 Years | 8 (1.8%) | 0 (0.0%) |
| 20 to 24 Years | 36 (8.2%) | 36 (9.4%) |
| 25 to 29 Years | 0 (0.0%) | 0 (0.0%) |
| 30 to 34 Years | 0 (0.0%) | 0 (0.0%) |
| 35 to 39 Years | 0 (0.0%) | 0 (0.0%) |
| 40 to 44 Years | 0 (0.0%) | 0 (0.0%) |
| 45 to 49 Years | 0 (0.0%) | 42 (10.9%) |
| 50 to 54 Years | 45 (10.2%) | 7 (1.8%) |
| 55 to 59 Years | 0 (0.0%) | 39 (10.2%) |
| 60 to 64 Years | 97 (22.1%) | 21 (5.5%) |
| 65 to 69 Years | 28 (6.4%) | 28 (7.3%) |
| 70 to 74 Years | 33 (7.5%) | 88 (22.9%) |
| 75 to 79 Years | 57 (13.0%) | 58 (15.1%) |
| 80 to 84 Years | 14 (3.2%) | 25 (6.5%) |
| 85 Years and over | 35 (8.0%) | 40 (10.4%) |
| Total | 440 (100.0%) | 384 (100.0%) |
Families and Households in Blacklake
Median Family Size in Blacklake
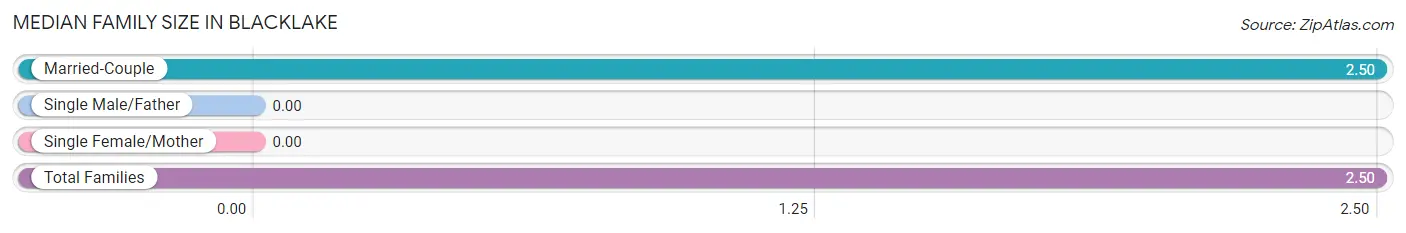
| Family Type | # Families | Family Size |
| Married-Couple | 232 (100.0%) | 2.50 |
| Single Male/Father | 0 (0.0%) | - |
| Single Female/Mother | 0 (0.0%) | - |
| Total Families | 232 (100.0%) | 2.50 |
Median Household Size in Blacklake
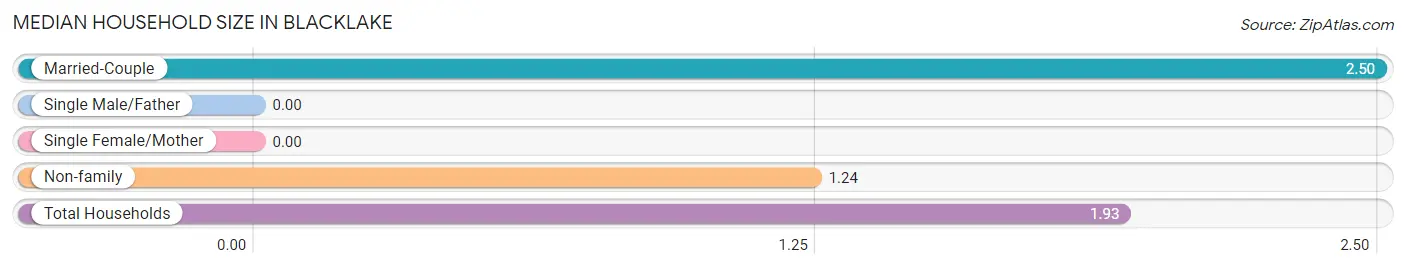
| Household Type | # Households | Household Size |
| Married-Couple | 232 (54.2%) | 2.50 |
| Single Male/Father | 0 (0.0%) | - |
| Single Female/Mother | 0 (0.0%) | - |
| Non-family | 196 (45.8%) | 1.24 |
| Total Households | 428 (100.0%) | 1.93 |
Household Size by Marriage Status in Blacklake
Out of a total of 428 households in Blacklake, 232 (54.2%) are family households, while 196 (45.8%) are nonfamily households. The most numerous type of family households are 2-person households, comprising 184, and the most common type of nonfamily households are 1-person households, comprising 160.
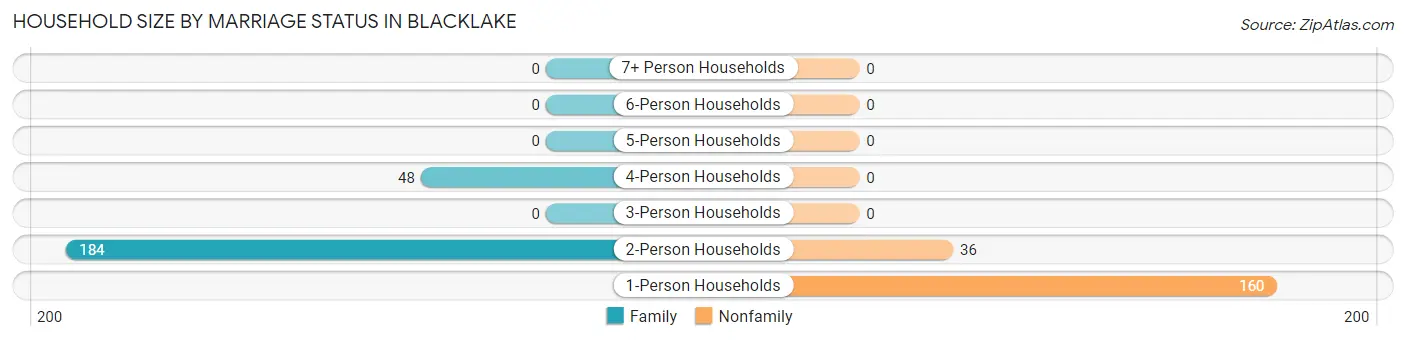
| Household Size | Family Households | Nonfamily Households |
| 1-Person Households | - | 160 (37.4%) |
| 2-Person Households | 184 (43.0%) | 36 (8.4%) |
| 3-Person Households | 0 (0.0%) | 0 (0.0%) |
| 4-Person Households | 48 (11.2%) | 0 (0.0%) |
| 5-Person Households | 0 (0.0%) | 0 (0.0%) |
| 6-Person Households | 0 (0.0%) | 0 (0.0%) |
| 7+ Person Households | 0 (0.0%) | 0 (0.0%) |
| Total | 232 (54.2%) | 196 (45.8%) |
Female Fertility in Blacklake
Fertility by Age in Blacklake

| Age Bracket | Women with Births | Births / 1,000 Women |
| 15 to 19 years | 0 (0.0%) | 0.0 |
| 20 to 34 years | 0 (0.0%) | 0.0 |
| 35 to 50 years | 0 (0.0%) | 0.0 |
| Total | 0 (0.0%) | 0.0 |
Fertility by Age by Marriage Status in Blacklake
| Age Bracket | Married | Unmarried |
| 15 to 19 years | 0 (0.0%) | 0 (0.0%) |
| 20 to 34 years | 0 (0.0%) | 0 (0.0%) |
| 35 to 50 years | 0 (0.0%) | 0 (0.0%) |
| Total | 0 (0.0%) | 0 (0.0%) |
Fertility by Education in Blacklake
| Educational Attainment | Women with Births | Births / 1,000 Women |
| Less than High School | 0 (0.0%) | 0.0 |
| High School Diploma | 0 (0.0%) | 0.0 |
| College or Associate's Degree | 0 (0.0%) | 0.0 |
| Bachelor's Degree | 0 (0.0%) | 0.0 |
| Graduate Degree | 0 (0.0%) | 0.0 |
| Total | 0 (0.0%) | 0.0 |
Fertility by Education by Marriage Status in Blacklake
| Educational Attainment | Married | Unmarried |
| Less than High School | 0 (0.0%) | 0 (0.0%) |
| High School Diploma | 0 (0.0%) | 0 (0.0%) |
| College or Associate's Degree | 0 (0.0%) | 0 (0.0%) |
| Bachelor's Degree | 0 (0.0%) | 0 (0.0%) |
| Graduate Degree | 0 (0.0%) | 0 (0.0%) |
| Total | 0 (0.0%) | 0 (0.0%) |
Employment Characteristics in Blacklake
Employment by Class of Employer in Blacklake
Among the 231 employed individuals in Blacklake, local government employees (69 | 29.9%), self-employed (not incorporated) (47 | 20.3%), and self-employed (incorporated) (45 | 19.5%) make up the most common classes of employment.
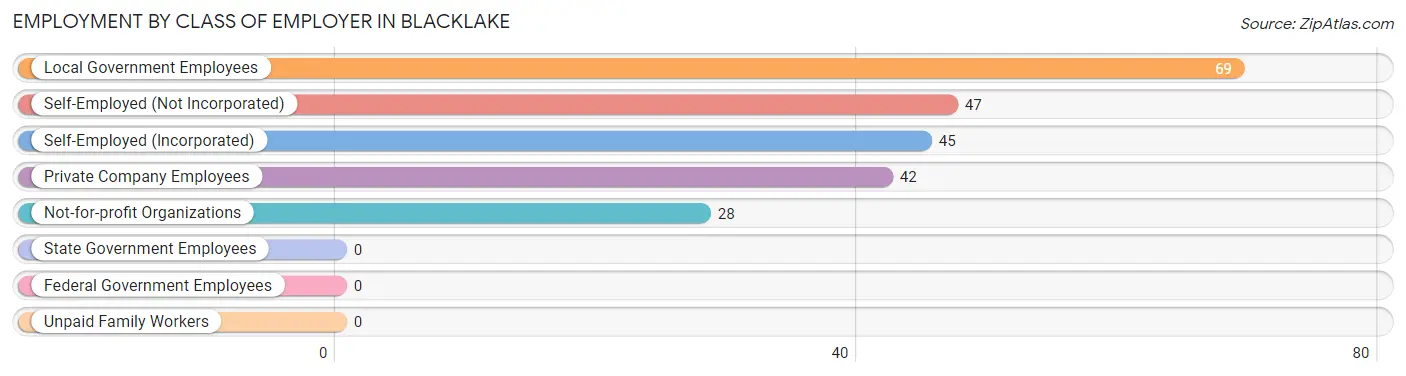
| Employer Class | # Employees | % Employees |
| Private Company Employees | 42 | 18.2% |
| Self-Employed (Incorporated) | 45 | 19.5% |
| Self-Employed (Not Incorporated) | 47 | 20.3% |
| Not-for-profit Organizations | 28 | 12.1% |
| Local Government Employees | 69 | 29.9% |
| State Government Employees | 0 | 0.0% |
| Federal Government Employees | 0 | 0.0% |
| Unpaid Family Workers | 0 | 0.0% |
| Total | 231 | 100.0% |
Employment Status by Age in Blacklake
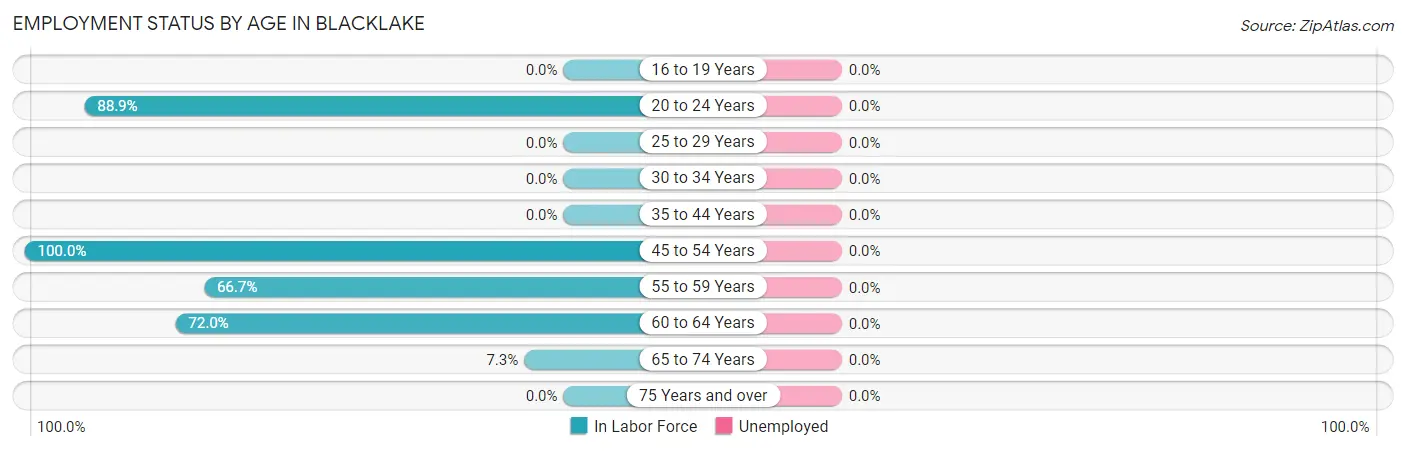
| Age Bracket | In Labor Force | Unemployed |
| 16 to 19 Years | 0 (0.0%) | 0 (0.0%) |
| 20 to 24 Years | 64 (88.9%) | 0 (0.0%) |
| 25 to 29 Years | 0 (0.0%) | 0 (0.0%) |
| 30 to 34 Years | 0 (0.0%) | 0 (0.0%) |
| 35 to 44 Years | 0 (0.0%) | 0 (0.0%) |
| 45 to 54 Years | 94 (100.0%) | 0 (0.0%) |
| 55 to 59 Years | 26 (66.7%) | 0 (0.0%) |
| 60 to 64 Years | 85 (72.0%) | 0 (0.0%) |
| 65 to 74 Years | 13 (7.3%) | 0 (0.0%) |
| 75 Years and over | 0 (0.0%) | 0 (0.0%) |
| Total | 282 (38.3%) | 0 (0.0%) |
Employment Status by Educational Attainment in Blacklake
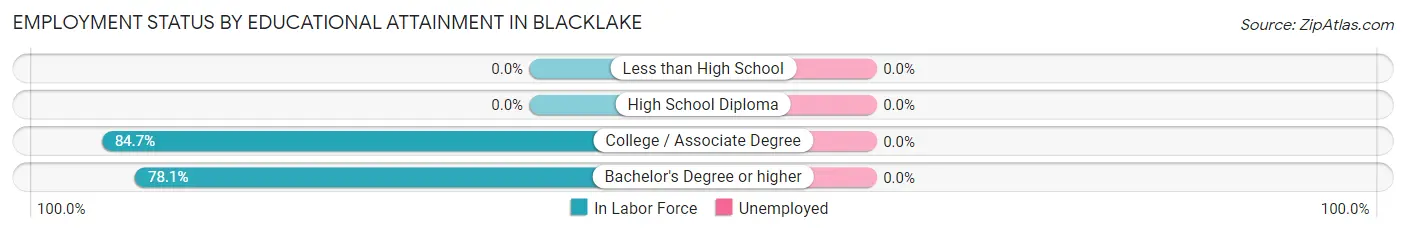
| Educational Attainment | In Labor Force | Unemployed |
| Less than High School | 0 (0.0%) | 0 (0.0%) |
| High School Diploma | 0 (0.0%) | 0 (0.0%) |
| College / Associate Degree | 116 (84.7%) | 0 (0.0%) |
| Bachelor's Degree or higher | 89 (78.1%) | 0 (0.0%) |
| Total | 205 (81.7%) | 0 (0.0%) |
Employment Occupations by Sex in Blacklake
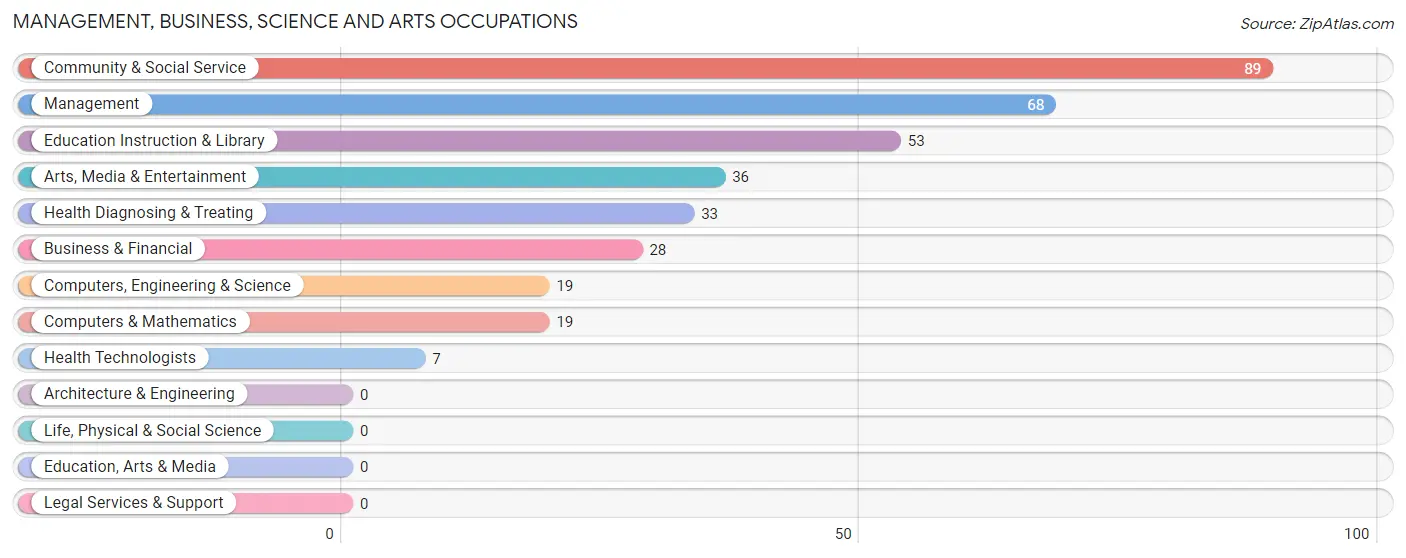
Management, Business, Science and Arts Occupations
The most common Management, Business, Science and Arts occupations in Blacklake are Community & Social Service (89 | 31.6%), Management (68 | 24.1%), Education Instruction & Library (53 | 18.8%), Arts, Media & Entertainment (36 | 12.8%), and Health Diagnosing & Treating (33 | 11.7%).
Management, Business, Science and Arts Occupations by Sex
Within the Management, Business, Science and Arts occupations in Blacklake, the most male-oriented occupations are Management (100.0%), Business & Financial (100.0%), and Computers, Engineering & Science (100.0%), while the most female-oriented occupations are Arts, Media & Entertainment (100.0%), Health Diagnosing & Treating (100.0%), and Health Technologists (100.0%).
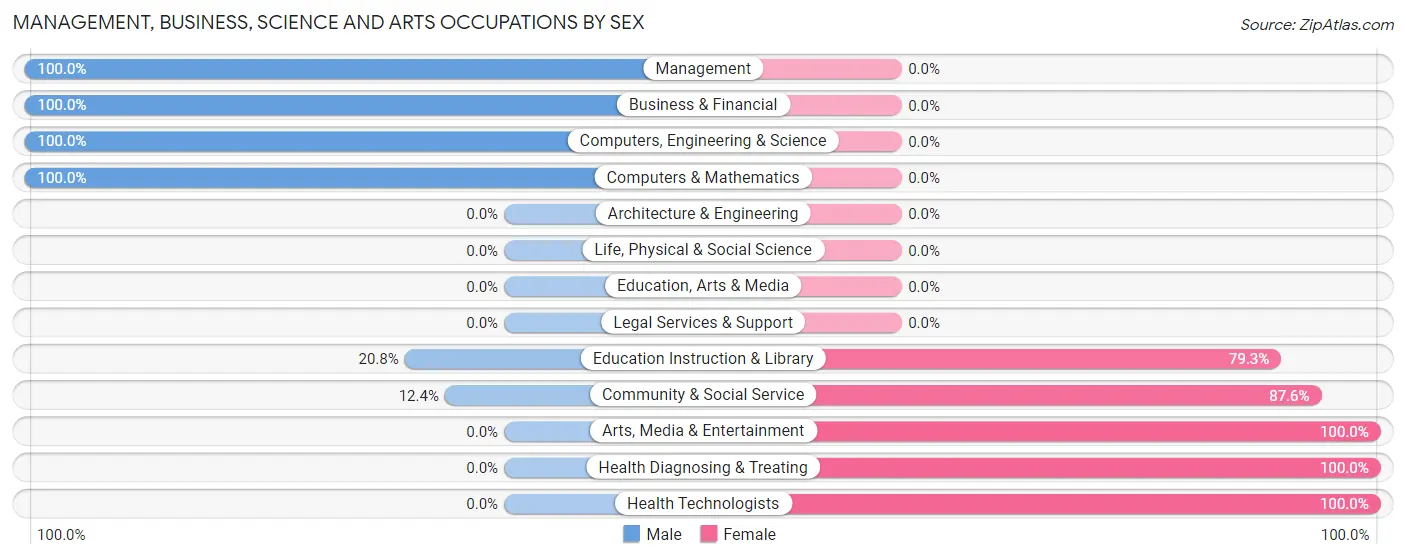
| Occupation | Male | Female |
| Management | 68 (100.0%) | 0 (0.0%) |
| Business & Financial | 28 (100.0%) | 0 (0.0%) |
| Computers, Engineering & Science | 19 (100.0%) | 0 (0.0%) |
| Computers & Mathematics | 19 (100.0%) | 0 (0.0%) |
| Architecture & Engineering | 0 (0.0%) | 0 (0.0%) |
| Life, Physical & Social Science | 0 (0.0%) | 0 (0.0%) |
| Community & Social Service | 11 (12.4%) | 78 (87.6%) |
| Education, Arts & Media | 0 (0.0%) | 0 (0.0%) |
| Legal Services & Support | 0 (0.0%) | 0 (0.0%) |
| Education Instruction & Library | 11 (20.7%) | 42 (79.2%) |
| Arts, Media & Entertainment | 0 (0.0%) | 36 (100.0%) |
| Health Diagnosing & Treating | 0 (0.0%) | 33 (100.0%) |
| Health Technologists | 0 (0.0%) | 7 (100.0%) |
| Total (Category) | 126 (53.2%) | 111 (46.8%) |
| Total (Overall) | 171 (60.6%) | 111 (39.4%) |
Services Occupations
Services Occupations by Sex
| Occupation | Male | Female |
| Healthcare Support | 0 (0.0%) | 0 (0.0%) |
| Security & Protection | 0 (0.0%) | 0 (0.0%) |
| Firefighting & Prevention | 0 (0.0%) | 0 (0.0%) |
| Law Enforcement | 0 (0.0%) | 0 (0.0%) |
| Food Preparation & Serving | 0 (0.0%) | 0 (0.0%) |
| Cleaning & Maintenance | 0 (0.0%) | 0 (0.0%) |
| Personal Care & Service | 0 (0.0%) | 0 (0.0%) |
| Total (Category) | 0 (0.0%) | 0 (0.0%) |
| Total (Overall) | 171 (60.6%) | 111 (39.4%) |
Sales and Office Occupations
Sales and Office Occupations by Sex
| Occupation | Male | Female |
| Sales & Related | 0 (0.0%) | 0 (0.0%) |
| Office & Administration | 0 (0.0%) | 0 (0.0%) |
| Total (Category) | 0 (0.0%) | 0 (0.0%) |
| Total (Overall) | 171 (60.6%) | 111 (39.4%) |
Natural Resources, Construction and Maintenance Occupations
The most common Natural Resources, Construction and Maintenance occupations in Blacklake are , and Installation, Maintenance & Repair (45 | 16.0%).
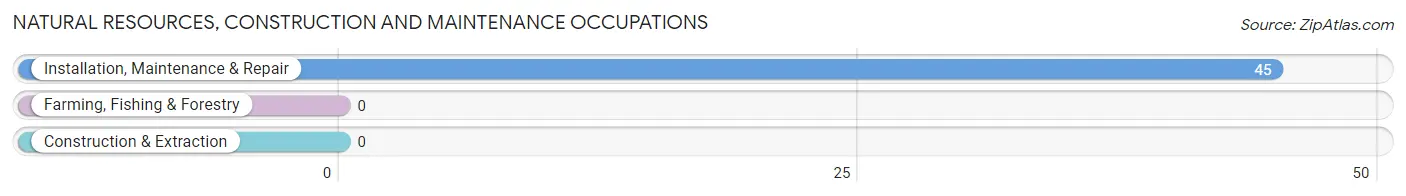
Natural Resources, Construction and Maintenance Occupations by Sex
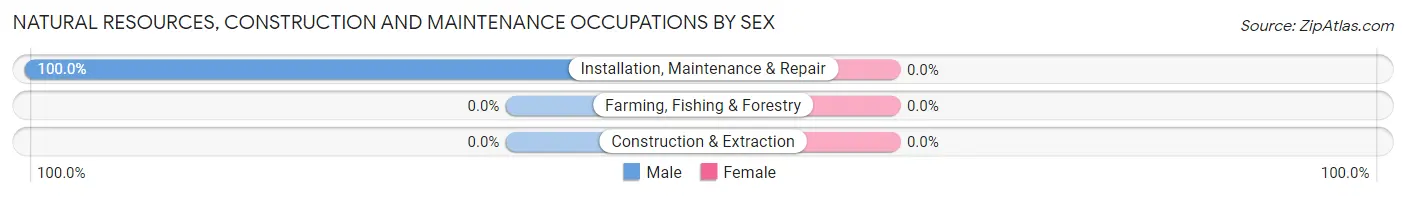
| Occupation | Male | Female |
| Farming, Fishing & Forestry | 0 (0.0%) | 0 (0.0%) |
| Construction & Extraction | 0 (0.0%) | 0 (0.0%) |
| Installation, Maintenance & Repair | 45 (100.0%) | 0 (0.0%) |
| Total (Category) | 45 (100.0%) | 0 (0.0%) |
| Total (Overall) | 171 (60.6%) | 111 (39.4%) |
Production, Transportation and Moving Occupations
Production, Transportation and Moving Occupations by Sex
| Occupation | Male | Female |
| Production | 0 (0.0%) | 0 (0.0%) |
| Transportation | 0 (0.0%) | 0 (0.0%) |
| Material Moving | 0 (0.0%) | 0 (0.0%) |
| Total (Category) | 0 (0.0%) | 0 (0.0%) |
| Total (Overall) | 171 (60.6%) | 111 (39.4%) |
Employment Industries by Sex in Blacklake
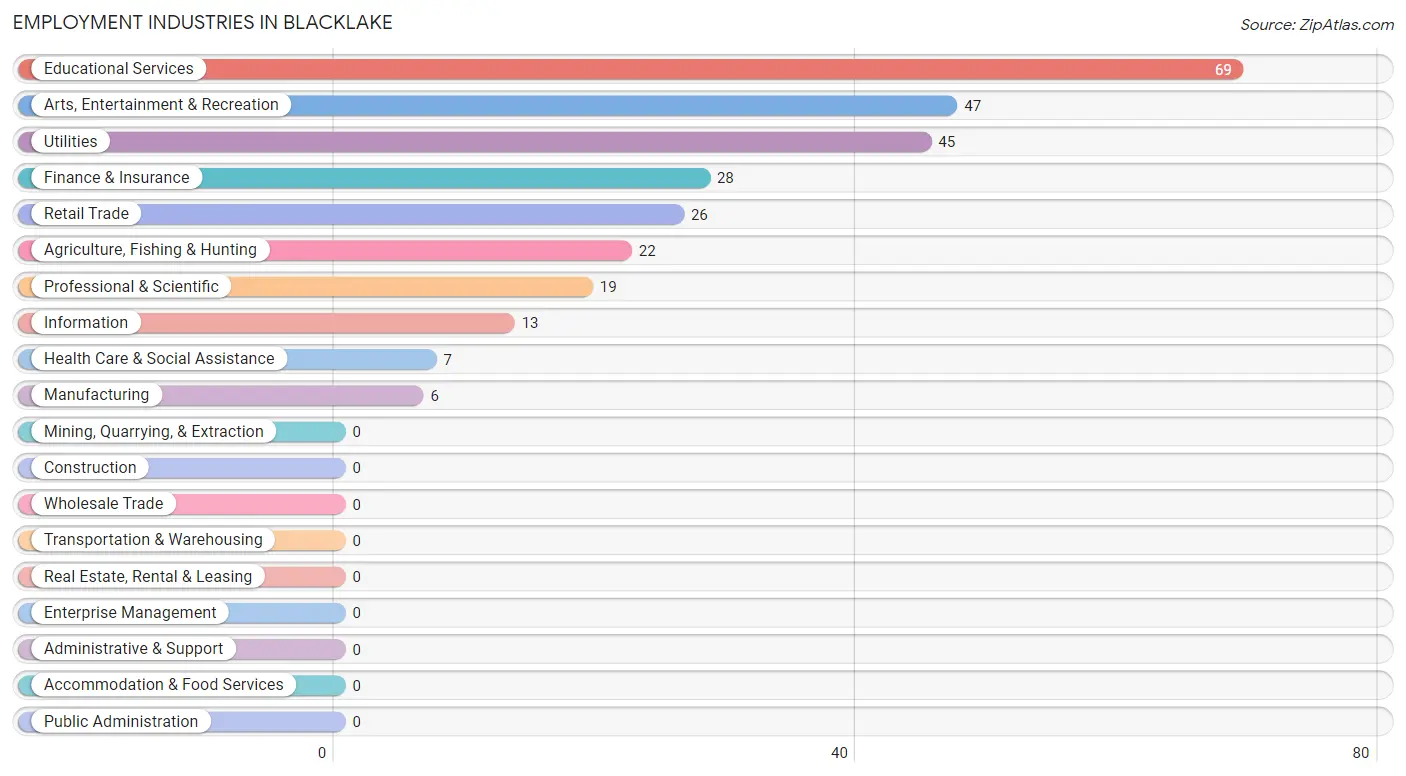
Employment Industries in Blacklake
The major employment industries in Blacklake include Educational Services (69 | 24.5%), Arts, Entertainment & Recreation (47 | 16.7%), Utilities (45 | 16.0%), Finance & Insurance (28 | 9.9%), and Retail Trade (26 | 9.2%).
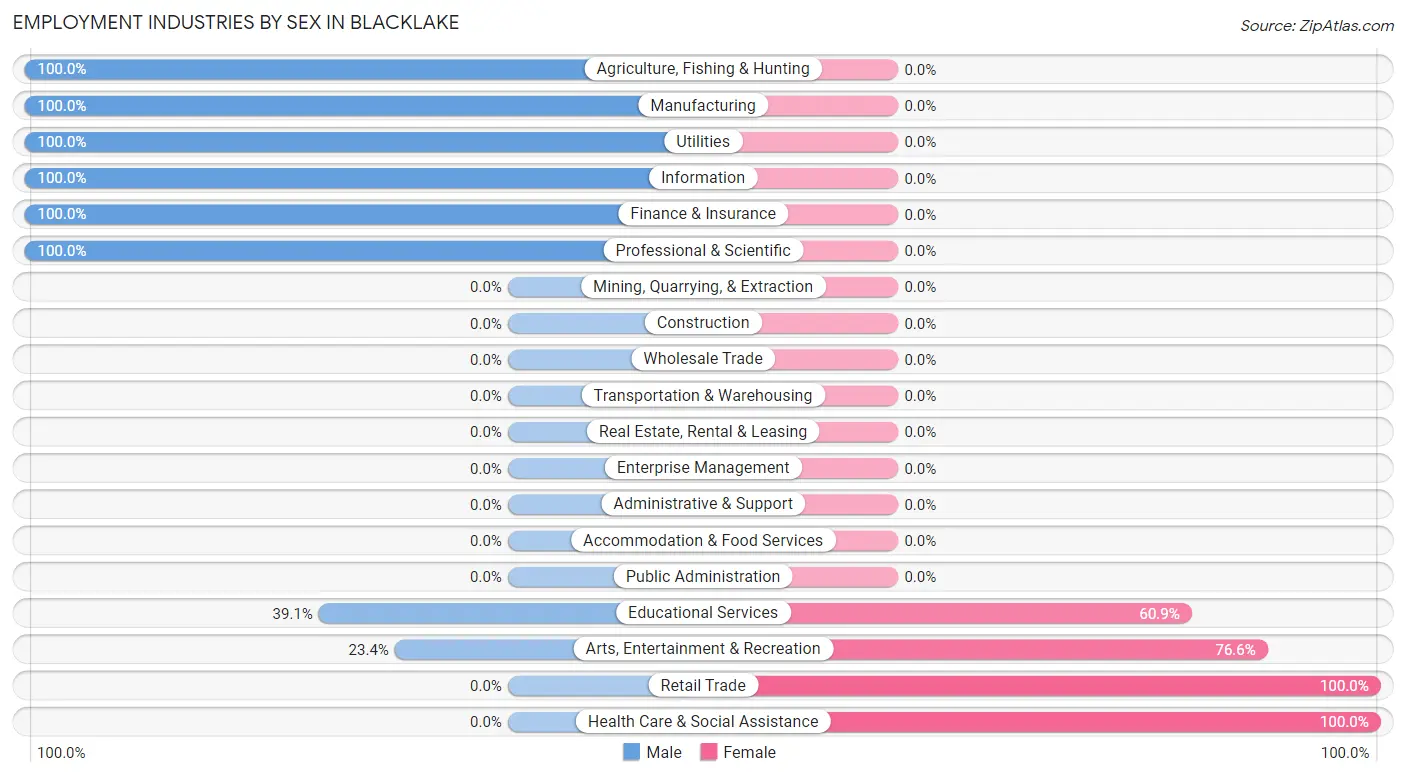
Employment Industries by Sex in Blacklake
The Blacklake industries that see more men than women are Agriculture, Fishing & Hunting (100.0%), Manufacturing (100.0%), and Utilities (100.0%), whereas the industries that tend to have a higher number of women are Retail Trade (100.0%), Health Care & Social Assistance (100.0%), and Arts, Entertainment & Recreation (76.6%).
| Industry | Male | Female |
| Agriculture, Fishing & Hunting | 22 (100.0%) | 0 (0.0%) |
| Mining, Quarrying, & Extraction | 0 (0.0%) | 0 (0.0%) |
| Construction | 0 (0.0%) | 0 (0.0%) |
| Manufacturing | 6 (100.0%) | 0 (0.0%) |
| Wholesale Trade | 0 (0.0%) | 0 (0.0%) |
| Retail Trade | 0 (0.0%) | 26 (100.0%) |
| Transportation & Warehousing | 0 (0.0%) | 0 (0.0%) |
| Utilities | 45 (100.0%) | 0 (0.0%) |
| Information | 13 (100.0%) | 0 (0.0%) |
| Finance & Insurance | 28 (100.0%) | 0 (0.0%) |
| Real Estate, Rental & Leasing | 0 (0.0%) | 0 (0.0%) |
| Professional & Scientific | 19 (100.0%) | 0 (0.0%) |
| Enterprise Management | 0 (0.0%) | 0 (0.0%) |
| Administrative & Support | 0 (0.0%) | 0 (0.0%) |
| Educational Services | 27 (39.1%) | 42 (60.9%) |
| Health Care & Social Assistance | 0 (0.0%) | 7 (100.0%) |
| Arts, Entertainment & Recreation | 11 (23.4%) | 36 (76.6%) |
| Accommodation & Food Services | 0 (0.0%) | 0 (0.0%) |
| Public Administration | 0 (0.0%) | 0 (0.0%) |
| Total | 171 (60.6%) | 111 (39.4%) |
Education in Blacklake
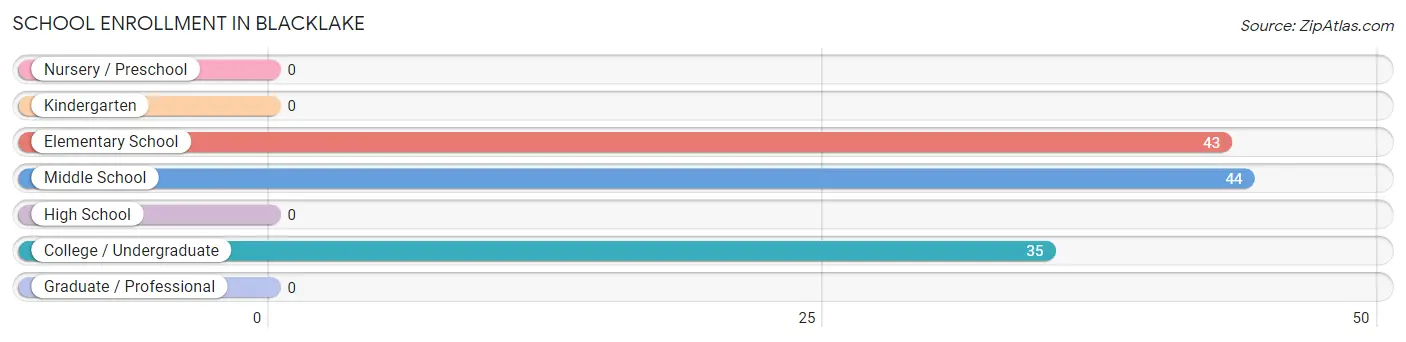
School Enrollment in Blacklake
The most common levels of schooling among the 122 students in Blacklake are middle school (44 | 36.1%), elementary school (43 | 35.2%), and college / undergraduate (35 | 28.7%).
| School Level | # Students | % Students |
| Nursery / Preschool | 0 | 0.0% |
| Kindergarten | 0 | 0.0% |
| Elementary School | 43 | 35.2% |
| Middle School | 44 | 36.1% |
| High School | 0 | 0.0% |
| College / Undergraduate | 35 | 28.7% |
| Graduate / Professional | 0 | 0.0% |
| Total | 122 | 100.0% |
School Enrollment by Age by Funding Source in Blacklake
Out of a total of 122 students who are enrolled in schools in Blacklake, 43 (35.2%) attend a private institution, while the remaining 79 (64.8%) are enrolled in public schools. The age group of 5 to 9 year old has the highest likelihood of being enrolled in private schools, with 43 (100.0% in the age bracket) enrolled. Conversely, the age group of 10 to 14 year olds has the lowest likelihood of being enrolled in a private school, with 44 (100.0% in the age bracket) attending a public institution.
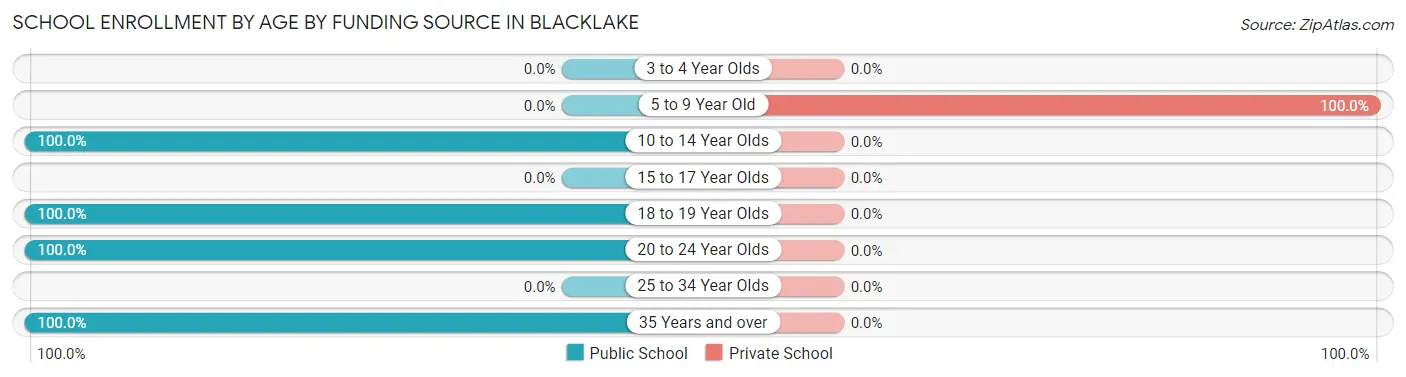
| Age Bracket | Public School | Private School |
| 3 to 4 Year Olds | 0 (0.0%) | 0 (0.0%) |
| 5 to 9 Year Old | 0 (0.0%) | 43 (100.0%) |
| 10 to 14 Year Olds | 44 (100.0%) | 0 (0.0%) |
| 15 to 17 Year Olds | 0 (0.0%) | 0 (0.0%) |
| 18 to 19 Year Olds | 8 (100.0%) | 0 (0.0%) |
| 20 to 24 Year Olds | 8 (100.0%) | 0 (0.0%) |
| 25 to 34 Year Olds | 0 (0.0%) | 0 (0.0%) |
| 35 Years and over | 19 (100.0%) | 0 (0.0%) |
| Total | 79 (64.8%) | 43 (35.2%) |
Educational Attainment by Field of Study in Blacklake
Education (103 | 33.9%), business (94 | 30.9%), computers & mathematics (52 | 17.1%), engineering (43 | 14.1%), and bio, nature & agricultural (6 | 2.0%) are the most common fields of study among 304 individuals in Blacklake who have obtained a bachelor's degree or higher.
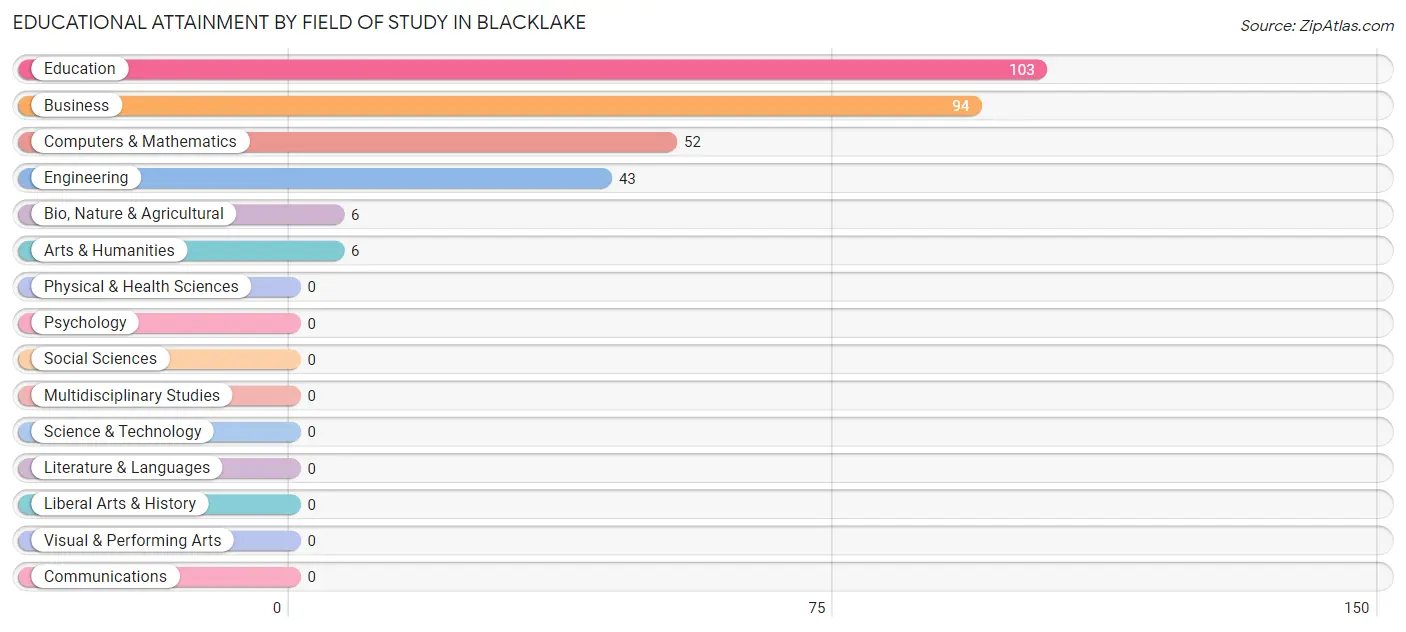
| Field of Study | # Graduates | % Graduates |
| Computers & Mathematics | 52 | 17.1% |
| Bio, Nature & Agricultural | 6 | 2.0% |
| Physical & Health Sciences | 0 | 0.0% |
| Psychology | 0 | 0.0% |
| Social Sciences | 0 | 0.0% |
| Engineering | 43 | 14.1% |
| Multidisciplinary Studies | 0 | 0.0% |
| Science & Technology | 0 | 0.0% |
| Business | 94 | 30.9% |
| Education | 103 | 33.9% |
| Literature & Languages | 0 | 0.0% |
| Liberal Arts & History | 0 | 0.0% |
| Visual & Performing Arts | 0 | 0.0% |
| Communications | 0 | 0.0% |
| Arts & Humanities | 6 | 2.0% |
| Total | 304 | 100.0% |
Transportation & Commute in Blacklake
Vehicle Availability by Sex in Blacklake
The most prevalent vehicle ownership categories in Blacklake are males with 2 vehicles (71, accounting for 59.2%) and females with 2 vehicles (78, making up 64.0%).
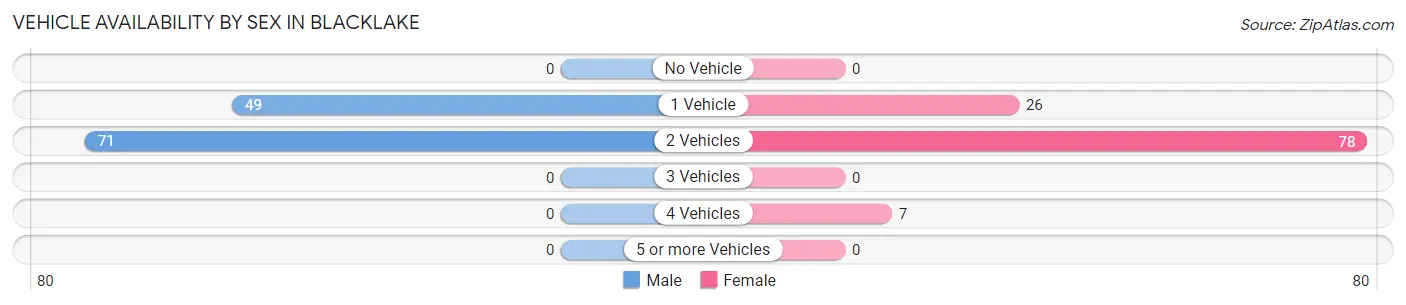
| Vehicles Available | Male | Female |
| No Vehicle | 0 (0.0%) | 0 (0.0%) |
| 1 Vehicle | 49 (40.8%) | 26 (23.4%) |
| 2 Vehicles | 71 (59.2%) | 78 (70.3%) |
| 3 Vehicles | 0 (0.0%) | 0 (0.0%) |
| 4 Vehicles | 0 (0.0%) | 7 (6.3%) |
| 5 or more Vehicles | 0 (0.0%) | 0 (0.0%) |
| Total | 120 (100.0%) | 111 (100.0%) |
Commute Time in Blacklake
The most frequently occuring commute durations in Blacklake are 15 to 19 minutes (71 commuters, 34.3%), 20 to 24 minutes (49 commuters, 23.7%), and 10 to 14 minutes (45 commuters, 21.7%).
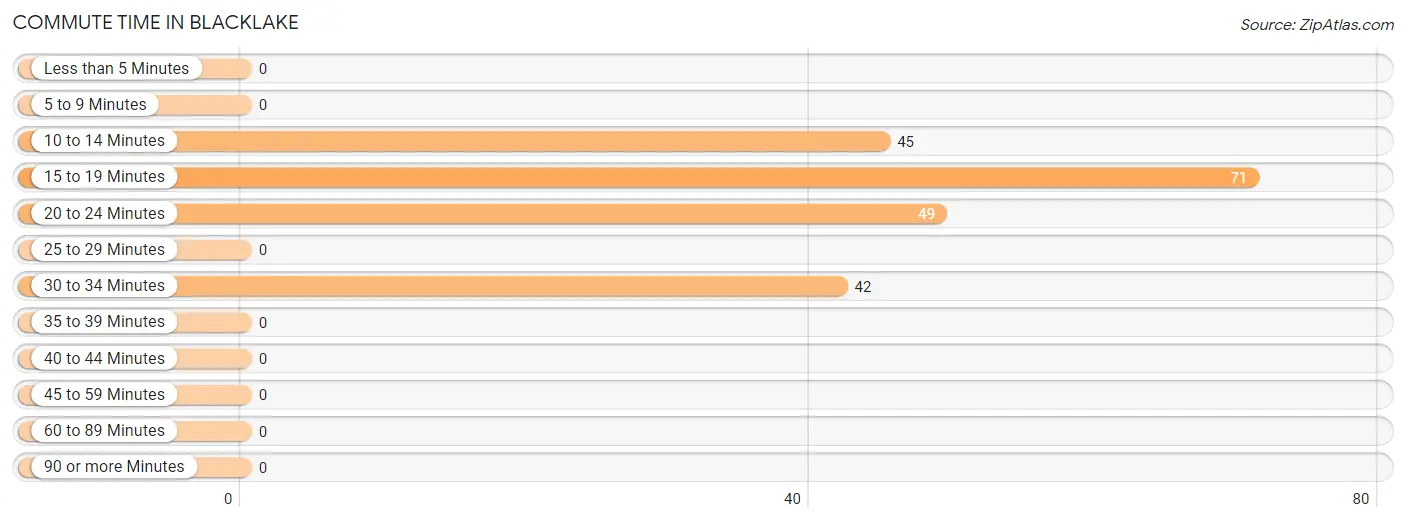
| Commute Time | # Commuters | % Commuters |
| Less than 5 Minutes | 0 | 0.0% |
| 5 to 9 Minutes | 0 | 0.0% |
| 10 to 14 Minutes | 45 | 21.7% |
| 15 to 19 Minutes | 71 | 34.3% |
| 20 to 24 Minutes | 49 | 23.7% |
| 25 to 29 Minutes | 0 | 0.0% |
| 30 to 34 Minutes | 42 | 20.3% |
| 35 to 39 Minutes | 0 | 0.0% |
| 40 to 44 Minutes | 0 | 0.0% |
| 45 to 59 Minutes | 0 | 0.0% |
| 60 to 89 Minutes | 0 | 0.0% |
| 90 or more Minutes | 0 | 0.0% |
Commute Time by Sex in Blacklake
The most common commute times in Blacklake are 20 to 24 minutes (49 commuters, 51.0%) for males and 15 to 19 minutes (43 commuters, 38.7%) for females.
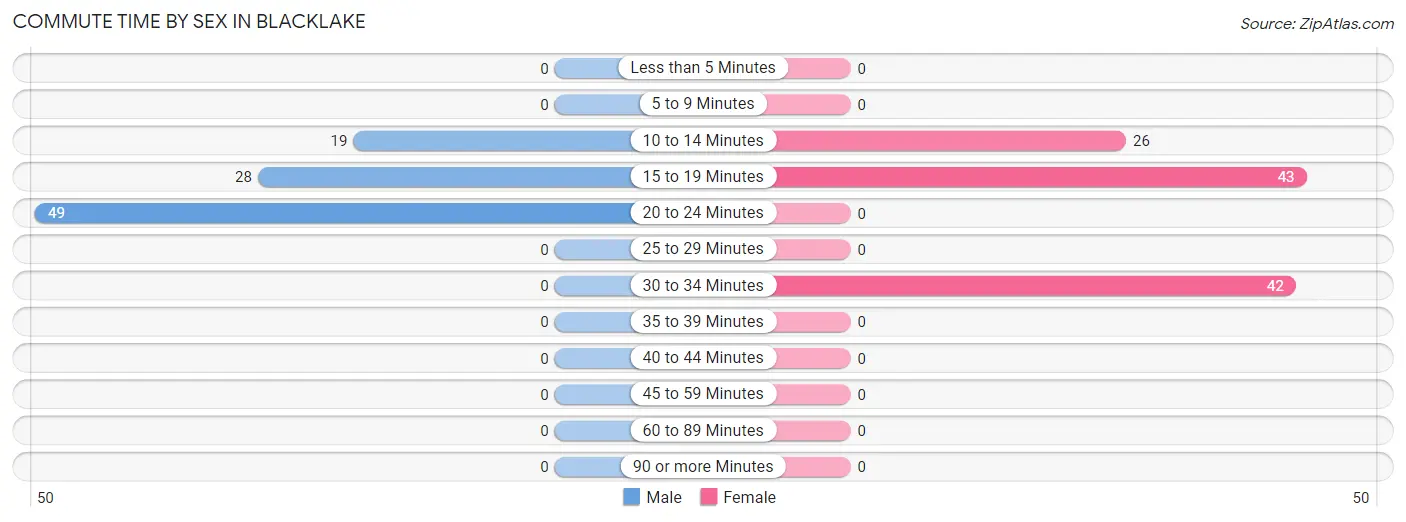
| Commute Time | Male | Female |
| Less than 5 Minutes | 0 (0.0%) | 0 (0.0%) |
| 5 to 9 Minutes | 0 (0.0%) | 0 (0.0%) |
| 10 to 14 Minutes | 19 (19.8%) | 26 (23.4%) |
| 15 to 19 Minutes | 28 (29.2%) | 43 (38.7%) |
| 20 to 24 Minutes | 49 (51.0%) | 0 (0.0%) |
| 25 to 29 Minutes | 0 (0.0%) | 0 (0.0%) |
| 30 to 34 Minutes | 0 (0.0%) | 42 (37.8%) |
| 35 to 39 Minutes | 0 (0.0%) | 0 (0.0%) |
| 40 to 44 Minutes | 0 (0.0%) | 0 (0.0%) |
| 45 to 59 Minutes | 0 (0.0%) | 0 (0.0%) |
| 60 to 89 Minutes | 0 (0.0%) | 0 (0.0%) |
| 90 or more Minutes | 0 (0.0%) | 0 (0.0%) |
Time of Departure to Work by Sex in Blacklake
The most frequent times of departure to work in Blacklake are 8:30 AM to 8:59 AM (28, 29.2%) for males and 9:00 AM to 9:59 AM (43, 38.7%) for females.
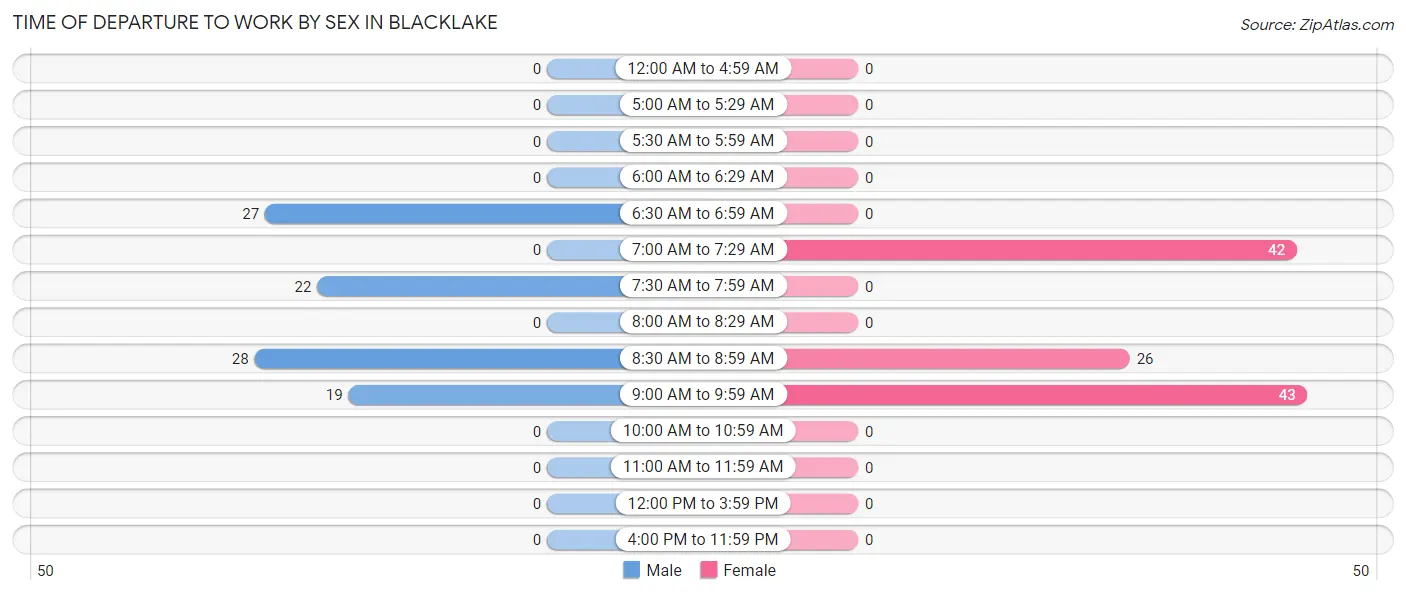
| Time of Departure | Male | Female |
| 12:00 AM to 4:59 AM | 0 (0.0%) | 0 (0.0%) |
| 5:00 AM to 5:29 AM | 0 (0.0%) | 0 (0.0%) |
| 5:30 AM to 5:59 AM | 0 (0.0%) | 0 (0.0%) |
| 6:00 AM to 6:29 AM | 0 (0.0%) | 0 (0.0%) |
| 6:30 AM to 6:59 AM | 27 (28.1%) | 0 (0.0%) |
| 7:00 AM to 7:29 AM | 0 (0.0%) | 42 (37.8%) |
| 7:30 AM to 7:59 AM | 22 (22.9%) | 0 (0.0%) |
| 8:00 AM to 8:29 AM | 0 (0.0%) | 0 (0.0%) |
| 8:30 AM to 8:59 AM | 28 (29.2%) | 26 (23.4%) |
| 9:00 AM to 9:59 AM | 19 (19.8%) | 43 (38.7%) |
| 10:00 AM to 10:59 AM | 0 (0.0%) | 0 (0.0%) |
| 11:00 AM to 11:59 AM | 0 (0.0%) | 0 (0.0%) |
| 12:00 PM to 3:59 PM | 0 (0.0%) | 0 (0.0%) |
| 4:00 PM to 11:59 PM | 0 (0.0%) | 0 (0.0%) |
| Total | 96 (100.0%) | 111 (100.0%) |
Housing Occupancy in Blacklake
Occupancy by Ownership in Blacklake
Of the total 428 dwellings in Blacklake, owner-occupied units account for 395 (92.3%), while renter-occupied units make up 33 (7.7%).
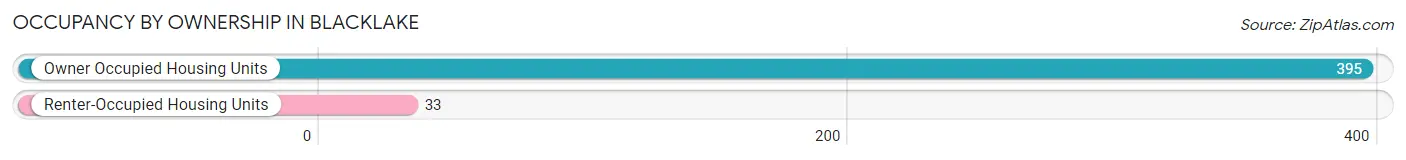
| Occupancy | # Housing Units | % Housing Units |
| Owner Occupied Housing Units | 395 | 92.3% |
| Renter-Occupied Housing Units | 33 | 7.7% |
| Total Occupied Housing Units | 428 | 100.0% |
Occupancy by Household Size in Blacklake
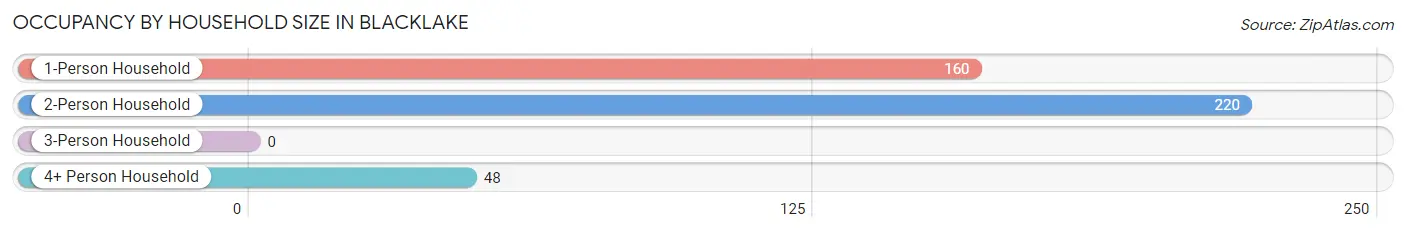
| Household Size | # Housing Units | % Housing Units |
| 1-Person Household | 160 | 37.4% |
| 2-Person Household | 220 | 51.4% |
| 3-Person Household | 0 | 0.0% |
| 4+ Person Household | 48 | 11.2% |
| Total Housing Units | 428 | 100.0% |
Occupancy by Ownership by Household Size in Blacklake
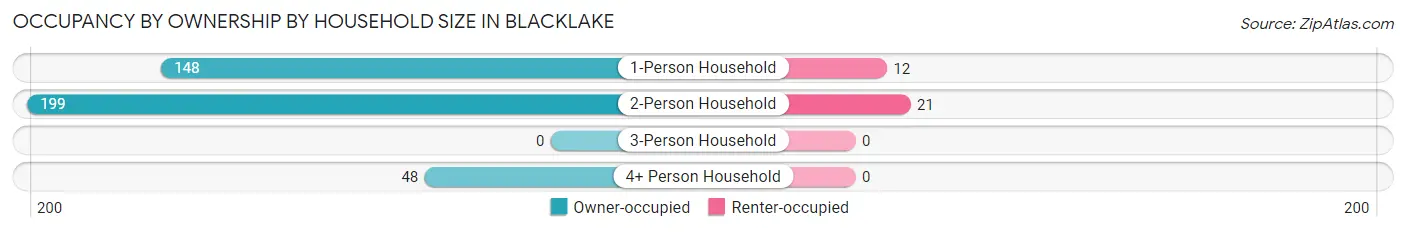
| Household Size | Owner-occupied | Renter-occupied |
| 1-Person Household | 148 (92.5%) | 12 (7.5%) |
| 2-Person Household | 199 (90.4%) | 21 (9.6%) |
| 3-Person Household | 0 (0.0%) | 0 (0.0%) |
| 4+ Person Household | 48 (100.0%) | 0 (0.0%) |
| Total Housing Units | 395 (92.3%) | 33 (7.7%) |
Occupancy by Educational Attainment in Blacklake
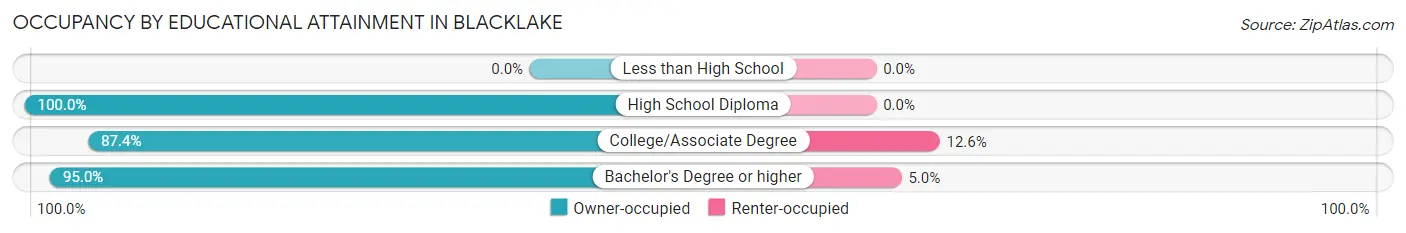
| Household Size | Owner-occupied | Renter-occupied |
| Less than High School | 0 (0.0%) | 0 (0.0%) |
| High School Diploma | 22 (100.0%) | 0 (0.0%) |
| College/Associate Degree | 146 (87.4%) | 21 (12.6%) |
| Bachelor's Degree or higher | 227 (95.0%) | 12 (5.0%) |
Occupancy by Age of Householder in Blacklake
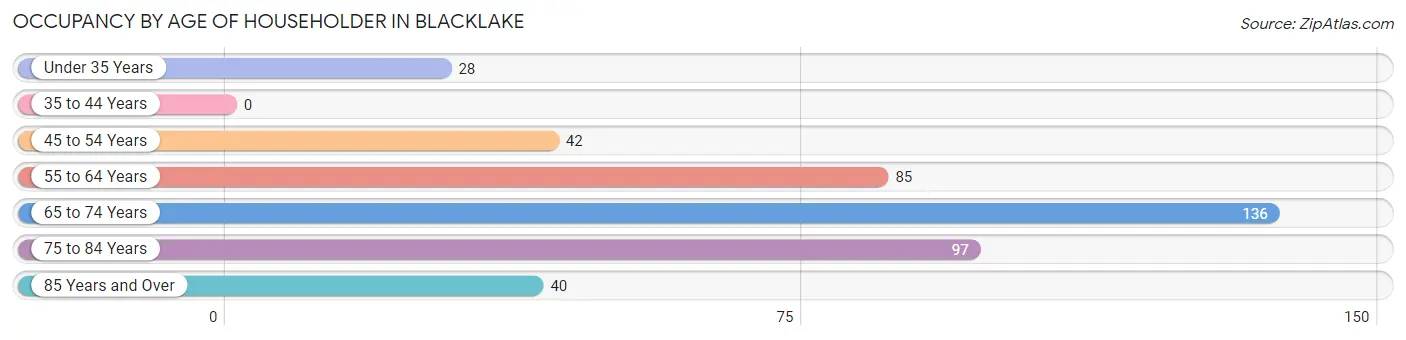
| Age Bracket | # Households | % Households |
| Under 35 Years | 28 | 6.5% |
| 35 to 44 Years | 0 | 0.0% |
| 45 to 54 Years | 42 | 9.8% |
| 55 to 64 Years | 85 | 19.9% |
| 65 to 74 Years | 136 | 31.8% |
| 75 to 84 Years | 97 | 22.7% |
| 85 Years and Over | 40 | 9.3% |
| Total | 428 | 100.0% |
Housing Finances in Blacklake
Median Income by Occupancy in Blacklake
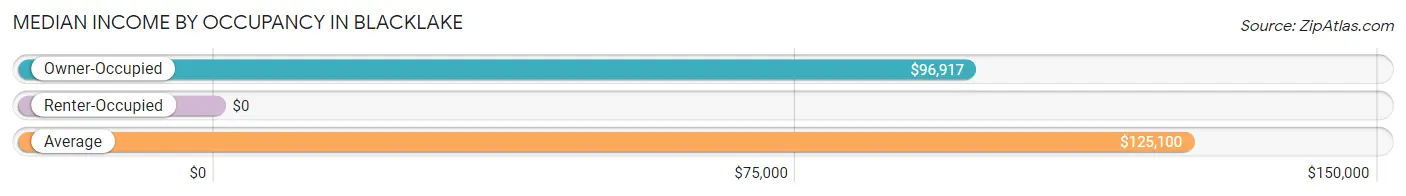
| Occupancy Type | # Households | Median Income |
| Owner-Occupied | 395 (92.3%) | $96,917 |
| Renter-Occupied | 33 (7.7%) | $0 |
| Average | 428 (100.0%) | $125,100 |
Occupancy by Householder Income Bracket in Blacklake
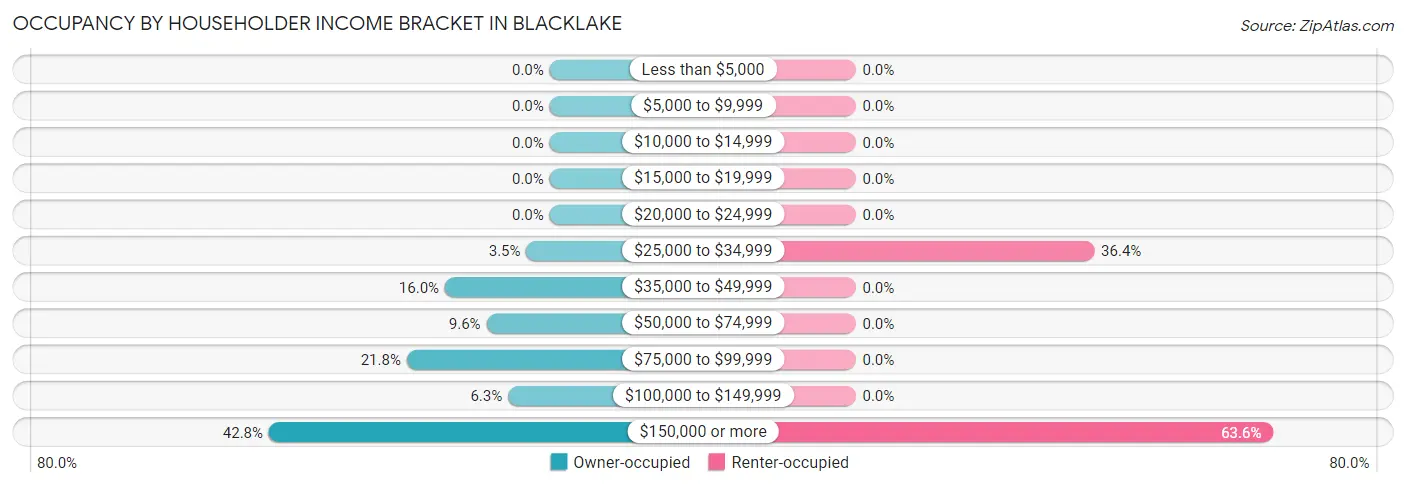
| Income Bracket | Owner-occupied | Renter-occupied |
| Less than $5,000 | 0 (0.0%) | 0 (0.0%) |
| $5,000 to $9,999 | 0 (0.0%) | 0 (0.0%) |
| $10,000 to $14,999 | 0 (0.0%) | 0 (0.0%) |
| $15,000 to $19,999 | 0 (0.0%) | 0 (0.0%) |
| $20,000 to $24,999 | 0 (0.0%) | 0 (0.0%) |
| $25,000 to $34,999 | 14 (3.5%) | 12 (36.4%) |
| $35,000 to $49,999 | 63 (16.0%) | 0 (0.0%) |
| $50,000 to $74,999 | 38 (9.6%) | 0 (0.0%) |
| $75,000 to $99,999 | 86 (21.8%) | 0 (0.0%) |
| $100,000 to $149,999 | 25 (6.3%) | 0 (0.0%) |
| $150,000 or more | 169 (42.8%) | 21 (63.6%) |
| Total | 395 (100.0%) | 33 (100.0%) |
Monthly Housing Cost Tiers in Blacklake
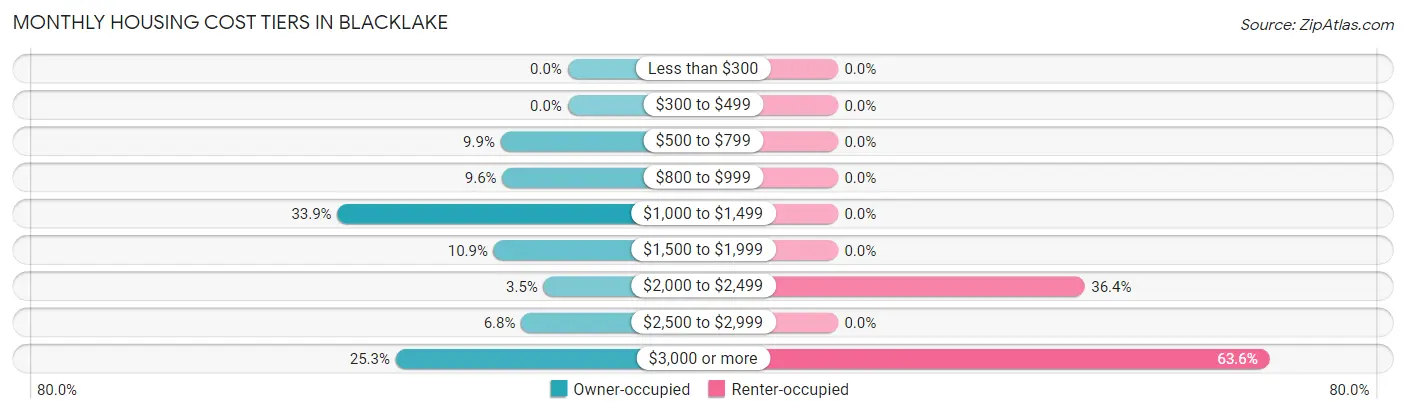
| Monthly Cost | Owner-occupied | Renter-occupied |
| Less than $300 | 0 (0.0%) | 0 (0.0%) |
| $300 to $499 | 0 (0.0%) | 0 (0.0%) |
| $500 to $799 | 39 (9.9%) | 0 (0.0%) |
| $800 to $999 | 38 (9.6%) | 0 (0.0%) |
| $1,000 to $1,499 | 134 (33.9%) | 0 (0.0%) |
| $1,500 to $1,999 | 43 (10.9%) | 0 (0.0%) |
| $2,000 to $2,499 | 14 (3.5%) | 12 (36.4%) |
| $2,500 to $2,999 | 27 (6.8%) | 0 (0.0%) |
| $3,000 or more | 100 (25.3%) | 21 (63.6%) |
| Total | 395 (100.0%) | 33 (100.0%) |
Physical Housing Characteristics in Blacklake
Housing Structures in Blacklake
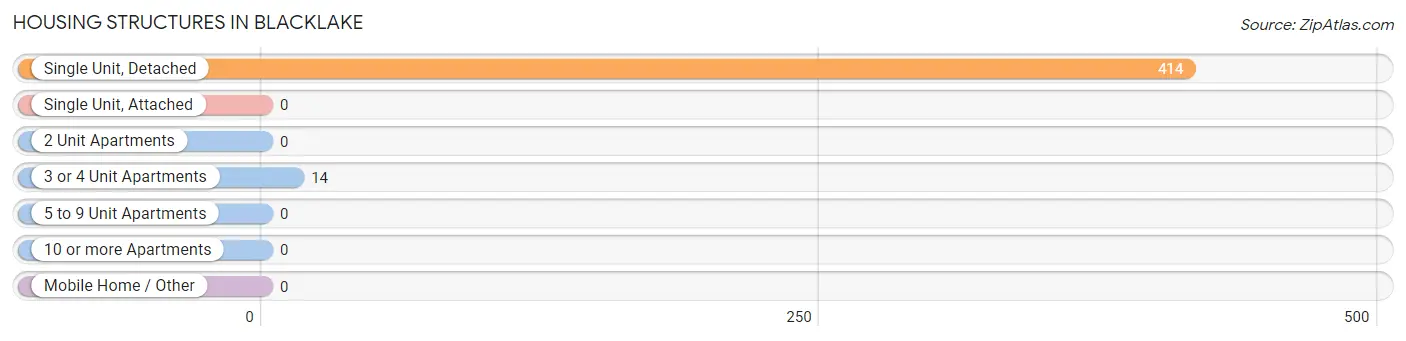
| Structure Type | # Housing Units | % Housing Units |
| Single Unit, Detached | 414 | 96.7% |
| Single Unit, Attached | 0 | 0.0% |
| 2 Unit Apartments | 0 | 0.0% |
| 3 or 4 Unit Apartments | 14 | 3.3% |
| 5 to 9 Unit Apartments | 0 | 0.0% |
| 10 or more Apartments | 0 | 0.0% |
| Mobile Home / Other | 0 | 0.0% |
| Total | 428 | 100.0% |
Housing Structures by Occupancy in Blacklake
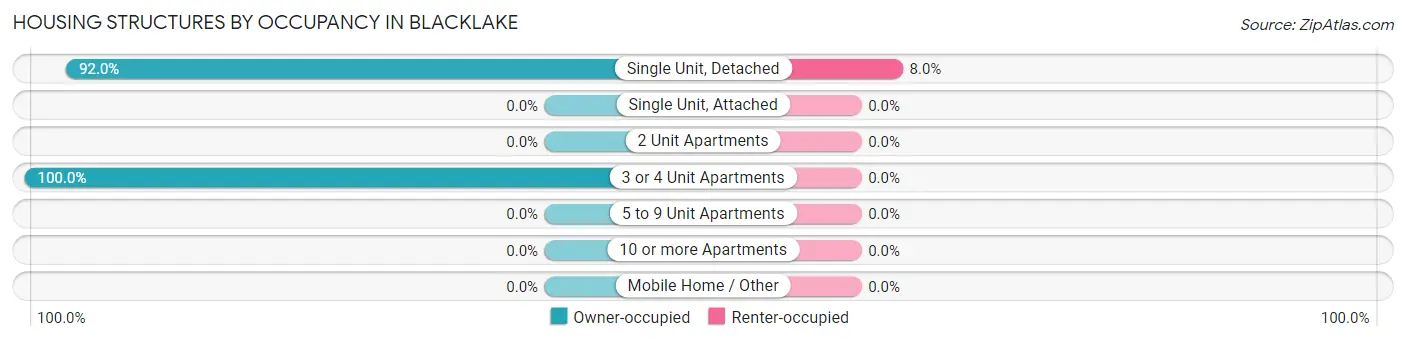
| Structure Type | Owner-occupied | Renter-occupied |
| Single Unit, Detached | 381 (92.0%) | 33 (8.0%) |
| Single Unit, Attached | 0 (0.0%) | 0 (0.0%) |
| 2 Unit Apartments | 0 (0.0%) | 0 (0.0%) |
| 3 or 4 Unit Apartments | 14 (100.0%) | 0 (0.0%) |
| 5 to 9 Unit Apartments | 0 (0.0%) | 0 (0.0%) |
| 10 or more Apartments | 0 (0.0%) | 0 (0.0%) |
| Mobile Home / Other | 0 (0.0%) | 0 (0.0%) |
| Total | 395 (92.3%) | 33 (7.7%) |
Housing Structures by Number of Rooms in Blacklake
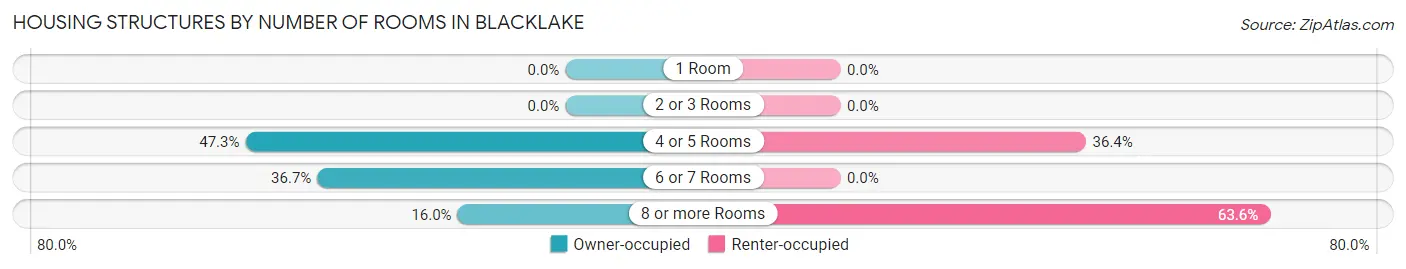
| Number of Rooms | Owner-occupied | Renter-occupied |
| 1 Room | 0 (0.0%) | 0 (0.0%) |
| 2 or 3 Rooms | 0 (0.0%) | 0 (0.0%) |
| 4 or 5 Rooms | 187 (47.3%) | 12 (36.4%) |
| 6 or 7 Rooms | 145 (36.7%) | 0 (0.0%) |
| 8 or more Rooms | 63 (16.0%) | 21 (63.6%) |
| Total | 395 (100.0%) | 33 (100.0%) |
Housing Structure by Heating Type in Blacklake
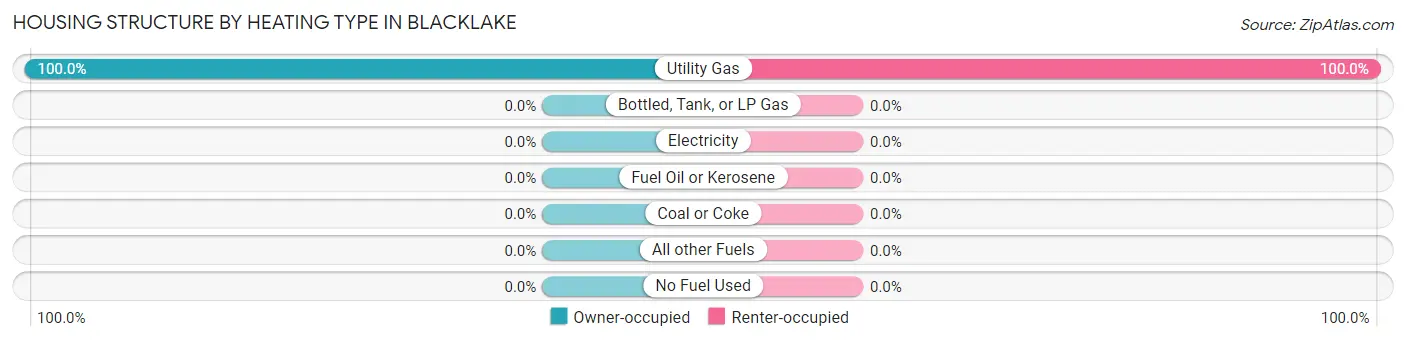
| Heating Type | Owner-occupied | Renter-occupied |
| Utility Gas | 395 (100.0%) | 33 (100.0%) |
| Bottled, Tank, or LP Gas | 0 (0.0%) | 0 (0.0%) |
| Electricity | 0 (0.0%) | 0 (0.0%) |
| Fuel Oil or Kerosene | 0 (0.0%) | 0 (0.0%) |
| Coal or Coke | 0 (0.0%) | 0 (0.0%) |
| All other Fuels | 0 (0.0%) | 0 (0.0%) |
| No Fuel Used | 0 (0.0%) | 0 (0.0%) |
| Total | 395 (100.0%) | 33 (100.0%) |
Household Vehicle Usage in Blacklake
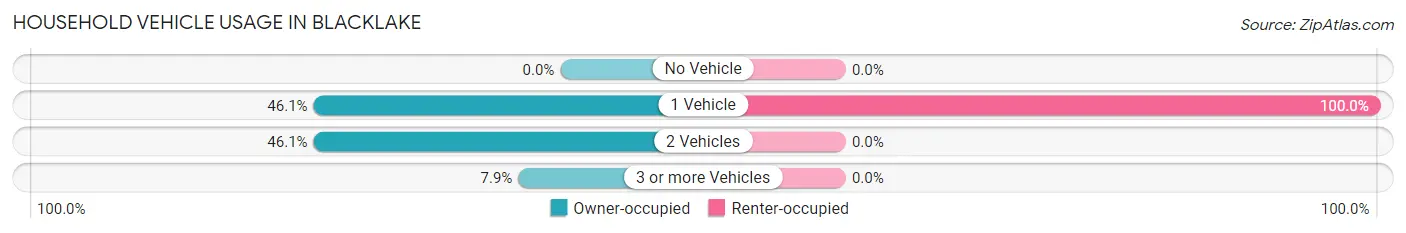
| Vehicles per Household | Owner-occupied | Renter-occupied |
| No Vehicle | 0 (0.0%) | 0 (0.0%) |
| 1 Vehicle | 182 (46.1%) | 33 (100.0%) |
| 2 Vehicles | 182 (46.1%) | 0 (0.0%) |
| 3 or more Vehicles | 31 (7.9%) | 0 (0.0%) |
| Total | 395 (100.0%) | 33 (100.0%) |
Real Estate & Mortgages in Blacklake
Real Estate and Mortgage Overview in Blacklake
| Characteristic | Without Mortgage | With Mortgage |
| Housing Units | 173 | 222 |
| Median Property Value | $732,400 | $820,800 |
| Median Household Income | $53,984 | $126 |
| Monthly Housing Costs | $1,024 | $100 |
| Real Estate Taxes | $5,432 | $0 |
Property Value by Mortgage Status in Blacklake
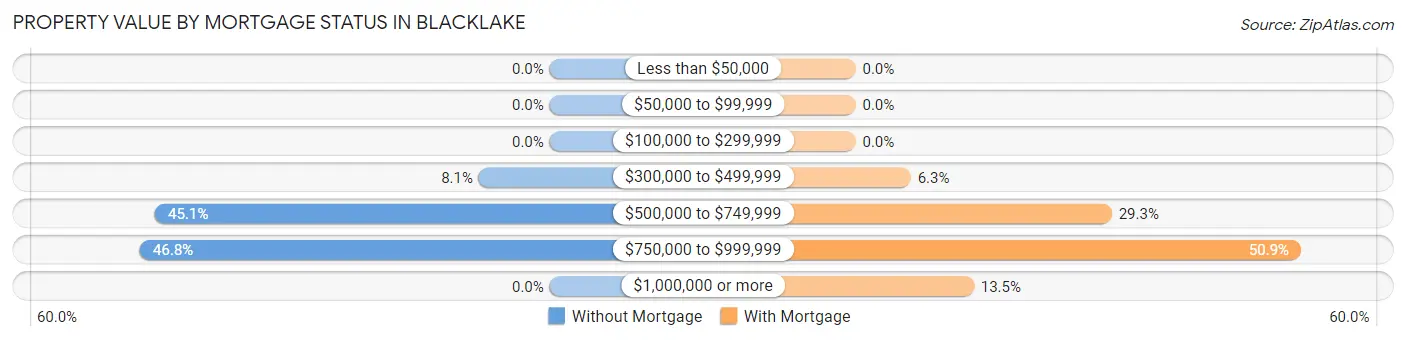
| Property Value | Without Mortgage | With Mortgage |
| Less than $50,000 | 0 (0.0%) | 0 (0.0%) |
| $50,000 to $99,999 | 0 (0.0%) | 0 (0.0%) |
| $100,000 to $299,999 | 0 (0.0%) | 0 (0.0%) |
| $300,000 to $499,999 | 14 (8.1%) | 14 (6.3%) |
| $500,000 to $749,999 | 78 (45.1%) | 65 (29.3%) |
| $750,000 to $999,999 | 81 (46.8%) | 113 (50.9%) |
| $1,000,000 or more | 0 (0.0%) | 30 (13.5%) |
| Total | 173 (100.0%) | 222 (100.0%) |
Household Income by Mortgage Status in Blacklake
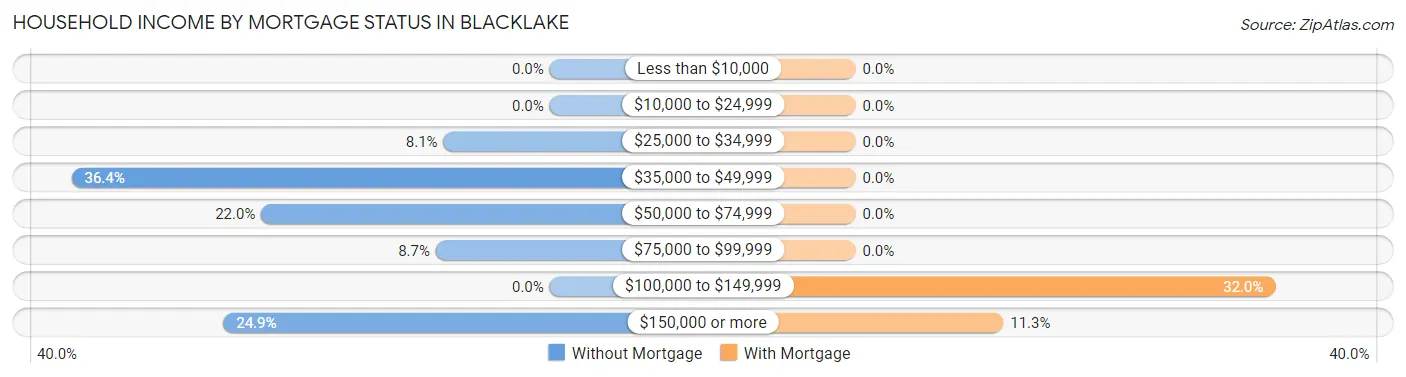
| Household Income | Without Mortgage | With Mortgage |
| Less than $10,000 | 0 (0.0%) | 0 (0.0%) |
| $10,000 to $24,999 | 0 (0.0%) | 0 (0.0%) |
| $25,000 to $34,999 | 14 (8.1%) | 0 (0.0%) |
| $35,000 to $49,999 | 63 (36.4%) | 0 (0.0%) |
| $50,000 to $74,999 | 38 (22.0%) | 0 (0.0%) |
| $75,000 to $99,999 | 15 (8.7%) | 0 (0.0%) |
| $100,000 to $149,999 | 0 (0.0%) | 71 (32.0%) |
| $150,000 or more | 43 (24.9%) | 25 (11.3%) |
| Total | 173 (100.0%) | 222 (100.0%) |
Property Value to Household Income Ratio in Blacklake
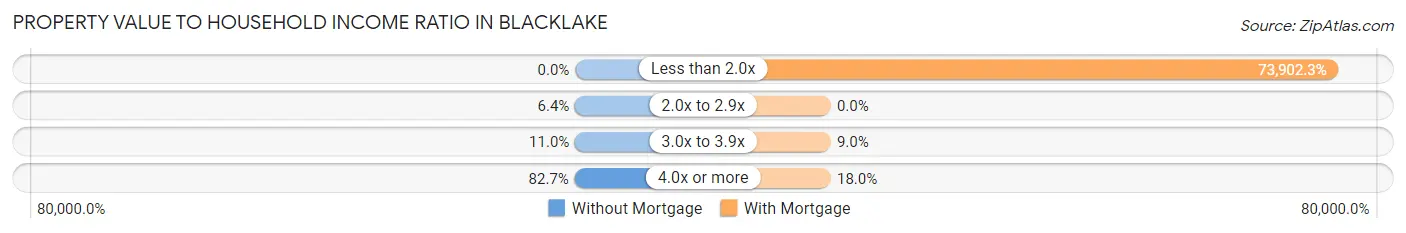
| Value-to-Income Ratio | Without Mortgage | With Mortgage |
| Less than 2.0x | 0 (0.0%) | 164,063 (73,902.3%) |
| 2.0x to 2.9x | 11 (6.4%) | 0 (0.0%) |
| 3.0x to 3.9x | 19 (11.0%) | 20 (9.0%) |
| 4.0x or more | 143 (82.7%) | 40 (18.0%) |
| Total | 173 (100.0%) | 222 (100.0%) |
Real Estate Taxes by Mortgage Status in Blacklake
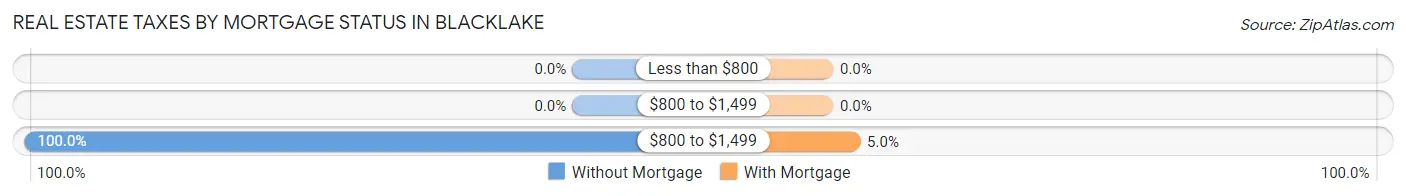
| Property Taxes | Without Mortgage | With Mortgage |
| Less than $800 | 0 (0.0%) | 0 (0.0%) |
| $800 to $1,499 | 0 (0.0%) | 0 (0.0%) |
| $800 to $1,499 | 173 (100.0%) | 11 (5.0%) |
| Total | 173 (100.0%) | 222 (100.0%) |
Health & Disability in Blacklake
Health Insurance Coverage by Age in Blacklake
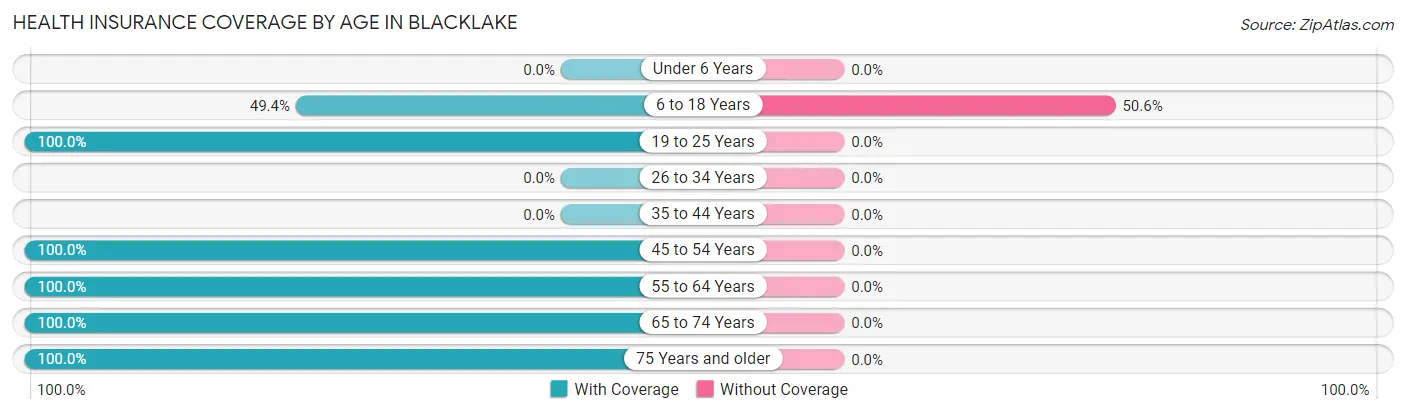
| Age Bracket | With Coverage | Without Coverage |
| Under 6 Years | 0 (0.0%) | 0 (0.0%) |
| 6 to 18 Years | 43 (49.4%) | 44 (50.6%) |
| 19 to 25 Years | 80 (100.0%) | 0 (0.0%) |
| 26 to 34 Years | 0 (0.0%) | 0 (0.0%) |
| 35 to 44 Years | 0 (0.0%) | 0 (0.0%) |
| 45 to 54 Years | 94 (100.0%) | 0 (0.0%) |
| 55 to 64 Years | 157 (100.0%) | 0 (0.0%) |
| 65 to 74 Years | 177 (100.0%) | 0 (0.0%) |
| 75 Years and older | 229 (100.0%) | 0 (0.0%) |
| Total | 780 (94.7%) | 44 (5.3%) |
Health Insurance Coverage by Citizenship Status in Blacklake
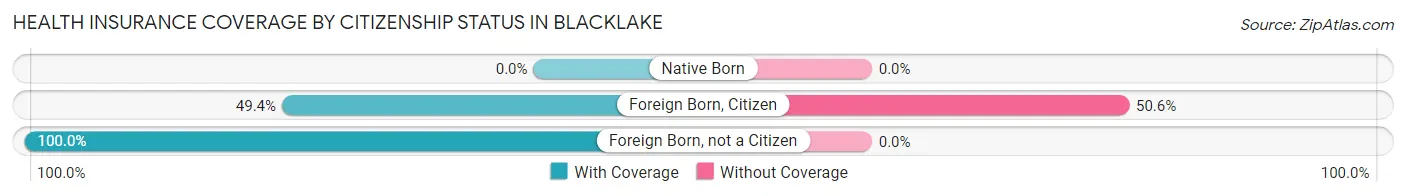
| Citizenship Status | With Coverage | Without Coverage |
| Native Born | 0 (0.0%) | 0 (0.0%) |
| Foreign Born, Citizen | 43 (49.4%) | 44 (50.6%) |
| Foreign Born, not a Citizen | 80 (100.0%) | 0 (0.0%) |
Health Insurance Coverage by Household Income in Blacklake
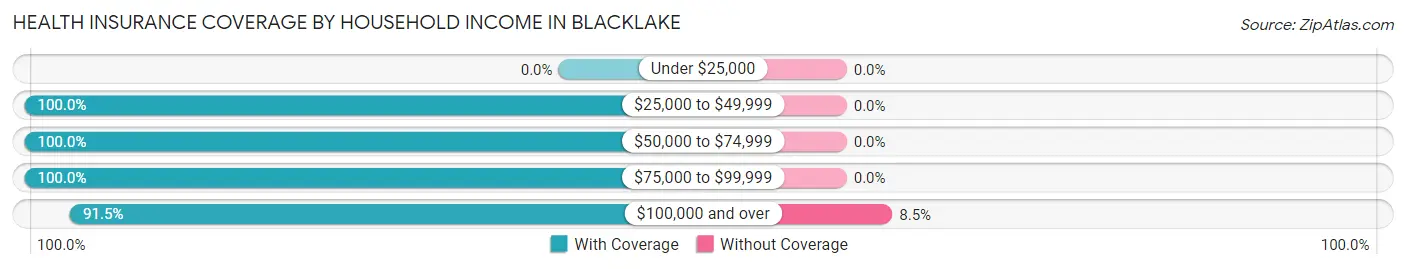
| Household Income | With Coverage | Without Coverage |
| Under $25,000 | 0 (0.0%) | 0 (0.0%) |
| $25,000 to $49,999 | 89 (100.0%) | 0 (0.0%) |
| $50,000 to $74,999 | 53 (100.0%) | 0 (0.0%) |
| $75,000 to $99,999 | 167 (100.0%) | 0 (0.0%) |
| $100,000 and over | 471 (91.5%) | 44 (8.5%) |
Public vs Private Health Insurance Coverage by Age in Blacklake
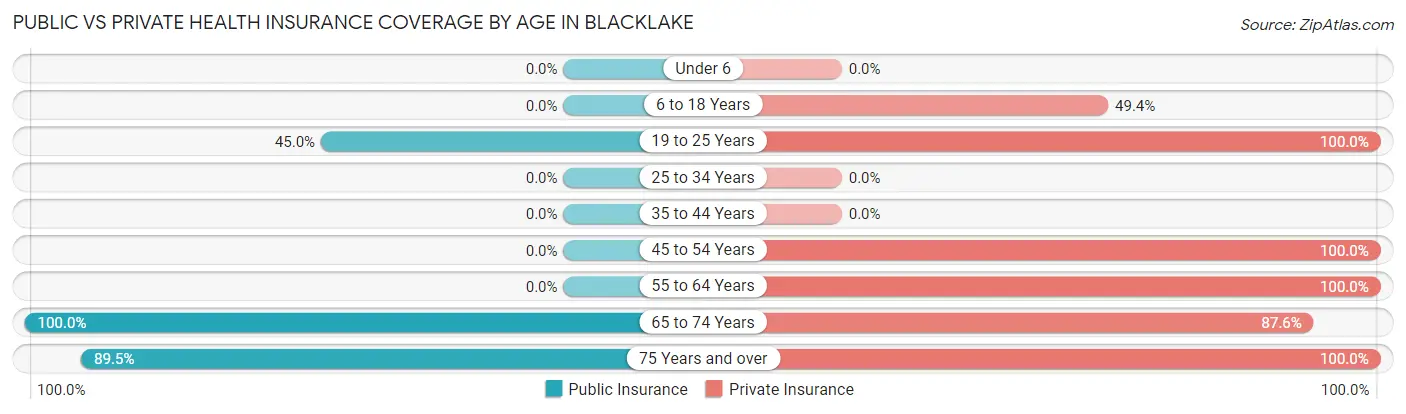
| Age Bracket | Public Insurance | Private Insurance |
| Under 6 | 0 (0.0%) | 0 (0.0%) |
| 6 to 18 Years | 0 (0.0%) | 43 (49.4%) |
| 19 to 25 Years | 36 (45.0%) | 80 (100.0%) |
| 25 to 34 Years | 0 (0.0%) | 0 (0.0%) |
| 35 to 44 Years | 0 (0.0%) | 0 (0.0%) |
| 45 to 54 Years | 0 (0.0%) | 94 (100.0%) |
| 55 to 64 Years | 0 (0.0%) | 157 (100.0%) |
| 65 to 74 Years | 177 (100.0%) | 155 (87.6%) |
| 75 Years and over | 205 (89.5%) | 229 (100.0%) |
| Total | 418 (50.7%) | 758 (92.0%) |
Disability Status by Sex by Age in Blacklake
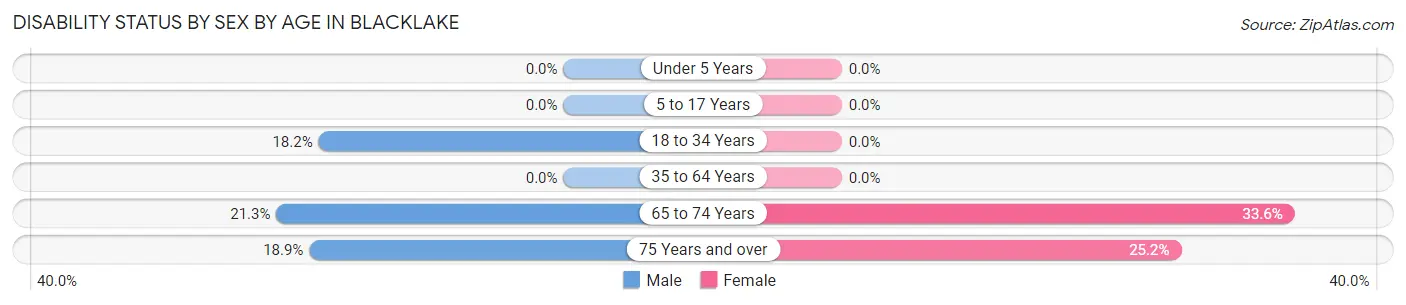
| Age Bracket | Male | Female |
| Under 5 Years | 0 (0.0%) | 0 (0.0%) |
| 5 to 17 Years | 0 (0.0%) | 0 (0.0%) |
| 18 to 34 Years | 8 (18.2%) | 0 (0.0%) |
| 35 to 64 Years | 0 (0.0%) | 0 (0.0%) |
| 65 to 74 Years | 13 (21.3%) | 39 (33.6%) |
| 75 Years and over | 20 (18.9%) | 31 (25.2%) |
Disability Class by Sex by Age in Blacklake
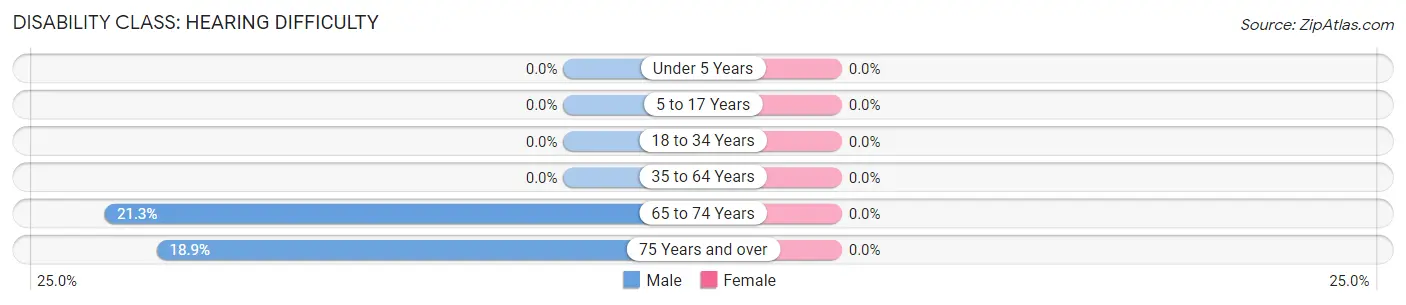
Disability Class: Hearing Difficulty
| Age Bracket | Male | Female |
| Under 5 Years | 0 (0.0%) | 0 (0.0%) |
| 5 to 17 Years | 0 (0.0%) | 0 (0.0%) |
| 18 to 34 Years | 0 (0.0%) | 0 (0.0%) |
| 35 to 64 Years | 0 (0.0%) | 0 (0.0%) |
| 65 to 74 Years | 13 (21.3%) | 0 (0.0%) |
| 75 Years and over | 20 (18.9%) | 0 (0.0%) |
Disability Class: Vision Difficulty
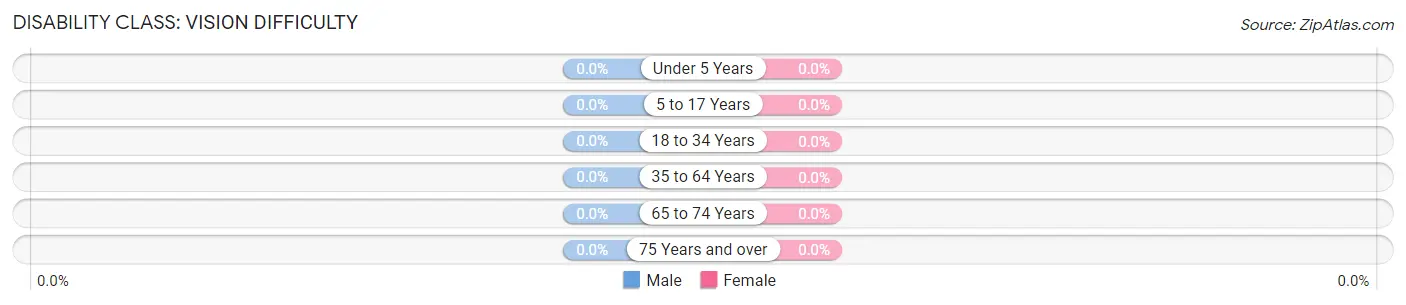
| Age Bracket | Male | Female |
| Under 5 Years | 0 (0.0%) | 0 (0.0%) |
| 5 to 17 Years | 0 (0.0%) | 0 (0.0%) |
| 18 to 34 Years | 0 (0.0%) | 0 (0.0%) |
| 35 to 64 Years | 0 (0.0%) | 0 (0.0%) |
| 65 to 74 Years | 0 (0.0%) | 0 (0.0%) |
| 75 Years and over | 0 (0.0%) | 0 (0.0%) |
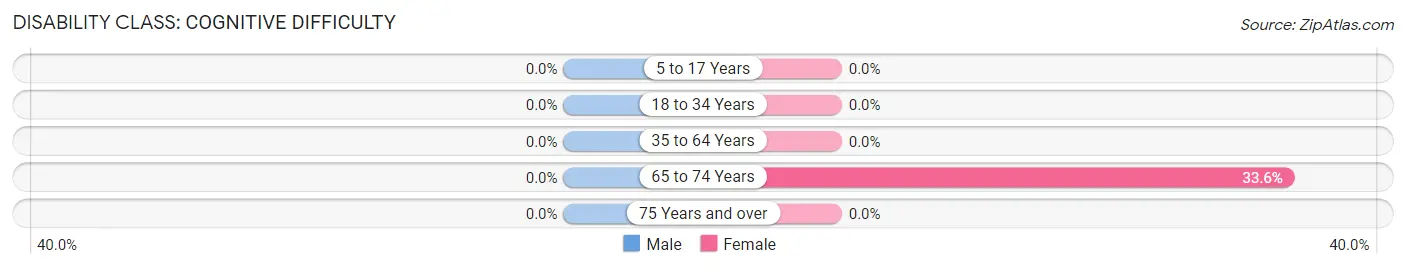
Disability Class: Cognitive Difficulty
| Age Bracket | Male | Female |
| 5 to 17 Years | 0 (0.0%) | 0 (0.0%) |
| 18 to 34 Years | 0 (0.0%) | 0 (0.0%) |
| 35 to 64 Years | 0 (0.0%) | 0 (0.0%) |
| 65 to 74 Years | 0 (0.0%) | 39 (33.6%) |
| 75 Years and over | 0 (0.0%) | 0 (0.0%) |
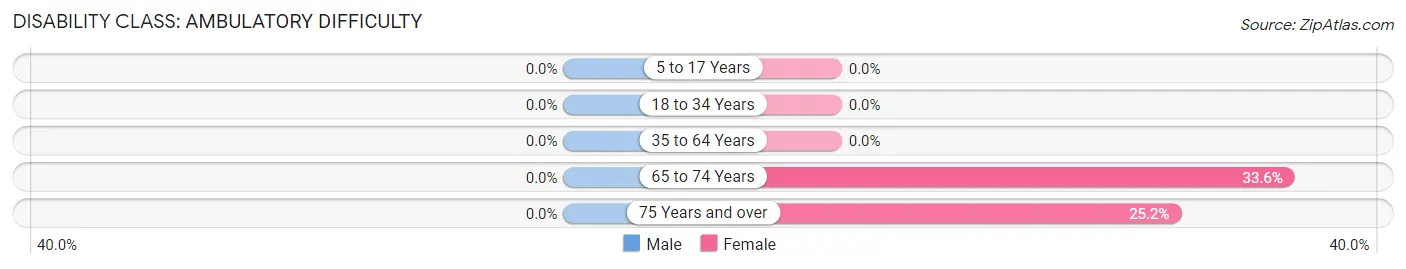
Disability Class: Ambulatory Difficulty
| Age Bracket | Male | Female |
| 5 to 17 Years | 0 (0.0%) | 0 (0.0%) |
| 18 to 34 Years | 0 (0.0%) | 0 (0.0%) |
| 35 to 64 Years | 0 (0.0%) | 0 (0.0%) |
| 65 to 74 Years | 0 (0.0%) | 39 (33.6%) |
| 75 Years and over | 0 (0.0%) | 31 (25.2%) |
Disability Class: Self-Care Difficulty
| Age Bracket | Male | Female |
| 5 to 17 Years | 0 (0.0%) | 0 (0.0%) |
| 18 to 34 Years | 0 (0.0%) | 0 (0.0%) |
| 35 to 64 Years | 0 (0.0%) | 0 (0.0%) |
| 65 to 74 Years | 0 (0.0%) | 0 (0.0%) |
| 75 Years and over | 0 (0.0%) | 0 (0.0%) |
Technology Access in Blacklake
Computing Device Access in Blacklake
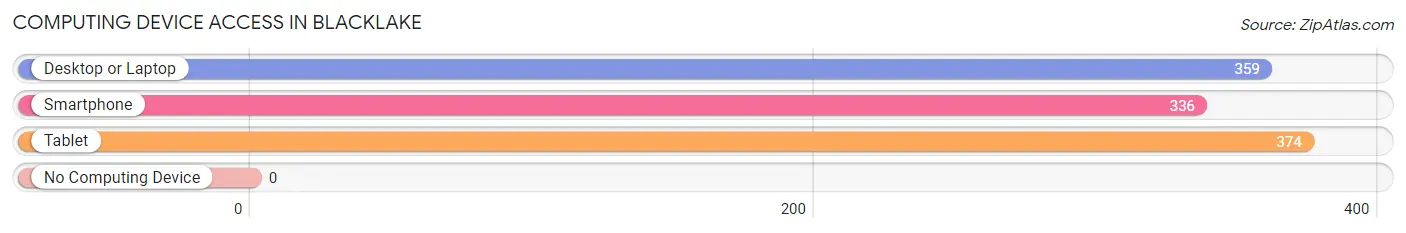
| Device Type | # Households | % Households |
| Desktop or Laptop | 359 | 83.9% |
| Smartphone | 336 | 78.5% |
| Tablet | 374 | 87.4% |
| No Computing Device | 0 | 0.0% |
| Total | 428 | 100.0% |
Internet Access in Blacklake
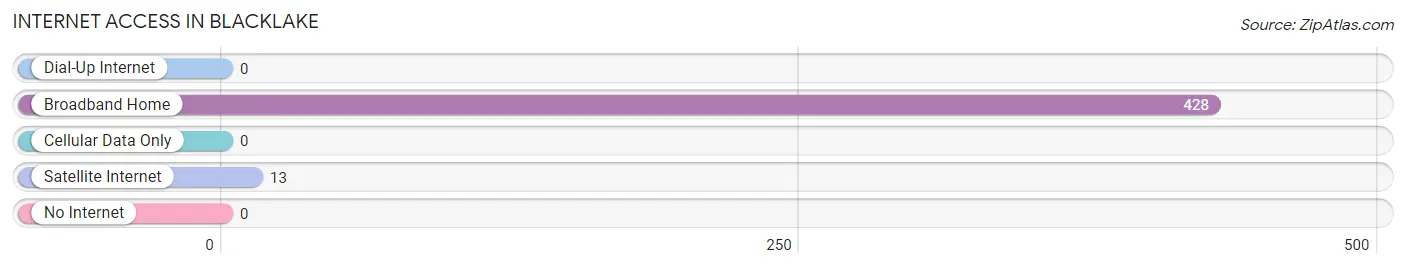
| Internet Type | # Households | % Households |
| Dial-Up Internet | 0 | 0.0% |
| Broadband Home | 428 | 100.0% |
| Cellular Data Only | 0 | 0.0% |
| Satellite Internet | 13 | 3.0% |
| No Internet | 0 | 0.0% |
| Total | 428 | 100.0% |
Blacklake Summary
Blacklake is a small town located in the northern part of California, in the United States. It is situated in the foothills of the Sierra Nevada Mountains, and is surrounded by the beautiful landscape of the Sierra National Forest. The town is home to a population of just over 1,000 people, and is known for its rural charm and small-town atmosphere.
History
Blacklake was founded in the late 1800s by a group of settlers who were looking for a place to settle and start a new life. The town was originally called “Black Lake”, after the nearby lake of the same name. The name was later changed to “Blacklake”, and the town was officially incorporated in 1891.
The town was originally a logging and mining town, and the local economy was largely based on these industries. The town was also home to a number of small businesses, such as a general store, a blacksmith, and a saloon.
In the early 1900s, the town began to experience a period of growth and prosperity. The local economy was bolstered by the construction of a railroad line, which connected Blacklake to the nearby towns of Fresno and Bakersfield. This allowed the town to become a hub for the surrounding area, and it soon became a popular destination for tourists and travelers.
Geography
Blacklake is located in the northern part of California, in the foothills of the Sierra Nevada Mountains. The town is situated at an elevation of 2,400 feet, and is surrounded by the beautiful landscape of the Sierra National Forest. The town is located approximately 30 miles east of Fresno, and is situated along the banks of the Kings River.
The climate in Blacklake is generally mild, with temperatures ranging from the mid-50s in the winter to the mid-80s in the summer. The town receives an average of 20 inches of rain per year, and is known for its sunny days and cool nights.
Economy
The economy of Blacklake is largely based on tourism and agriculture. The town is home to a number of small businesses, such as restaurants, shops, and lodging. The town is also home to a number of wineries, which produce a variety of wines.
Agriculture is also an important part of the local economy. The town is home to a number of farms, which produce a variety of fruits and vegetables. The town is also home to a number of cattle ranches, which produce beef and dairy products.
Demographics
As of the 2010 census, the population of Blacklake was 1,072. The town is predominantly white, with a population that is 94.3% white, 1.2% Hispanic, 0.7% African American, 0.5% Asian, and 0.3% Native American. The median household income in Blacklake is $45,000, and the median home value is $175,000.
Conclusion
Blacklake is a small town located in the northern part of California, in the United States. It is situated in the foothills of the Sierra Nevada Mountains, and is surrounded by the beautiful landscape of the Sierra National Forest. The town is home to a population of just over 1,000 people, and is known for its rural charm and small-town atmosphere. The local economy is largely based on tourism and agriculture, and the town is home to a number of small businesses, wineries, and farms. The population of Blacklake is predominantly white, and the median household income is $45,000.
Common Questions
What is Per Capita Income in Blacklake?
Per Capita income in Blacklake is $68,731.
What is the Median Family Income in Blacklake?
Median Family Income in Blacklake is $163,854.
What is the Median Household income in Blacklake?
Median Household Income in Blacklake is $125,100.
What is Income or Wage Gap in Blacklake?
Income or Wage Gap in Blacklake is 65.5%.
Women in Blacklake earn 34.5 cents for every dollar earned by a man.
What is Inequality or Gini Index in Blacklake?
Inequality or Gini Index in Blacklake is 0.32.
What is the Total Population of Blacklake?
Total Population of Blacklake is 824.
What is the Total Male Population of Blacklake?
Total Male Population of Blacklake is 440.
What is the Total Female Population of Blacklake?
Total Female Population of Blacklake is 384.
What is the Ratio of Males per 100 Females in Blacklake?
There are 114.58 Males per 100 Females in Blacklake.
What is the Ratio of Females per 100 Males in Blacklake?
There are 87.27 Females per 100 Males in Blacklake.
What is the Median Population Age in Blacklake?
Median Population Age in Blacklake is 64.7 Years.
What is the Average Family Size in Blacklake
Average Family Size in Blacklake is 2.5 People.
What is the Average Household Size in Blacklake
Average Household Size in Blacklake is 1.9 People.
How Large is the Labor Force in Blacklake?
There are 282 People in the Labor Forcein in Blacklake.
What is the Percentage of People in the Labor Force in Blacklake?
38.3% of People are in the Labor Force in Blacklake.