Cities with the Most Immigrants from Kuwait in California
RELATED REPORTS & OPTIONS
Kuwait
California
Compare Cities
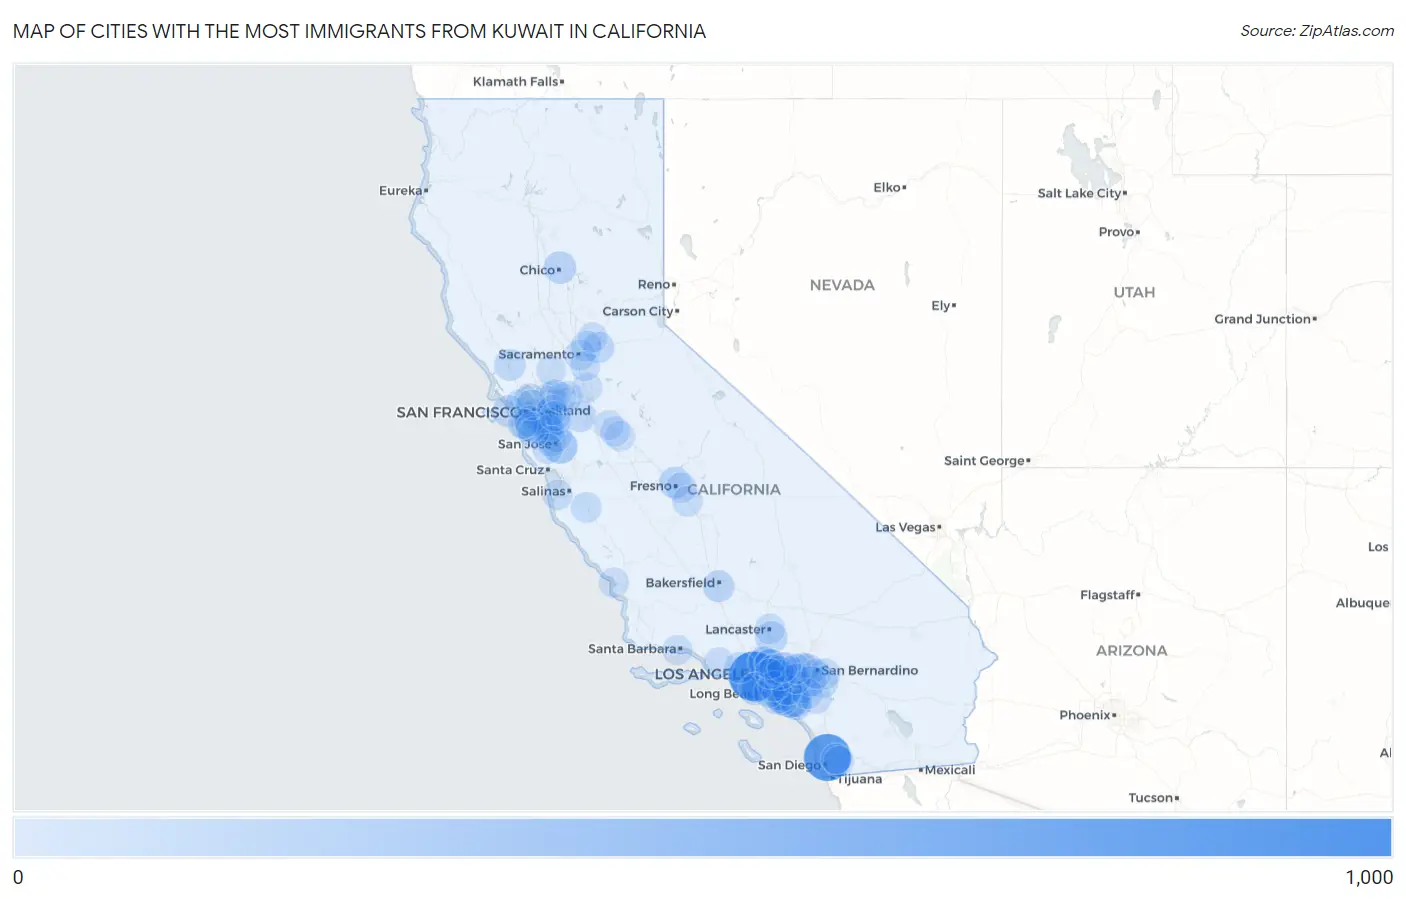
Map of Cities with the Most Immigrants from Kuwait in California
0
1,000
Cities with the Most Immigrants from Kuwait in California
| City | Kuwait | vs State | vs National | |
| 1. | Los Angeles | 831 | 6,353(13.08%)#1 | 35,679(2.33%)#3 |
| 2. | San Diego | 724 | 6,353(11.40%)#2 | 35,679(2.03%)#4 |
| 3. | Irvine | 333 | 6,353(5.24%)#3 | 35,679(0.93%)#10 |
| 4. | San Jose | 205 | 6,353(3.23%)#4 | 35,679(0.57%)#23 |
| 5. | Whittier | 120 | 6,353(1.89%)#5 | 35,679(0.34%)#45 |
| 6. | Chino Hills | 119 | 6,353(1.87%)#6 | 35,679(0.33%)#48 |
| 7. | Fontana | 115 | 6,353(1.81%)#7 | 35,679(0.32%)#53 |
| 8. | Fullerton | 114 | 6,353(1.79%)#8 | 35,679(0.32%)#54 |
| 9. | Torrance | 110 | 6,353(1.73%)#9 | 35,679(0.31%)#57 |
| 10. | Chico | 109 | 6,353(1.72%)#10 | 35,679(0.31%)#59 |
| 11. | Glendale | 100 | 6,353(1.57%)#11 | 35,679(0.28%)#64 |
| 12. | Pomona | 94 | 6,353(1.48%)#12 | 35,679(0.26%)#69 |
| 13. | Rancho Cucamonga | 91 | 6,353(1.43%)#13 | 35,679(0.26%)#71 |
| 14. | Palmdale | 91 | 6,353(1.43%)#14 | 35,679(0.26%)#72 |
| 15. | Castro Valley | 89 | 6,353(1.40%)#15 | 35,679(0.25%)#73 |
| 16. | San Francisco | 86 | 6,353(1.35%)#16 | 35,679(0.24%)#76 |
| 17. | Fresno | 80 | 6,353(1.26%)#17 | 35,679(0.22%)#81 |
| 18. | Bakersfield | 78 | 6,353(1.23%)#18 | 35,679(0.22%)#88 |
| 19. | Santa Rosa | 72 | 6,353(1.13%)#19 | 35,679(0.20%)#95 |
| 20. | Tracy | 71 | 6,353(1.12%)#20 | 35,679(0.20%)#98 |
| 21. | Pasadena | 68 | 6,353(1.07%)#21 | 35,679(0.19%)#104 |
| 22. | Santa Ana | 66 | 6,353(1.04%)#22 | 35,679(0.18%)#108 |
| 23. | Lake Forest | 65 | 6,353(1.02%)#23 | 35,679(0.18%)#112 |
| 24. | Folsom | 64 | 6,353(1.01%)#24 | 35,679(0.18%)#113 |
| 25. | Concord | 62 | 6,353(0.98%)#25 | 35,679(0.17%)#118 |
| 26. | Corona | 61 | 6,353(0.96%)#26 | 35,679(0.17%)#119 |
| 27. | Calabasas | 58 | 6,353(0.91%)#27 | 35,679(0.16%)#127 |
| 28. | Anaheim | 57 | 6,353(0.90%)#28 | 35,679(0.16%)#129 |
| 29. | Oakland | 53 | 6,353(0.83%)#29 | 35,679(0.15%)#140 |
| 30. | Moreno Valley | 53 | 6,353(0.83%)#30 | 35,679(0.15%)#141 |
| 31. | Hayward | 52 | 6,353(0.82%)#31 | 35,679(0.15%)#145 |
| 32. | Milpitas | 52 | 6,353(0.82%)#32 | 35,679(0.15%)#146 |
| 33. | Millbrae | 50 | 6,353(0.79%)#33 | 35,679(0.14%)#157 |
| 34. | Union City | 49 | 6,353(0.77%)#34 | 35,679(0.14%)#160 |
| 35. | Pleasanton | 47 | 6,353(0.74%)#35 | 35,679(0.13%)#170 |
| 36. | Richmond | 45 | 6,353(0.71%)#36 | 35,679(0.13%)#180 |
| 37. | Foster City | 45 | 6,353(0.71%)#37 | 35,679(0.13%)#184 |
| 38. | Redlands | 44 | 6,353(0.69%)#38 | 35,679(0.12%)#188 |
| 39. | Marin City | 44 | 6,353(0.69%)#39 | 35,679(0.12%)#189 |
| 40. | Pittsburg | 43 | 6,353(0.68%)#40 | 35,679(0.12%)#192 |
| 41. | South San Francisco | 41 | 6,353(0.65%)#41 | 35,679(0.11%)#201 |
| 42. | Fremont | 40 | 6,353(0.63%)#42 | 35,679(0.11%)#205 |
| 43. | Huntington Beach | 40 | 6,353(0.63%)#43 | 35,679(0.11%)#206 |
| 44. | Sacramento | 39 | 6,353(0.61%)#44 | 35,679(0.11%)#209 |
| 45. | Foothill Farms | 38 | 6,353(0.60%)#45 | 35,679(0.11%)#216 |
| 46. | Soledad | 35 | 6,353(0.55%)#46 | 35,679(0.10%)#236 |
| 47. | Westminster | 33 | 6,353(0.52%)#47 | 35,679(0.09%)#249 |
| 48. | Mission Viejo | 32 | 6,353(0.50%)#48 | 35,679(0.09%)#256 |
| 49. | Rancho San Diego | 32 | 6,353(0.50%)#49 | 35,679(0.09%)#258 |
| 50. | Santa Clara | 31 | 6,353(0.49%)#50 | 35,679(0.09%)#261 |
| 51. | Lake Elsinore | 27 | 6,353(0.42%)#51 | 35,679(0.08%)#283 |
| 52. | Rowland Heights | 27 | 6,353(0.42%)#52 | 35,679(0.08%)#286 |
| 53. | Oakley | 27 | 6,353(0.42%)#53 | 35,679(0.08%)#287 |
| 54. | Lancaster | 26 | 6,353(0.41%)#54 | 35,679(0.07%)#291 |
| 55. | Saratoga | 26 | 6,353(0.41%)#55 | 35,679(0.07%)#293 |
| 56. | La Habra | 25 | 6,353(0.39%)#56 | 35,679(0.07%)#304 |
| 57. | Fountain Valley | 25 | 6,353(0.39%)#57 | 35,679(0.07%)#305 |
| 58. | Glendora | 25 | 6,353(0.39%)#58 | 35,679(0.07%)#306 |
| 59. | Costa Mesa | 24 | 6,353(0.38%)#59 | 35,679(0.07%)#309 |
| 60. | San Mateo | 24 | 6,353(0.38%)#60 | 35,679(0.07%)#310 |
| 61. | La Crescenta Montrose | 24 | 6,353(0.38%)#61 | 35,679(0.07%)#314 |
| 62. | Sunnyside | 24 | 6,353(0.38%)#62 | 35,679(0.07%)#317 |
| 63. | Monterey | 23 | 6,353(0.36%)#63 | 35,679(0.06%)#325 |
| 64. | Kingsburg | 23 | 6,353(0.36%)#64 | 35,679(0.06%)#326 |
| 65. | Riverside | 21 | 6,353(0.33%)#65 | 35,679(0.06%)#336 |
| 66. | West Covina | 21 | 6,353(0.33%)#66 | 35,679(0.06%)#338 |
| 67. | San Carlos | 21 | 6,353(0.33%)#67 | 35,679(0.06%)#342 |
| 68. | Long Beach | 20 | 6,353(0.31%)#68 | 35,679(0.06%)#349 |
| 69. | Camarillo | 20 | 6,353(0.31%)#69 | 35,679(0.06%)#354 |
| 70. | Albany | 20 | 6,353(0.31%)#70 | 35,679(0.06%)#357 |
| 71. | Delhi | 20 | 6,353(0.31%)#71 | 35,679(0.06%)#360 |
| 72. | El Cajon | 19 | 6,353(0.30%)#72 | 35,679(0.05%)#365 |
| 73. | Danville | 19 | 6,353(0.30%)#73 | 35,679(0.05%)#370 |
| 74. | Pacifica | 19 | 6,353(0.30%)#74 | 35,679(0.05%)#371 |
| 75. | Lodi | 17 | 6,353(0.27%)#75 | 35,679(0.05%)#397 |
| 76. | Temple City | 17 | 6,353(0.27%)#76 | 35,679(0.05%)#399 |
| 77. | California Polytechnic State University | 17 | 6,353(0.27%)#77 | 35,679(0.05%)#402 |
| 78. | Orange | 16 | 6,353(0.25%)#78 | 35,679(0.04%)#406 |
| 79. | Redondo Beach | 16 | 6,353(0.25%)#79 | 35,679(0.04%)#408 |
| 80. | Arcadia | 16 | 6,353(0.25%)#80 | 35,679(0.04%)#409 |
| 81. | Santa Barbara | 15 | 6,353(0.24%)#81 | 35,679(0.04%)#420 |
| 82. | Dublin | 15 | 6,353(0.24%)#82 | 35,679(0.04%)#421 |
| 83. | Temescal Valley | 15 | 6,353(0.24%)#83 | 35,679(0.04%)#427 |
| 84. | Vacaville | 14 | 6,353(0.22%)#84 | 35,679(0.04%)#442 |
| 85. | Baldwin Park | 14 | 6,353(0.22%)#85 | 35,679(0.04%)#443 |
| 86. | La Puente | 14 | 6,353(0.22%)#86 | 35,679(0.04%)#446 |
| 87. | Eastern Goleta Valley | 14 | 6,353(0.22%)#87 | 35,679(0.04%)#447 |
| 88. | Elk Grove | 13 | 6,353(0.20%)#88 | 35,679(0.04%)#456 |
| 89. | Chino | 13 | 6,353(0.20%)#89 | 35,679(0.04%)#459 |
| 90. | Cerritos | 13 | 6,353(0.20%)#90 | 35,679(0.04%)#464 |
| 91. | Upland | 12 | 6,353(0.19%)#91 | 35,679(0.03%)#489 |
| 92. | Rocklin | 12 | 6,353(0.19%)#92 | 35,679(0.03%)#490 |
| 93. | Ceres | 12 | 6,353(0.19%)#93 | 35,679(0.03%)#494 |
| 94. | Altadena | 12 | 6,353(0.19%)#94 | 35,679(0.03%)#496 |
| 95. | Morro Bay | 12 | 6,353(0.19%)#95 | 35,679(0.03%)#499 |
| 96. | Antioch | 11 | 6,353(0.17%)#96 | 35,679(0.03%)#505 |
| 97. | Turlock | 11 | 6,353(0.17%)#97 | 35,679(0.03%)#508 |
| 98. | Monterey Park | 11 | 6,353(0.17%)#98 | 35,679(0.03%)#509 |
| 99. | Colton | 11 | 6,353(0.17%)#99 | 35,679(0.03%)#511 |
| 100. | Azusa | 11 | 6,353(0.17%)#100 | 35,679(0.03%)#513 |
Common Questions
What are the Top 10 Cities with the Most Immigrants from Kuwait in California?
Top 10 Cities with the Most Immigrants from Kuwait in California are:
#1
831
#2
724
#3
333
#4
205
#5
120
#6
119
#7
115
#8
114
#9
110
#10
109
What city has the Most Immigrants from Kuwait in California?
Los Angeles has the Most Immigrants from Kuwait in California with 831.
What is the Total Immigrants from Kuwait in the State of California?
Total Immigrants from Kuwait in California is 6,353.
What is the Total Immigrants from Kuwait in the United States?
Total Immigrants from Kuwait in the United States is 35,679.