Cities with the Most Immigrants from Morocco in California
RELATED REPORTS & OPTIONS
Morocco
California
Compare Cities
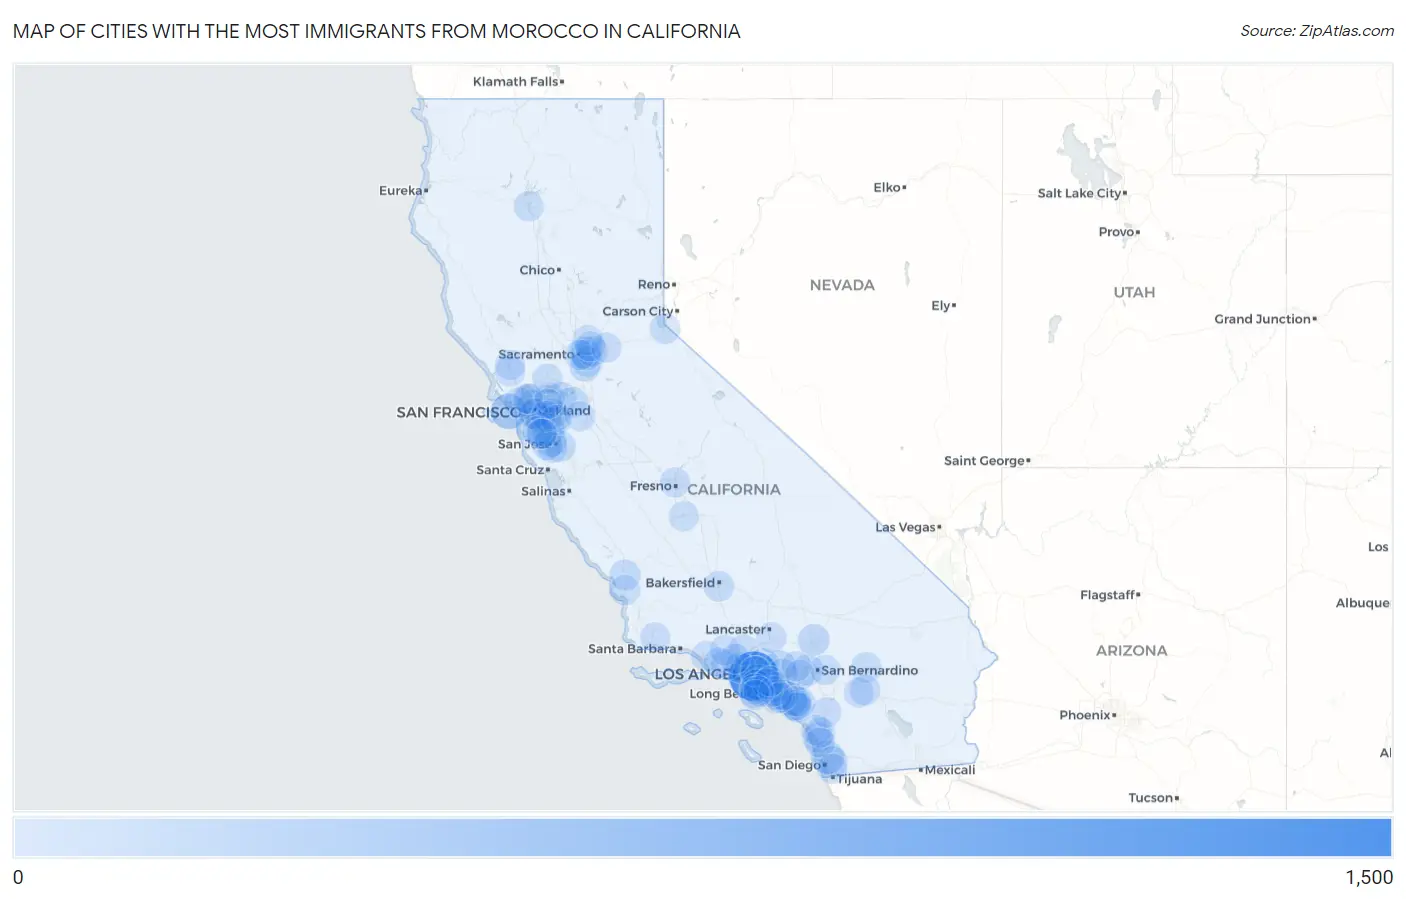
Map of Cities with the Most Immigrants from Morocco in California
0
1,500
Cities with the Most Immigrants from Morocco in California
| City | Morocco | vs State | vs National | |
| 1. | Los Angeles | 1,389 | 6,612(21.01%)#1 | 88,055(1.58%)#4 |
| 2. | San Francisco | 384 | 6,612(5.81%)#2 | 88,055(0.44%)#27 |
| 3. | San Diego | 234 | 6,612(3.54%)#3 | 88,055(0.27%)#53 |
| 4. | Irvine | 230 | 6,612(3.48%)#4 | 88,055(0.26%)#54 |
| 5. | Fremont | 145 | 6,612(2.19%)#5 | 88,055(0.16%)#94 |
| 6. | Duarte | 125 | 6,612(1.89%)#6 | 88,055(0.14%)#115 |
| 7. | Oakland | 113 | 6,612(1.71%)#7 | 88,055(0.13%)#126 |
| 8. | Victorville | 112 | 6,612(1.69%)#8 | 88,055(0.13%)#127 |
| 9. | San Jose | 93 | 6,612(1.41%)#9 | 88,055(0.11%)#161 |
| 10. | Santa Clara | 88 | 6,612(1.33%)#10 | 88,055(0.10%)#167 |
| 11. | Fontana | 84 | 6,612(1.27%)#11 | 88,055(0.10%)#175 |
| 12. | Arden Arcade | 82 | 6,612(1.24%)#12 | 88,055(0.09%)#182 |
| 13. | Signal Hill | 78 | 6,612(1.18%)#13 | 88,055(0.09%)#190 |
| 14. | Inglewood | 76 | 6,612(1.15%)#14 | 88,055(0.09%)#199 |
| 15. | San Mateo | 73 | 6,612(1.10%)#15 | 88,055(0.08%)#208 |
| 16. | Glendale | 65 | 6,612(0.98%)#16 | 88,055(0.07%)#233 |
| 17. | Antioch | 65 | 6,612(0.98%)#17 | 88,055(0.07%)#234 |
| 18. | Hawthorne | 65 | 6,612(0.98%)#18 | 88,055(0.07%)#235 |
| 19. | Atascadero | 65 | 6,612(0.98%)#19 | 88,055(0.07%)#237 |
| 20. | Vineyard | 62 | 6,612(0.94%)#20 | 88,055(0.07%)#247 |
| 21. | Laguna Hills | 62 | 6,612(0.94%)#21 | 88,055(0.07%)#248 |
| 22. | Dublin | 61 | 6,612(0.92%)#22 | 88,055(0.07%)#255 |
| 23. | El Sobrante Cdp Contra Costa County | 60 | 6,612(0.91%)#23 | 88,055(0.07%)#261 |
| 24. | Elk Grove | 55 | 6,612(0.83%)#24 | 88,055(0.06%)#279 |
| 25. | Buena Park | 54 | 6,612(0.82%)#25 | 88,055(0.06%)#285 |
| 26. | Campbell | 52 | 6,612(0.79%)#26 | 88,055(0.06%)#298 |
| 27. | Bakersfield | 51 | 6,612(0.77%)#27 | 88,055(0.06%)#305 |
| 28. | Yucca Valley | 51 | 6,612(0.77%)#28 | 88,055(0.06%)#309 |
| 29. | Rancho Santa Margarita | 47 | 6,612(0.71%)#29 | 88,055(0.05%)#330 |
| 30. | Gold River | 47 | 6,612(0.71%)#30 | 88,055(0.05%)#332 |
| 31. | Berkeley | 46 | 6,612(0.70%)#31 | 88,055(0.05%)#335 |
| 32. | Richmond | 45 | 6,612(0.68%)#32 | 88,055(0.05%)#347 |
| 33. | Stevenson Ranch | 45 | 6,612(0.68%)#33 | 88,055(0.05%)#354 |
| 34. | Cathedral City | 44 | 6,612(0.67%)#34 | 88,055(0.05%)#358 |
| 35. | West Covina | 43 | 6,612(0.65%)#35 | 88,055(0.05%)#362 |
| 36. | Mission Viejo | 43 | 6,612(0.65%)#36 | 88,055(0.05%)#363 |
| 37. | Thousand Oaks | 42 | 6,612(0.64%)#37 | 88,055(0.05%)#369 |
| 38. | La Canada Flintridge | 42 | 6,612(0.64%)#38 | 88,055(0.05%)#372 |
| 39. | La Riviera | 42 | 6,612(0.64%)#39 | 88,055(0.05%)#374 |
| 40. | West Hollywood | 39 | 6,612(0.59%)#40 | 88,055(0.04%)#392 |
| 41. | Carlsbad | 38 | 6,612(0.57%)#41 | 88,055(0.04%)#398 |
| 42. | San Ramon | 36 | 6,612(0.54%)#42 | 88,055(0.04%)#411 |
| 43. | Cupertino | 36 | 6,612(0.54%)#43 | 88,055(0.04%)#413 |
| 44. | South Lake Tahoe | 36 | 6,612(0.54%)#44 | 88,055(0.04%)#421 |
| 45. | Discovery Bay | 36 | 6,612(0.54%)#45 | 88,055(0.04%)#422 |
| 46. | San Leandro | 35 | 6,612(0.53%)#46 | 88,055(0.04%)#426 |
| 47. | Calabasas | 35 | 6,612(0.53%)#47 | 88,055(0.04%)#431 |
| 48. | Lawndale | 34 | 6,612(0.51%)#48 | 88,055(0.04%)#440 |
| 49. | San Buenaventura Ventura | 33 | 6,612(0.50%)#49 | 88,055(0.04%)#446 |
| 50. | Oceanside | 32 | 6,612(0.48%)#50 | 88,055(0.04%)#456 |
| 51. | Alameda | 32 | 6,612(0.48%)#51 | 88,055(0.04%)#459 |
| 52. | Huntington Beach | 30 | 6,612(0.45%)#52 | 88,055(0.03%)#476 |
| 53. | Santa Ana | 29 | 6,612(0.44%)#53 | 88,055(0.03%)#490 |
| 54. | Concord | 29 | 6,612(0.44%)#54 | 88,055(0.03%)#492 |
| 55. | Castro Valley | 29 | 6,612(0.44%)#55 | 88,055(0.03%)#494 |
| 56. | San Luis Obispo | 29 | 6,612(0.44%)#56 | 88,055(0.03%)#497 |
| 57. | Beverly Hills | 29 | 6,612(0.44%)#57 | 88,055(0.03%)#499 |
| 58. | Westminster | 28 | 6,612(0.42%)#58 | 88,055(0.03%)#513 |
| 59. | Fillmore | 28 | 6,612(0.42%)#59 | 88,055(0.03%)#517 |
| 60. | Roseville | 27 | 6,612(0.41%)#60 | 88,055(0.03%)#522 |
| 61. | Palos Verdes Estates | 27 | 6,612(0.41%)#61 | 88,055(0.03%)#536 |
| 62. | Pleasanton | 26 | 6,612(0.39%)#62 | 88,055(0.03%)#542 |
| 63. | Fairfield | 25 | 6,612(0.38%)#63 | 88,055(0.03%)#558 |
| 64. | Redding | 25 | 6,612(0.38%)#64 | 88,055(0.03%)#559 |
| 65. | La Mesa | 25 | 6,612(0.38%)#65 | 88,055(0.03%)#563 |
| 66. | Camarillo | 24 | 6,612(0.36%)#66 | 88,055(0.03%)#577 |
| 67. | Paramount | 24 | 6,612(0.36%)#67 | 88,055(0.03%)#580 |
| 68. | East Palo Alto | 24 | 6,612(0.36%)#68 | 88,055(0.03%)#584 |
| 69. | Sacramento | 23 | 6,612(0.35%)#69 | 88,055(0.03%)#591 |
| 70. | Simi Valley | 23 | 6,612(0.35%)#70 | 88,055(0.03%)#594 |
| 71. | Ontario | 22 | 6,612(0.33%)#71 | 88,055(0.02%)#614 |
| 72. | Torrance | 22 | 6,612(0.33%)#72 | 88,055(0.02%)#615 |
| 73. | Tracy | 22 | 6,612(0.33%)#73 | 88,055(0.02%)#617 |
| 74. | Redwood City | 22 | 6,612(0.33%)#74 | 88,055(0.02%)#618 |
| 75. | Ladera Ranch | 22 | 6,612(0.33%)#75 | 88,055(0.02%)#623 |
| 76. | Rohnert Park | 21 | 6,612(0.32%)#76 | 88,055(0.02%)#643 |
| 77. | Los Alamitos | 21 | 6,612(0.32%)#77 | 88,055(0.02%)#650 |
| 78. | Fountain Valley | 20 | 6,612(0.30%)#78 | 88,055(0.02%)#658 |
| 79. | Vista | 19 | 6,612(0.29%)#79 | 88,055(0.02%)#680 |
| 80. | Highland | 19 | 6,612(0.29%)#80 | 88,055(0.02%)#685 |
| 81. | Palmdale | 18 | 6,612(0.27%)#81 | 88,055(0.02%)#697 |
| 82. | Walnut Creek | 18 | 6,612(0.27%)#82 | 88,055(0.02%)#698 |
| 83. | Encinitas | 18 | 6,612(0.27%)#83 | 88,055(0.02%)#699 |
| 84. | Fresno | 17 | 6,612(0.26%)#84 | 88,055(0.02%)#721 |
| 85. | Santa Rosa | 17 | 6,612(0.26%)#85 | 88,055(0.02%)#723 |
| 86. | Citrus Heights | 17 | 6,612(0.26%)#86 | 88,055(0.02%)#727 |
| 87. | Lake Forest | 17 | 6,612(0.26%)#87 | 88,055(0.02%)#728 |
| 88. | Palm Springs | 17 | 6,612(0.26%)#88 | 88,055(0.02%)#730 |
| 89. | Cameron Park | 17 | 6,612(0.26%)#89 | 88,055(0.02%)#733 |
| 90. | San Antonio Heights | 17 | 6,612(0.26%)#90 | 88,055(0.02%)#744 |
| 91. | Downey | 16 | 6,612(0.24%)#91 | 88,055(0.02%)#746 |
| 92. | Temecula | 16 | 6,612(0.24%)#92 | 88,055(0.02%)#747 |
| 93. | Menlo Park | 16 | 6,612(0.24%)#93 | 88,055(0.02%)#755 |
| 94. | Lomita | 16 | 6,612(0.24%)#94 | 88,055(0.02%)#756 |
| 95. | Mill Valley | 15 | 6,612(0.23%)#95 | 88,055(0.02%)#785 |
| 96. | Solvang | 15 | 6,612(0.23%)#96 | 88,055(0.02%)#793 |
| 97. | North Richmond | 15 | 6,612(0.23%)#97 | 88,055(0.02%)#796 |
| 98. | Hanford | 14 | 6,612(0.21%)#98 | 88,055(0.02%)#803 |
| 99. | Bonita | 14 | 6,612(0.21%)#99 | 88,055(0.02%)#813 |
| 100. | Rancho Palos Verdes | 13 | 6,612(0.20%)#100 | 88,055(0.01%)#825 |
Common Questions
What are the Top 10 Cities with the Most Immigrants from Morocco in California?
Top 10 Cities with the Most Immigrants from Morocco in California are:
#1
1,389
#2
384
#3
234
#4
230
#5
145
#6
125
#7
113
#8
112
#9
93
#10
88
What city has the Most Immigrants from Morocco in California?
Los Angeles has the Most Immigrants from Morocco in California with 1,389.
What is the Total Immigrants from Morocco in the State of California?
Total Immigrants from Morocco in California is 6,612.
What is the Total Immigrants from Morocco in the United States?
Total Immigrants from Morocco in the United States is 88,055.