New Jersey Map & Demographics
New Jersey Map
New Jersey Overview
Dec 18, 1787
INCORPORATED
8,723
TOTAL AREA [ SQ MI ]
7,354
LAND AREA [ SQ MI ]
1,369
WATER AREA [ SQ MI ]
250
ELEVATION AVG [ FT ]
1,803
ELEVATION HIGH [ FT ]
Sea Level
ELEVATION LOW [ FT ]
1,257.7
POP DENSITY [ PPL / SQ MI ]
$50,995
PER CAPITA INCOME
$119,240
AVG FAMILY INCOME
$97,126
AVG HOUSEHOLD INCOME
29.5%
WAGE / INCOME GAP [ % ]
70.5¢/ $1
WAGE / INCOME GAP [ $ ]
$10,841
FAMILY INCOME DEFICIT
0.48
INEQUALITY / GINI INDEX
08701
LARGEST ZIP CODE
Newark
LARGEST CITY
Bergen County
LARGEST COUNTY
9,249,063
TOTAL POPULATION
4,556,331
MALE POPULATION
4,692,732
FEMALE POPULATION
97.09
MALES / 100 FEMALES
102.99
FEMALES / 100 MALES
40.0
MEDIAN AGE
3.2
AVG FAMILY SIZE
2.6
AVG HOUSEHOLD SIZE
4,939,850
LABOR FORCE [ PEOPLE ]
66.1%
PERCENT IN LABOR FORCE
6.2%
UNEMPLOYMENT RATE
Income in New Jersey
Income Overview in New Jersey
Per Capita Income in New Jersey is $50,995, while median incomes of families and households are $119,240 and $97,126 respectively.
| Characteristic | Number | Measure |
| Per Capita Income | 9,249,063 | $50,995 |
| Median Family Income | 2,340,500 | $119,240 |
| Mean Family Income | 2,340,500 | $158,765 |
| Median Household Income | 3,438,162 | $97,126 |
| Mean Household Income | 3,438,162 | $135,170 |
| Income Deficit | 2,340,500 | $10,841 |
| Wage / Income Gap (%) | 9,249,063 | 29.46% |
| Wage / Income Gap ($) | 9,249,063 | 70.54¢ per $1 |
| Gini / Inequality Index | 9,249,063 | 0.48 |
Earnings by Sex in New Jersey
Average Earnings in New Jersey are $51,515, $60,103 for men and $42,399 for women, a difference of 29.5%.
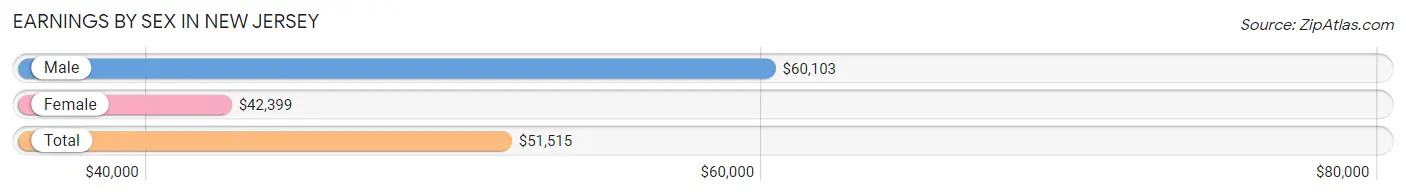
| Sex | Number | Average Earnings |
| Male | 2,673,466 (52.6%) | $60,103 |
| Female | 2,405,568 (47.4%) | $42,399 |
| Total | 5,079,034 (100.0%) | $51,515 |
Earnings by Sex by Income Bracket in New Jersey
The most common earnings brackets in New Jersey are $100,000+ for men (783,106 | 29.3%) and $100,000+ for women (393,979 | 16.4%).
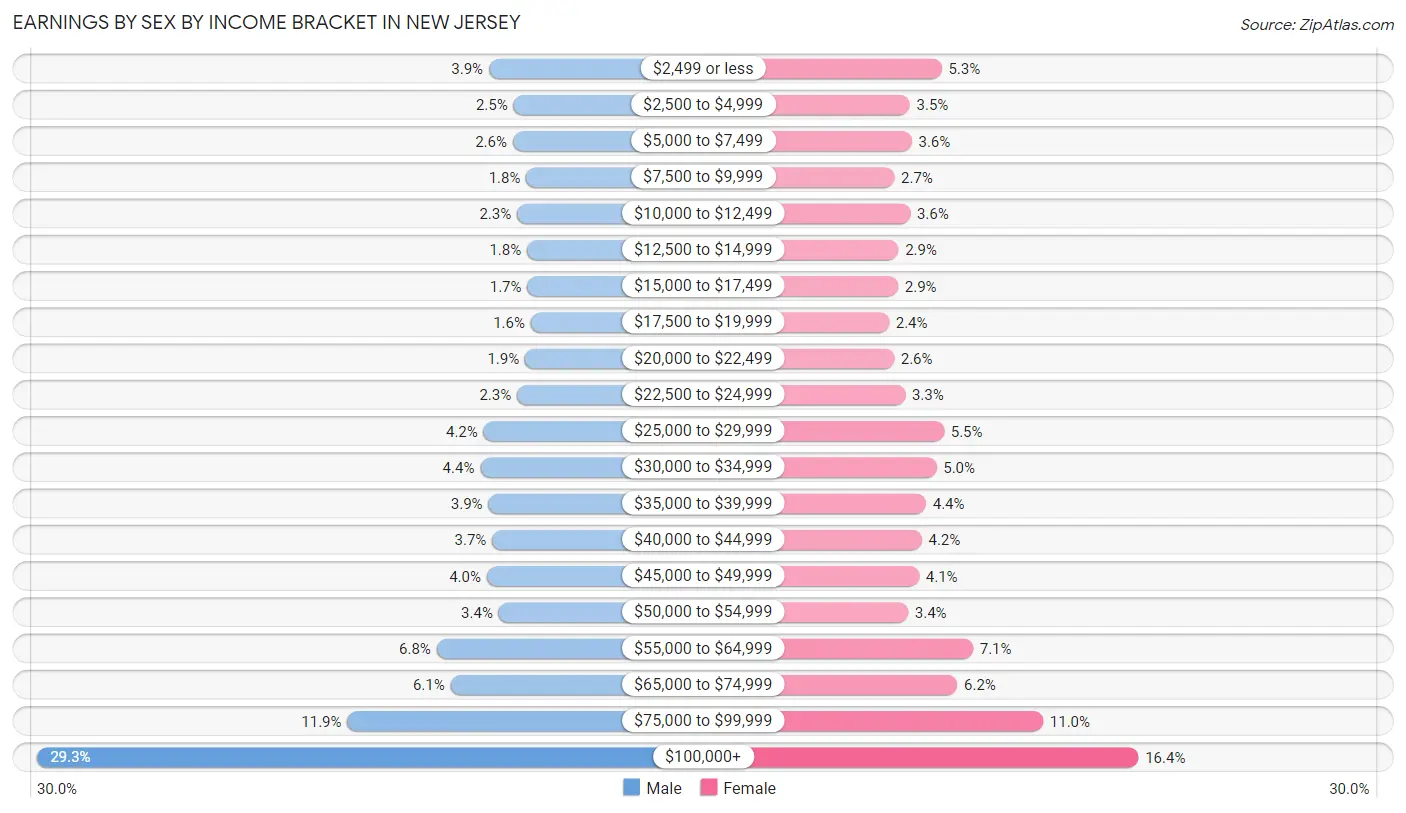
| Income | Male | Female |
| $2,499 or less | 104,135 (3.9%) | 127,922 (5.3%) |
| $2,500 to $4,999 | 67,370 (2.5%) | 84,910 (3.5%) |
| $5,000 to $7,499 | 68,335 (2.6%) | 87,537 (3.6%) |
| $7,500 to $9,999 | 48,233 (1.8%) | 63,991 (2.7%) |
| $10,000 to $12,499 | 62,086 (2.3%) | 85,374 (3.5%) |
| $12,500 to $14,999 | 47,119 (1.8%) | 69,469 (2.9%) |
| $15,000 to $17,499 | 46,645 (1.7%) | 69,072 (2.9%) |
| $17,500 to $19,999 | 41,356 (1.5%) | 56,755 (2.4%) |
| $20,000 to $22,499 | 49,942 (1.9%) | 63,398 (2.6%) |
| $22,500 to $24,999 | 61,899 (2.3%) | 78,707 (3.3%) |
| $25,000 to $29,999 | 112,287 (4.2%) | 131,016 (5.4%) |
| $30,000 to $34,999 | 117,263 (4.4%) | 121,064 (5.0%) |
| $35,000 to $39,999 | 105,013 (3.9%) | 106,917 (4.4%) |
| $40,000 to $44,999 | 99,545 (3.7%) | 101,106 (4.2%) |
| $45,000 to $49,999 | 107,598 (4.0%) | 97,394 (4.1%) |
| $50,000 to $54,999 | 89,632 (3.4%) | 82,553 (3.4%) |
| $55,000 to $64,999 | 182,744 (6.8%) | 170,266 (7.1%) |
| $65,000 to $74,999 | 162,054 (6.1%) | 149,154 (6.2%) |
| $75,000 to $99,999 | 317,104 (11.9%) | 264,984 (11.0%) |
| $100,000+ | 783,106 (29.3%) | 393,979 (16.4%) |
| Total | 2,673,466 (100.0%) | 2,405,568 (100.0%) |
Earnings by Sex by Educational Attainment in New Jersey
Average earnings in New Jersey are $69,400 for men and $49,869 for women, a difference of 28.1%. Men with an educational attainment of graduate degree enjoy the highest average annual earnings of $126,500, while those with less than high school education earn the least with $36,343. Women with an educational attainment of graduate degree earn the most with the average annual earnings of $84,860, while those with less than high school education have the smallest earnings of $23,529.
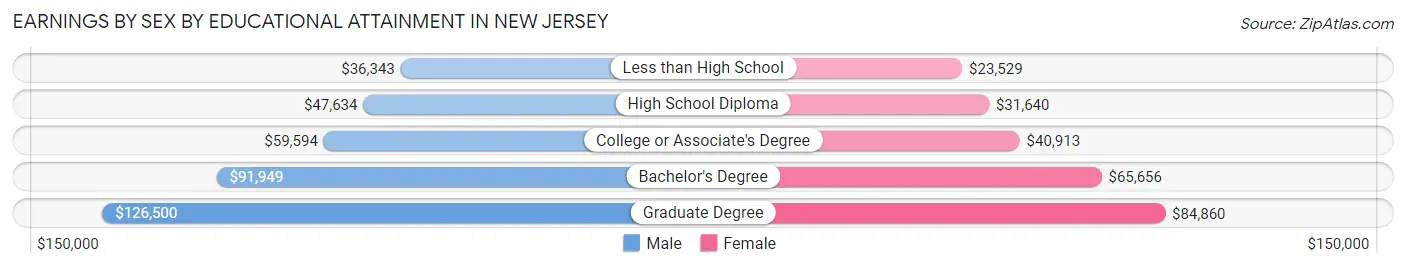
| Educational Attainment | Male Income | Female Income |
| Less than High School | $36,343 | $23,529 |
| High School Diploma | $47,634 | $31,640 |
| College or Associate's Degree | $59,594 | $40,913 |
| Bachelor's Degree | $91,949 | $65,656 |
| Graduate Degree | $126,500 | $84,860 |
| Total | $69,400 | $49,869 |
Family Income in New Jersey
Family Income Brackets in New Jersey
According to the New Jersey family income data, there are 578,104 families falling into the $200,000+ income range, which is the most common income bracket and makes up 24.7% of all families. Conversely, the $10,000 to $14,999 income bracket is the least frequent group with only 32,767 families (1.4%) belonging to this category.
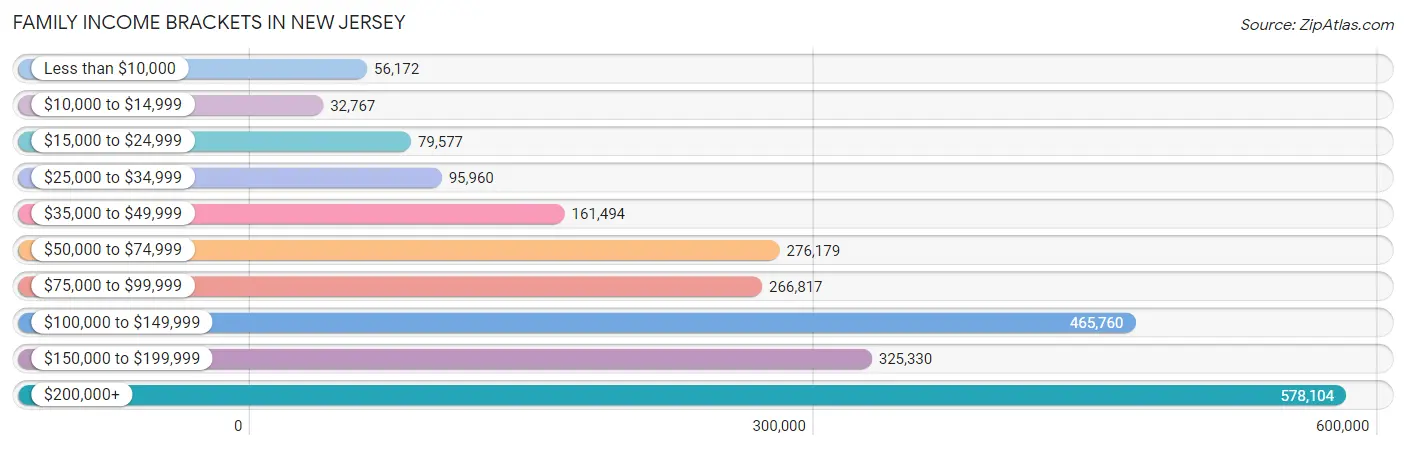
| Income Bracket | # Families | % Families |
| Less than $10,000 | 56,172 | 2.4% |
| $10,000 to $14,999 | 32,767 | 1.4% |
| $15,000 to $24,999 | 79,577 | 3.4% |
| $25,000 to $34,999 | 95,960 | 4.1% |
| $35,000 to $49,999 | 161,494 | 6.9% |
| $50,000 to $74,999 | 276,179 | 11.8% |
| $75,000 to $99,999 | 266,817 | 11.4% |
| $100,000 to $149,999 | 465,760 | 19.9% |
| $150,000 to $199,999 | 325,330 | 13.9% |
| $200,000+ | 578,104 | 24.7% |
Family Income by Famaliy Size in New Jersey
4-person families (500,237 | 21.4%) account for the highest median family income in New Jersey with $153,514 per family, while 2-person families (969,459 | 41.4%) have the highest median income of $49,180 per family member.
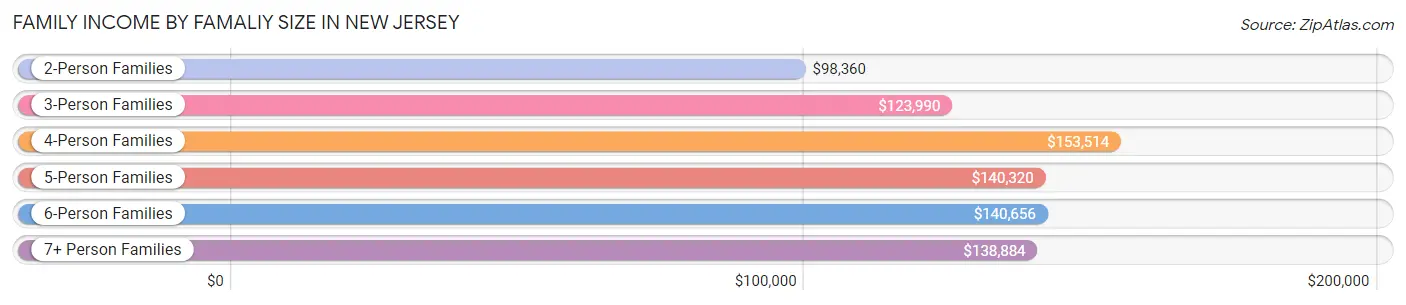
| Income Bracket | # Families | Median Income |
| 2-Person Families | 969,459 (41.4%) | $98,360 |
| 3-Person Families | 563,774 (24.1%) | $123,990 |
| 4-Person Families | 500,237 (21.4%) | $153,514 |
| 5-Person Families | 197,086 (8.4%) | $140,320 |
| 6-Person Families | 68,242 (2.9%) | $140,656 |
| 7+ Person Families | 41,702 (1.8%) | $138,884 |
| Total | 2,340,500 (100.0%) | $119,240 |
Family Income by Number of Earners in New Jersey
The median family income in New Jersey is $119,240, with families comprising 3+ earners (360,488) having the highest median family income of $178,012, while families with no earners (273,881) have the lowest median family income of $56,148, accounting for 15.4% and 11.7% of families, respectively.
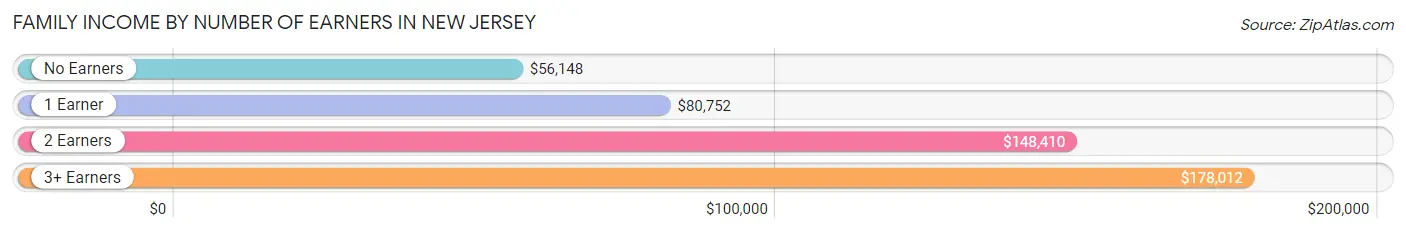
| Number of Earners | # Families | Median Income |
| No Earners | 273,881 (11.7%) | $56,148 |
| 1 Earner | 696,959 (29.8%) | $80,752 |
| 2 Earners | 1,009,172 (43.1%) | $148,410 |
| 3+ Earners | 360,488 (15.4%) | $178,012 |
| Total | 2,340,500 (100.0%) | $119,240 |
Household Income in New Jersey
Household Income Brackets in New Jersey
With 660,127 households falling in the category, the $200,000+ income range is the most frequent in New Jersey, accounting for 19.2% of all households. In contrast, only 103,145 households (3.0%) fall into the $10,000 to $14,999 income bracket, making it the least populous group.
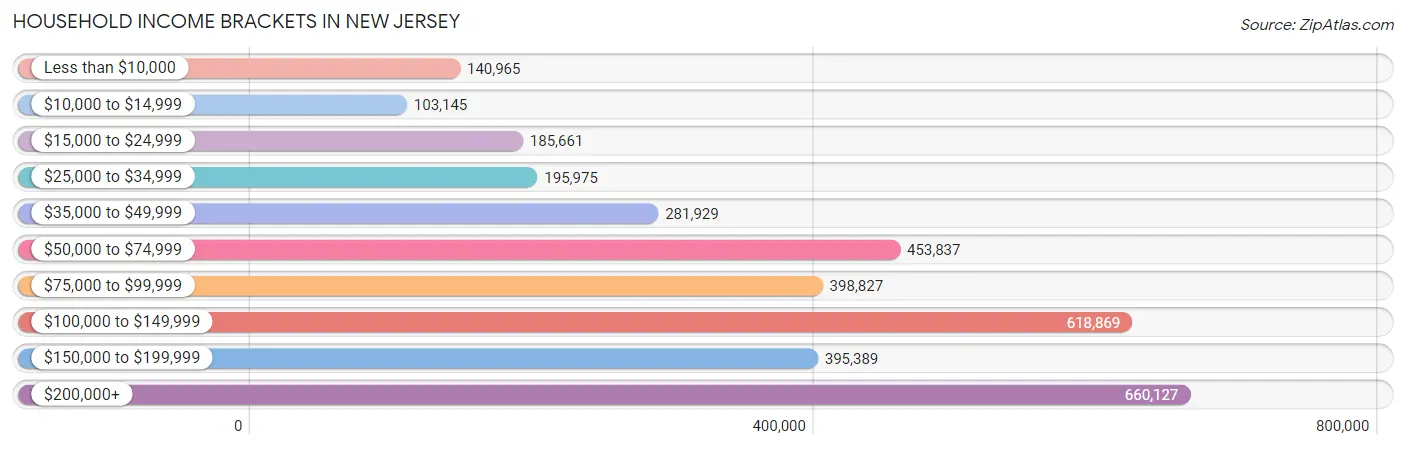
| Income Bracket | # Households | % Households |
| Less than $10,000 | 140,965 | 4.1% |
| $10,000 to $14,999 | 103,145 | 3.0% |
| $15,000 to $24,999 | 185,661 | 5.4% |
| $25,000 to $34,999 | 195,975 | 5.7% |
| $35,000 to $49,999 | 281,929 | 8.2% |
| $50,000 to $74,999 | 453,837 | 13.2% |
| $75,000 to $99,999 | 398,827 | 11.6% |
| $100,000 to $149,999 | 618,869 | 18.0% |
| $150,000 to $199,999 | 395,389 | 11.5% |
| $200,000+ | 660,127 | 19.2% |
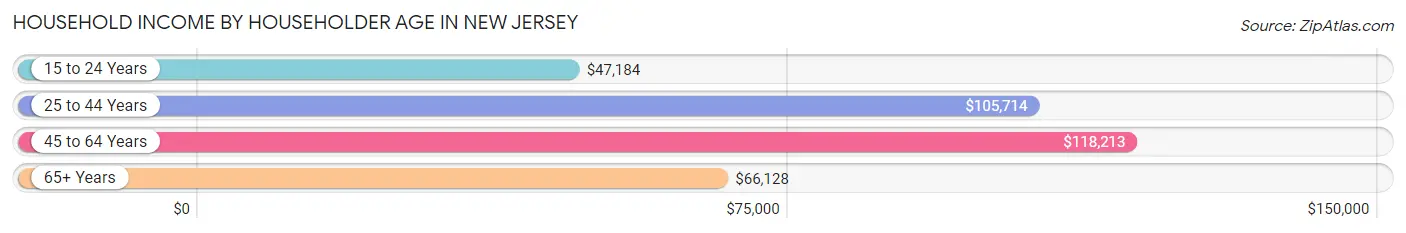
Household Income by Householder Age in New Jersey
The median household income in New Jersey is $97,126, with the highest median household income of $118,213 found in the 45 to 64 years age bracket for the primary householder. A total of 1,392,380 households (40.5%) fall into this category. Meanwhile, the 15 to 24 years age bracket for the primary householder has the lowest median household income of $47,184, with 61,204 households (1.8%) in this group.
| Income Bracket | # Households | Median Income |
| 15 to 24 Years | 61,204 (1.8%) | $47,184 |
| 25 to 44 Years | 1,050,708 (30.6%) | $105,714 |
| 45 to 64 Years | 1,392,380 (40.5%) | $118,213 |
| 65+ Years | 933,870 (27.2%) | $66,128 |
| Total | 3,438,162 (100.0%) | $97,126 |
Poverty in New Jersey
Income Below Poverty by Sex and Age in New Jersey
With 8.6% poverty level for males and 10.7% for females among the residents of New Jersey, 5 year old males and under 5 year old females are the most vulnerable to poverty, with 8,279 males (14.8%) and 35,467 females (14.1%) in their respective age groups living below the poverty level.
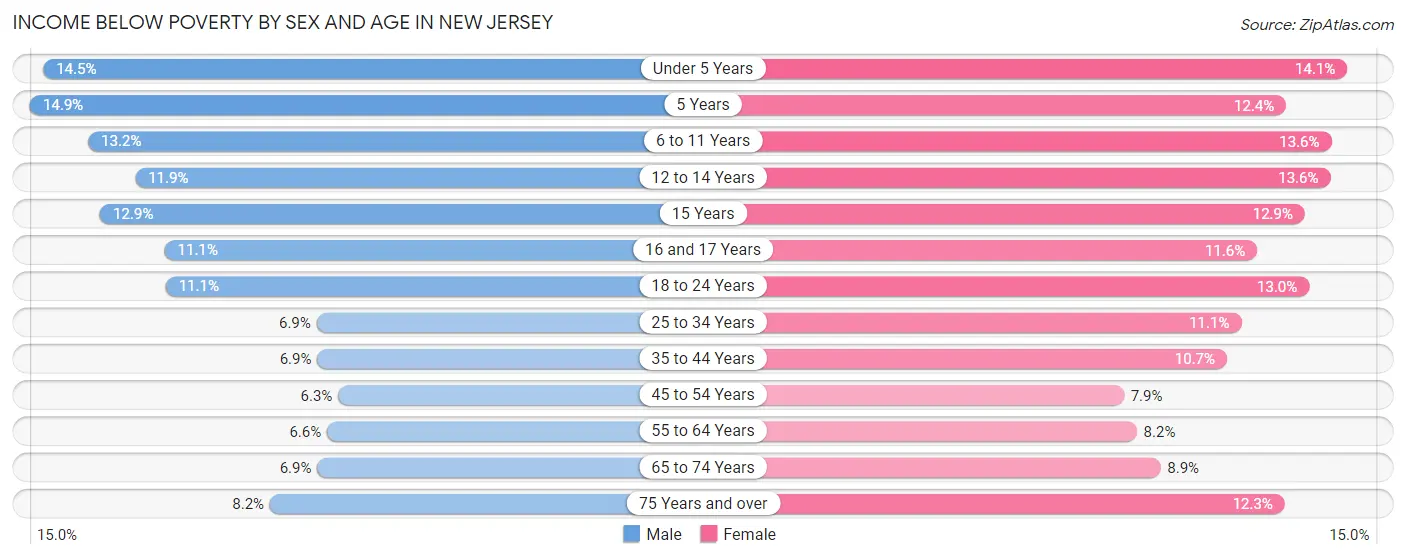
| Age Bracket | Male | Female |
| Under 5 Years | 38,359 (14.5%) | 35,467 (14.1%) |
| 5 Years | 8,279 (14.8%) | 6,202 (12.4%) |
| 6 to 11 Years | 45,108 (13.2%) | 44,128 (13.6%) |
| 12 to 14 Years | 20,912 (11.9%) | 23,482 (13.6%) |
| 15 Years | 7,828 (12.9%) | 7,546 (12.9%) |
| 16 and 17 Years | 13,594 (11.1%) | 13,400 (11.6%) |
| 18 to 24 Years | 41,962 (11.1%) | 47,054 (13.0%) |
| 25 to 34 Years | 40,630 (6.9%) | 64,472 (11.1%) |
| 35 to 44 Years | 40,848 (6.9%) | 64,007 (10.7%) |
| 45 to 54 Years | 38,072 (6.3%) | 48,806 (7.9%) |
| 55 to 64 Years | 40,344 (6.6%) | 52,988 (8.2%) |
| 65 to 74 Years | 27,749 (6.9%) | 41,392 (8.9%) |
| 75 Years and over | 20,392 (8.2%) | 46,158 (12.3%) |
| Total | 384,077 (8.6%) | 495,102 (10.7%) |
Income Above Poverty by Sex and Age in New Jersey
According to the poverty statistics in New Jersey, males aged 45 to 54 years and females aged 45 to 54 years are the age groups that are most secure financially, with 93.7% of males and 92.1% of females in these age groups living above the poverty line.
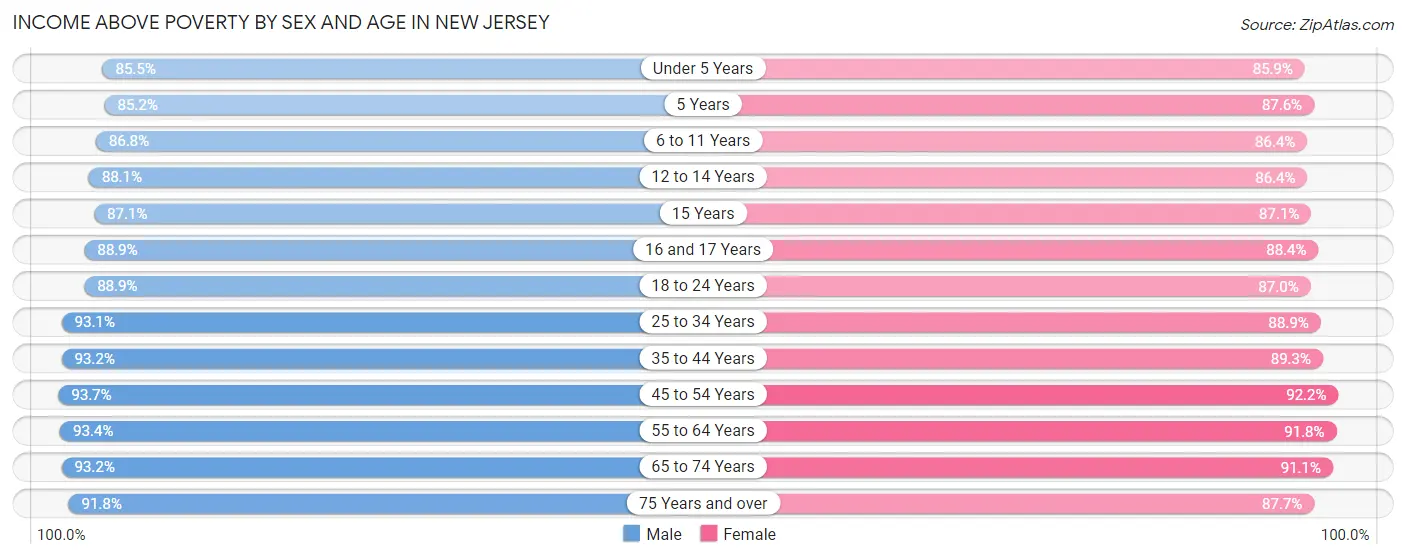
| Age Bracket | Male | Female |
| Under 5 Years | 226,629 (85.5%) | 216,625 (85.9%) |
| 5 Years | 47,464 (85.2%) | 43,917 (87.6%) |
| 6 to 11 Years | 295,774 (86.8%) | 279,531 (86.4%) |
| 12 to 14 Years | 154,567 (88.1%) | 149,142 (86.4%) |
| 15 Years | 52,860 (87.1%) | 50,976 (87.1%) |
| 16 and 17 Years | 108,918 (88.9%) | 102,514 (88.4%) |
| 18 to 24 Years | 337,185 (88.9%) | 314,487 (87.0%) |
| 25 to 34 Years | 550,420 (93.1%) | 515,263 (88.9%) |
| 35 to 44 Years | 555,170 (93.1%) | 532,951 (89.3%) |
| 45 to 54 Years | 569,337 (93.7%) | 573,007 (92.1%) |
| 55 to 64 Years | 572,944 (93.4%) | 592,190 (91.8%) |
| 65 to 74 Years | 377,146 (93.1%) | 425,415 (91.1%) |
| 75 Years and over | 229,313 (91.8%) | 328,188 (87.7%) |
| Total | 4,077,727 (91.4%) | 4,124,206 (89.3%) |
Income Below Poverty Among Married-Couple Families in New Jersey
The poverty statistics for married-couple families in New Jersey show that 3.4% or 59,425 of the total 1,732,602 families live below the poverty line. Families with 5 or more children have the highest poverty rate of 23.5%, comprising of 3,018 families. On the other hand, families with no children have the lowest poverty rate of 2.7%, which includes 26,286 families.
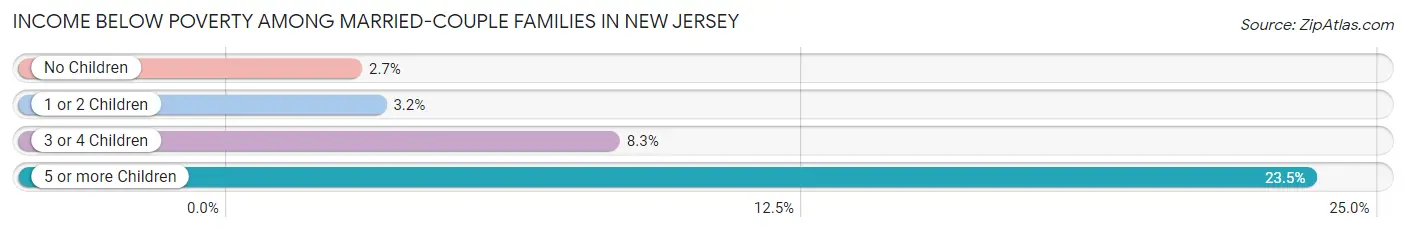
| Children | Above Poverty | Below Poverty |
| No Children | 946,783 (97.3%) | 26,286 (2.7%) |
| 1 or 2 Children | 607,699 (96.8%) | 20,261 (3.2%) |
| 3 or 4 Children | 108,861 (91.7%) | 9,860 (8.3%) |
| 5 or more Children | 9,834 (76.5%) | 3,018 (23.5%) |
| Total | 1,673,177 (96.6%) | 59,425 (3.4%) |
Income Below Poverty Among Single-Parent Households in New Jersey
According to the poverty data in New Jersey, 10.1% or 17,121 single-father households and 19.6% or 85,899 single-mother households are living below the poverty line. Among single-father households, those with 5 or more children have the highest poverty rate, with 260 households (29.0%) experiencing poverty. Likewise, among single-mother households, those with 5 or more children have the highest poverty rate, with 1,876 households (68.4%) falling below the poverty line.
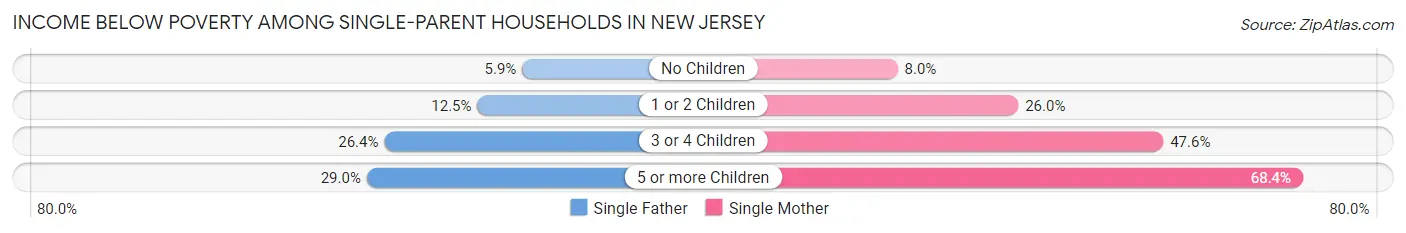
| Children | Single Father | Single Mother |
| No Children | 5,175 (5.9%) | 16,181 (8.0%) |
| 1 or 2 Children | 8,753 (12.5%) | 52,307 (26.0%) |
| 3 or 4 Children | 2,933 (26.4%) | 15,535 (47.6%) |
| 5 or more Children | 260 (29.0%) | 1,876 (68.4%) |
| Total | 17,121 (10.1%) | 85,899 (19.6%) |
Income Below Poverty Among Married-Couple vs Single-Parent Households in New Jersey
The poverty data for New Jersey shows that 59,425 of the married-couple family households (3.4%) and 103,020 of the single-parent households (17.0%) are living below the poverty level. Within the married-couple family households, those with 5 or more children have the highest poverty rate, with 3,018 households (23.5%) falling below the poverty line. Among the single-parent households, those with 5 or more children have the highest poverty rate, with 2,136 household (58.7%) living below poverty.
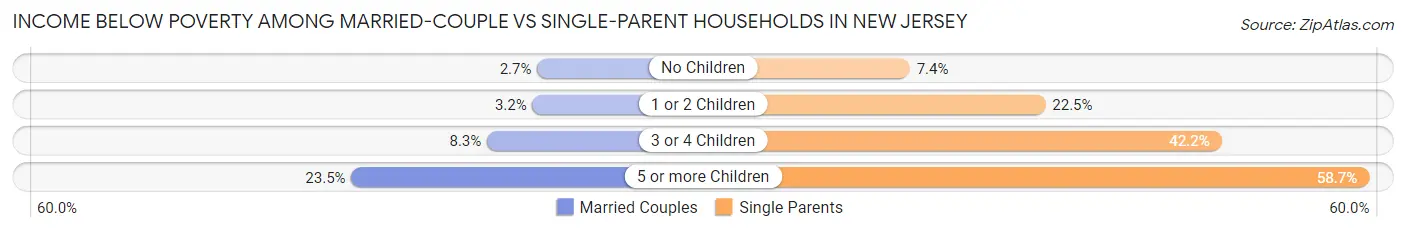
| Children | Married-Couple Families | Single-Parent Households |
| No Children | 26,286 (2.7%) | 21,356 (7.4%) |
| 1 or 2 Children | 20,261 (3.2%) | 61,060 (22.5%) |
| 3 or 4 Children | 9,860 (8.3%) | 18,468 (42.2%) |
| 5 or more Children | 3,018 (23.5%) | 2,136 (58.7%) |
| Total | 59,425 (3.4%) | 103,020 (17.0%) |
Largest Zip Codes by Population in New Jersey
The largest zip codes in New Jersey by population are 08701 (134,008), 07305 (70,738), 07002 (70,497), 07055 (70,048), and 07087 (67,258).
1.08701
134,008 (1.45%)
2.07305
70,738 (0.76%)
3.07002
70,497 (0.76%)
4.07055
70,048 (0.76%)
5.07087
67,258 (0.73%)
6.08753
64,313 (0.70%)
7.07093
64,203 (0.69%)
8.07047
62,066 (0.67%)
9.07111
60,268 (0.65%)
10.08854
60,233 (0.65%)
11.07030
58,754 (0.64%)
12.08861
58,136 (0.63%)
13.08527
57,943 (0.63%)
14.07083
56,900 (0.62%)
15.07728
56,896 (0.62%)
16.08901
56,870 (0.61%)
17.07105
56,696 (0.61%)
18.07104
55,412 (0.60%)
19.08873
55,342 (0.60%)
20.07306
54,779 (0.59%)
21.07470
54,557 (0.59%)
22.08831
54,229 (0.59%)
23.07302
53,237 (0.58%)
24.07003
52,594 (0.57%)
25.07304
50,805 (0.55%)
26.08081
50,604 (0.55%)
27.08816
49,027 (0.53%)
28.08540
48,513 (0.52%)
29.07052
48,399 (0.52%)
30.08817
48,140 (0.52%)
Largest Cities by Population in New Jersey
The largest cities in New Jersey by population are Newark (307,355), Jersey City (287,899), Paterson (157,864), Elizabeth (135,665), and Toms River (92,827).
1.Newark
307,355 (3.32%)
287,899 (3.11%)
3.Paterson
157,864 (1.71%)
135,665 (1.47%)
92,827 (1.00%)
6.Trenton
90,055 (0.97%)
7.Clifton
89,451 (0.97%)
8.Camden
71,799 (0.78%)
9.Bayonne
70,497 (0.76%)
10.Passaic
70,048 (0.76%)
11.East Orange
68,879 (0.74%)
12.Lakewood
68,555 (0.74%)
13.Union City
67,258 (0.73%)
14.Vineland
60,796 (0.66%)
15.Hoboken
58,754 (0.64%)
55,718 (0.60%)
17.Perth Amboy
55,226 (0.60%)
18.Plainfield
54,358 (0.59%)
52,438 (0.57%)
20.Sicklerville
45,853 (0.50%)
21.Hackensack
45,758 (0.49%)
45,136 (0.49%)
23.Linden
43,478 (0.47%)
24.Kearny
41,157 (0.44%)
39,799 (0.43%)
38,487 (0.42%)
34,948 (0.38%)
28.Garfield
32,472 (0.35%)
29.Long Branch
31,932 (0.35%)
30.Westfield
30,839 (0.33%)
Largest Counties by Population in New Jersey
The largest counties in New Jersey by population are Bergen County (953,243), Middlesex County (860,147), Essex County (853,374), Hudson County (712,029), and Monmouth County (643,064).
953,243 (10.31%)
860,147 (9.30%)
853,374 (9.23%)
712,029 (7.70%)
643,064 (6.95%)
638,691 (6.91%)
572,079 (6.19%)
522,581 (5.65%)
519,986 (5.62%)
508,816 (5.50%)
461,853 (4.99%)
383,732 (4.15%)
344,978 (3.73%)
302,621 (3.27%)
274,339 (2.97%)
153,588 (1.66%)
144,808 (1.57%)
129,099 (1.40%)
109,739 (1.19%)
95,456 (1.03%)
21.Salem County
64,840 (0.70%)
Race in New Jersey
The most populous races in New Jersey are White / Caucasian (5,528,604 | 59.8%), Hispanic or Latino (1,963,423 | 21.2%), and Black / African American (1,213,265 | 13.1%).
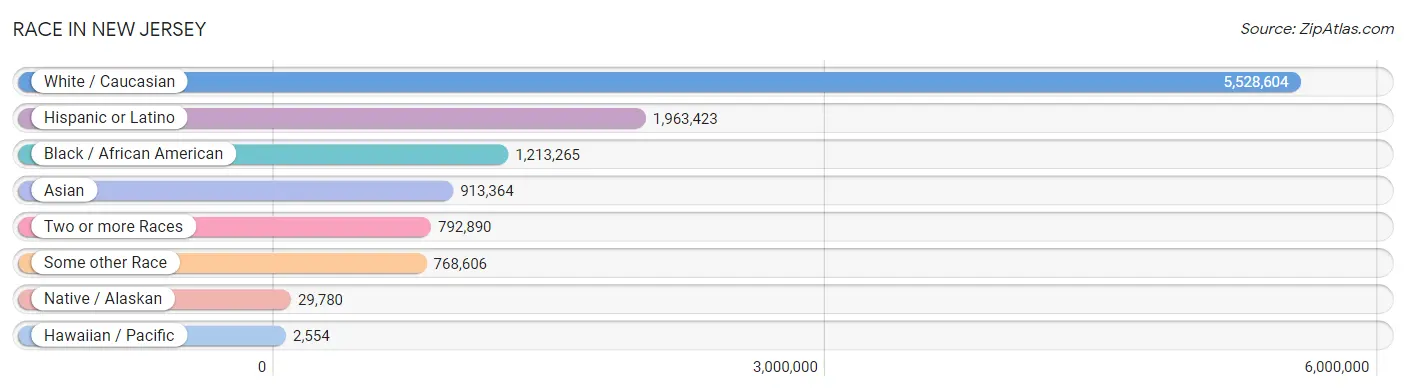
| Race | # Population | % Population |
| Asian | 913,364 | 9.9% |
| Black / African American | 1,213,265 | 13.1% |
| Hawaiian / Pacific | 2,554 | 0.0% |
| Hispanic or Latino | 1,963,423 | 21.2% |
| Native / Alaskan | 29,780 | 0.3% |
| White / Caucasian | 5,528,604 | 59.8% |
| Two or more Races | 792,890 | 8.6% |
| Some other Race | 768,606 | 8.3% |
| Total | 9,249,063 | 100.0% |
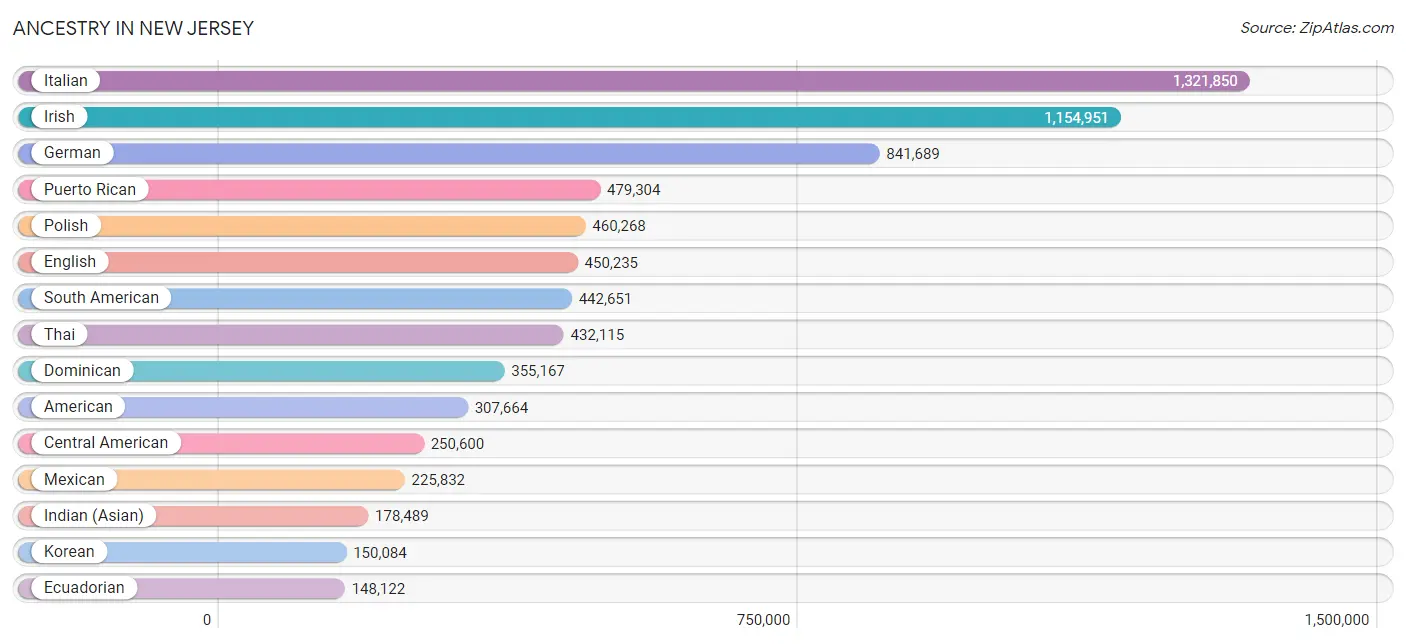
Ancestry in New Jersey
The most populous ancestries reported in New Jersey are Italian (1,321,850 | 14.3%), Irish (1,154,951 | 12.5%), German (841,689 | 9.1%), Puerto Rican (479,304 | 5.2%), and Polish (460,268 | 5.0%), together accounting for 46.0% of all New Jersey residents.
| Ancestry | # Population | % Population |
| Afghan | 2,453 | 0.0% |
| African | 50,507 | 0.5% |
| Alaska Native | 51 | 0.0% |
| Alaskan Athabascan | 110 | 0.0% |
| Albanian | 15,101 | 0.2% |
| Aleut | 30 | 0.0% |
| Alsatian | 383 | 0.0% |
| American | 307,664 | 3.3% |
| Apache | 814 | 0.0% |
| Arab | 114,009 | 1.2% |
| Arapaho | 33 | 0.0% |
| Argentinean | 18,879 | 0.2% |
| Armenian | 14,436 | 0.2% |
| Assyrian / Chaldean / Syriac | 658 | 0.0% |
| Australian | 2,234 | 0.0% |
| Austrian | 29,232 | 0.3% |
| Bahamian | 990 | 0.0% |
| Bangladeshi | 62 | 0.0% |
| Barbadian | 4,123 | 0.0% |
| Basque | 473 | 0.0% |
| Belgian | 5,712 | 0.1% |
| Belizean | 984 | 0.0% |
| Bermudan | 821 | 0.0% |
| Bhutanese | 26,496 | 0.3% |
| Blackfeet | 2,701 | 0.0% |
| Bolivian | 5,536 | 0.1% |
| Brazilian | 46,857 | 0.5% |
| British | 28,314 | 0.3% |
| British West Indian | 7,094 | 0.1% |
| Bulgarian | 3,657 | 0.0% |
| Burmese | 110,729 | 1.2% |
| Cajun | 198 | 0.0% |
| Cambodian | 1,274 | 0.0% |
| Canadian | 11,263 | 0.1% |
| Cape Verdean | 585 | 0.0% |
| Carpatho Rusyn | 604 | 0.0% |
| Celtic | 746 | 0.0% |
| Central American | 250,600 | 2.7% |
| Central American Indian | 16,510 | 0.2% |
| Cherokee | 9,740 | 0.1% |
| Cheyenne | 57 | 0.0% |
| Chickasaw | 187 | 0.0% |
| Chilean | 10,755 | 0.1% |
| Chinese | 260 | 0.0% |
| Chippewa | 569 | 0.0% |
| Choctaw | 566 | 0.0% |
| Colombian | 141,159 | 1.5% |
| Comanche | 16 | 0.0% |
| Costa Rican | 23,222 | 0.3% |
| Cree | 182 | 0.0% |
| Creek | 569 | 0.0% |
| Croatian | 12,690 | 0.1% |
| Crow | 30 | 0.0% |
| Cuban | 95,340 | 1.0% |
| Cypriot | 1,048 | 0.0% |
| Czech | 20,074 | 0.2% |
| Czechoslovakian | 8,520 | 0.1% |
| Danish | 15,084 | 0.2% |
| Delaware | 3,485 | 0.0% |
| Dominican | 355,167 | 3.8% |
| Dutch | 71,192 | 0.8% |
| Dutch West Indian | 339 | 0.0% |
| Eastern European | 60,875 | 0.7% |
| Ecuadorian | 148,122 | 1.6% |
| Egyptian | 46,159 | 0.5% |
| English | 450,235 | 4.9% |
| Estonian | 1,900 | 0.0% |
| Ethiopian | 3,322 | 0.0% |
| European | 78,537 | 0.9% |
| Fijian | 131 | 0.0% |
| Filipino | 10,251 | 0.1% |
| Finnish | 4,988 | 0.1% |
| French | 90,310 | 1.0% |
| French American Indian | 283 | 0.0% |
| French Canadian | 18,454 | 0.2% |
| German | 841,689 | 9.1% |
| German Russian | 574 | 0.0% |
| Ghanaian | 15,204 | 0.2% |
| Greek | 59,285 | 0.6% |
| Guamanian / Chamorro | 1,303 | 0.0% |
| Guatemalan | 72,199 | 0.8% |
| Guyanese | 24,805 | 0.3% |
| Haitian | 71,444 | 0.8% |
| Hmong | 87 | 0.0% |
| Honduran | 54,308 | 0.6% |
| Hopi | 30 | 0.0% |
| Houma | 25 | 0.0% |
| Hungarian | 87,257 | 0.9% |
| Icelander | 523 | 0.0% |
| Indian (Asian) | 178,489 | 1.9% |
| Indonesian | 2,232 | 0.0% |
| Inupiat | 176 | 0.0% |
| Iranian | 7,358 | 0.1% |
| Iraqi | 1,975 | 0.0% |
| Irish | 1,154,951 | 12.5% |
| Iroquois | 1,323 | 0.0% |
| Israeli | 10,636 | 0.1% |
| Italian | 1,321,850 | 14.3% |
| Jamaican | 69,540 | 0.7% |
| Japanese | 3,086 | 0.0% |
| Jordanian | 5,525 | 0.1% |
| Kenyan | 4,229 | 0.1% |
| Korean | 150,084 | 1.6% |
| Laotian | 2,706 | 0.0% |
| Latvian | 4,466 | 0.1% |
| Lebanese | 13,568 | 0.2% |
| Liberian | 6,055 | 0.1% |
| Lithuanian | 30,104 | 0.3% |
| Lumbee | 257 | 0.0% |
| Luxembourger | 206 | 0.0% |
| Macedonian | 6,640 | 0.1% |
| Malaysian | 756 | 0.0% |
| Maltese | 1,476 | 0.0% |
| Menominee | 75 | 0.0% |
| Mexican | 225,832 | 2.4% |
| Mexican American Indian | 7,761 | 0.1% |
| Mongolian | 802 | 0.0% |
| Moroccan | 8,738 | 0.1% |
| Native Hawaiian | 2,760 | 0.0% |
| Navajo | 889 | 0.0% |
| New Zealander | 358 | 0.0% |
| Nicaraguan | 10,621 | 0.1% |
| Nigerian | 32,837 | 0.4% |
| Northern European | 4,982 | 0.1% |
| Norwegian | 38,066 | 0.4% |
| Okinawan | 351 | 0.0% |
| Osage | 73 | 0.0% |
| Ottawa | 4 | 0.0% |
| Paiute | 5 | 0.0% |
| Pakistani | 5,680 | 0.1% |
| Palestinian | 7,913 | 0.1% |
| Panamanian | 8,420 | 0.1% |
| Paraguayan | 2,638 | 0.0% |
| Pennsylvania German | 4,576 | 0.1% |
| Peruvian | 86,844 | 0.9% |
| Pima | 11 | 0.0% |
| Polish | 460,268 | 5.0% |
| Portuguese | 76,844 | 0.8% |
| Potawatomi | 57 | 0.0% |
| Pueblo | 101 | 0.0% |
| Puerto Rican | 479,304 | 5.2% |
| Puget Sound Salish | 95 | 0.0% |
| Romanian | 19,421 | 0.2% |
| Russian | 144,872 | 1.6% |
| Salvadoran | 81,142 | 0.9% |
| Samoan | 920 | 0.0% |
| Scandinavian | 8,655 | 0.1% |
| Scotch-Irish | 30,278 | 0.3% |
| Scottish | 82,032 | 0.9% |
| Seminole | 333 | 0.0% |
| Senegalese | 1,124 | 0.0% |
| Serbian | 4,831 | 0.1% |
| Shoshone | 7 | 0.0% |
| Sierra Leonean | 2,158 | 0.0% |
| Sioux | 701 | 0.0% |
| Slavic | 6,522 | 0.1% |
| Slovak | 28,811 | 0.3% |
| Slovene | 1,445 | 0.0% |
| Somali | 135 | 0.0% |
| South African | 2,569 | 0.0% |
| South American | 442,651 | 4.8% |
| South American Indian | 4,785 | 0.1% |
| Soviet Union | 143 | 0.0% |
| Spaniard | 35,234 | 0.4% |
| Spanish | 15,741 | 0.2% |
| Spanish American | 376 | 0.0% |
| Spanish American Indian | 413 | 0.0% |
| Sri Lankan | 27,431 | 0.3% |
| Subsaharan African | 129,051 | 1.4% |
| Sudanese | 1,103 | 0.0% |
| Swedish | 42,298 | 0.5% |
| Swiss | 13,146 | 0.1% |
| Syrian | 13,936 | 0.2% |
| Taiwanese | 100 | 0.0% |
| Thai | 432,115 | 4.7% |
| Tlingit-Haida | 152 | 0.0% |
| Tohono O'Odham | 9 | 0.0% |
| Tongan | 74 | 0.0% |
| Trinidadian and Tobagonian | 17,351 | 0.2% |
| Turkish | 25,139 | 0.3% |
| U.S. Virgin Islander | 1,218 | 0.0% |
| Ugandan | 649 | 0.0% |
| Ukrainian | 66,636 | 0.7% |
| Uruguayan | 10,064 | 0.1% |
| Ute | 4 | 0.0% |
| Venezuelan | 16,608 | 0.2% |
| Vietnamese | 11,503 | 0.1% |
| Welsh | 29,098 | 0.3% |
| West Indian | 14,042 | 0.2% |
| Yaqui | 177 | 0.0% |
| Yugoslavian | 5,029 | 0.1% |
| Zimbabwean | 346 | 0.0% | View All 192 Rows |
Immigrants in New Jersey
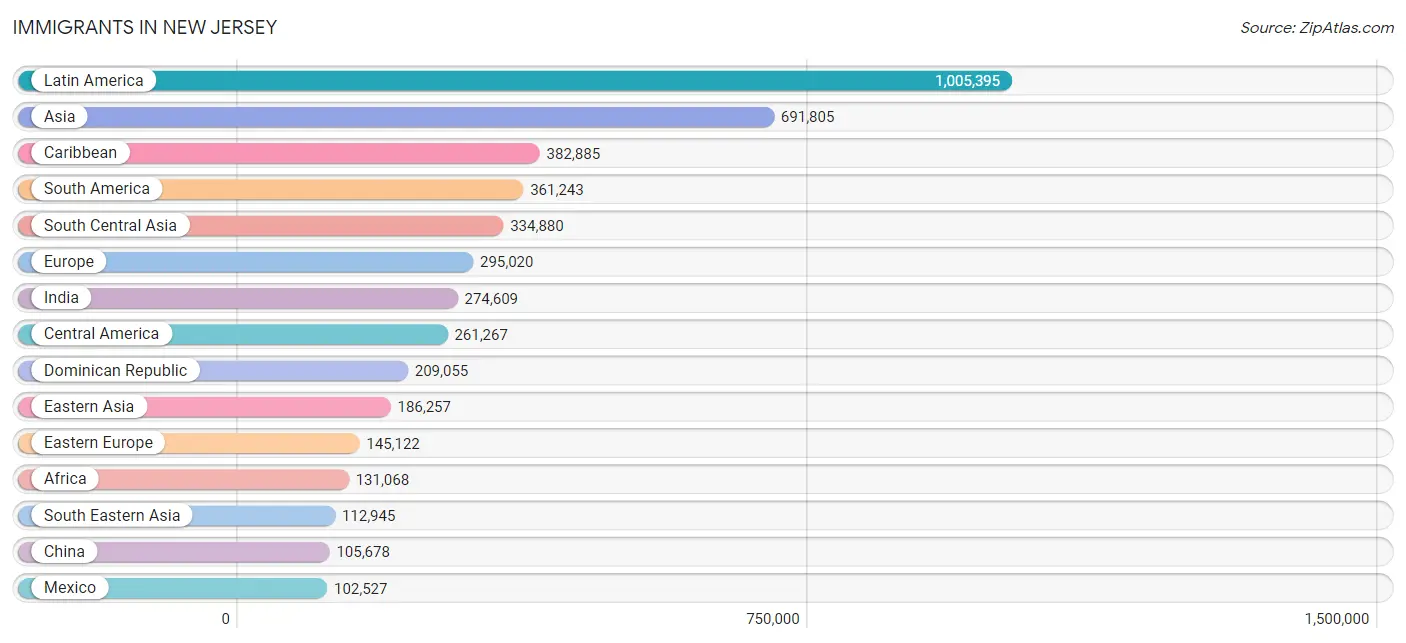
The most numerous immigrant groups reported in New Jersey came from Latin America (1,005,395 | 10.9%), Asia (691,805 | 7.5%), Caribbean (382,885 | 4.1%), South America (361,243 | 3.9%), and South Central Asia (334,880 | 3.6%), together accounting for 30.0% of all New Jersey residents.
| Immigration Origin | # Population | % Population |
| Afghanistan | 1,913 | 0.0% |
| Africa | 131,068 | 1.4% |
| Albania | 6,130 | 0.1% |
| Argentina | 10,607 | 0.1% |
| Armenia | 736 | 0.0% |
| Asia | 691,805 | 7.5% |
| Australia | 2,405 | 0.0% |
| Austria | 1,939 | 0.0% |
| Azores | 343 | 0.0% |
| Bahamas | 799 | 0.0% |
| Bangladesh | 14,405 | 0.2% |
| Barbados | 2,650 | 0.0% |
| Belarus | 4,579 | 0.1% |
| Belgium | 1,090 | 0.0% |
| Belize | 912 | 0.0% |
| Bolivia | 3,252 | 0.0% |
| Bosnia and Herzegovina | 1,406 | 0.0% |
| Brazil | 46,020 | 0.5% |
| Bulgaria | 3,249 | 0.0% |
| Cabo Verde | 165 | 0.0% |
| Cambodia | 892 | 0.0% |
| Cameroon | 2,536 | 0.0% |
| Canada | 18,317 | 0.2% |
| Caribbean | 382,885 | 4.1% |
| Central America | 261,267 | 2.8% |
| Chile | 7,153 | 0.1% |
| China | 105,678 | 1.1% |
| Colombia | 90,817 | 1.0% |
| Congo | 332 | 0.0% |
| Costa Rica | 14,848 | 0.2% |
| Croatia | 2,623 | 0.0% |
| Cuba | 45,435 | 0.5% |
| Czechoslovakia | 3,968 | 0.0% |
| Denmark | 1,131 | 0.0% |
| Dominica | 3,359 | 0.0% |
| Dominican Republic | 209,055 | 2.3% |
| Eastern Africa | 13,566 | 0.2% |
| Eastern Asia | 186,257 | 2.0% |
| Eastern Europe | 145,122 | 1.6% |
| Ecuador | 95,275 | 1.0% |
| Egypt | 33,678 | 0.4% |
| El Salvador | 48,885 | 0.5% |
| England | 10,886 | 0.1% |
| Eritrea | 417 | 0.0% |
| Ethiopia | 2,083 | 0.0% |
| Europe | 295,020 | 3.2% |
| Fiji | 158 | 0.0% |
| France | 6,882 | 0.1% |
| Germany | 17,217 | 0.2% |
| Ghana | 17,949 | 0.2% |
| Greece | 7,501 | 0.1% |
| Grenada | 1,602 | 0.0% |
| Guatemala | 46,813 | 0.5% |
| Guyana | 26,173 | 0.3% |
| Haiti | 49,491 | 0.5% |
| Honduras | 37,335 | 0.4% |
| Hong Kong | 11,161 | 0.1% |
| Hungary | 4,659 | 0.1% |
| India | 274,609 | 3.0% |
| Indonesia | 2,004 | 0.0% |
| Iran | 4,947 | 0.1% |
| Iraq | 1,815 | 0.0% |
| Ireland | 8,146 | 0.1% |
| Israel | 10,975 | 0.1% |
| Italy | 33,198 | 0.4% |
| Jamaica | 47,365 | 0.5% |
| Japan | 10,042 | 0.1% |
| Jordan | 4,399 | 0.1% |
| Kazakhstan | 993 | 0.0% |
| Kenya | 6,479 | 0.1% |
| Korea | 70,512 | 0.8% |
| Kuwait | 1,375 | 0.0% |
| Laos | 362 | 0.0% |
| Latin America | 1,005,395 | 10.9% |
| Latvia | 1,789 | 0.0% |
| Lebanon | 4,324 | 0.1% |
| Liberia | 8,533 | 0.1% |
| Lithuania | 1,662 | 0.0% |
| Malaysia | 2,031 | 0.0% |
| Mexico | 102,527 | 1.1% |
| Middle Africa | 4,475 | 0.1% |
| Moldova | 2,316 | 0.0% |
| Morocco | 5,621 | 0.1% |
| Nepal | 2,890 | 0.0% |
| Netherlands | 2,616 | 0.0% |
| Nicaragua | 5,500 | 0.1% |
| Nigeria | 25,213 | 0.3% |
| North Macedonia | 5,094 | 0.1% |
| Northern Africa | 42,620 | 0.5% |
| Northern Europe | 37,784 | 0.4% |
| Norway | 801 | 0.0% |
| Oceania | 3,154 | 0.0% |
| Pakistan | 27,580 | 0.3% |
| Panama | 4,290 | 0.1% |
| Peru | 58,563 | 0.6% |
| Philippines | 85,934 | 0.9% |
| Poland | 48,811 | 0.5% |
| Portugal | 28,871 | 0.3% |
| Romania | 6,033 | 0.1% |
| Russia | 20,371 | 0.2% |
| Saudi Arabia | 1,929 | 0.0% |
| Scotland | 2,470 | 0.0% |
| Senegal | 1,615 | 0.0% |
| Serbia | 1,881 | 0.0% |
| Sierra Leone | 2,373 | 0.0% |
| Singapore | 1,490 | 0.0% |
| Somalia | 60 | 0.0% |
| South Africa | 3,369 | 0.0% |
| South America | 361,243 | 3.9% |
| South Central Asia | 334,880 | 3.6% |
| South Eastern Asia | 112,945 | 1.2% |
| Southern Europe | 80,241 | 0.9% |
| Spain | 10,246 | 0.1% |
| Sri Lanka | 3,488 | 0.0% |
| St. Vincent and the Grenadines | 1,158 | 0.0% |
| Sudan | 1,274 | 0.0% |
| Sweden | 1,054 | 0.0% |
| Switzerland | 1,396 | 0.0% |
| Syria | 5,966 | 0.1% |
| Taiwan | 15,548 | 0.2% |
| Thailand | 2,903 | 0.0% |
| Trinidad and Tobago | 15,533 | 0.2% |
| Turkey | 16,778 | 0.2% |
| Uganda | 1,291 | 0.0% |
| Ukraine | 22,760 | 0.3% |
| Uruguay | 6,972 | 0.1% |
| Uzbekistan | 2,517 | 0.0% |
| Venezuela | 12,929 | 0.1% |
| Vietnam | 15,644 | 0.2% |
| West Indies | 753 | 0.0% |
| Western Africa | 61,458 | 0.7% |
| Western Asia | 55,103 | 0.6% |
| Western Europe | 31,183 | 0.3% |
| Yemen | 684 | 0.0% |
| Zaire | 655 | 0.0% |
| Zimbabwe | 946 | 0.0% | View All 136 Rows |
Sex and Age in New Jersey
Sex and Age in New Jersey
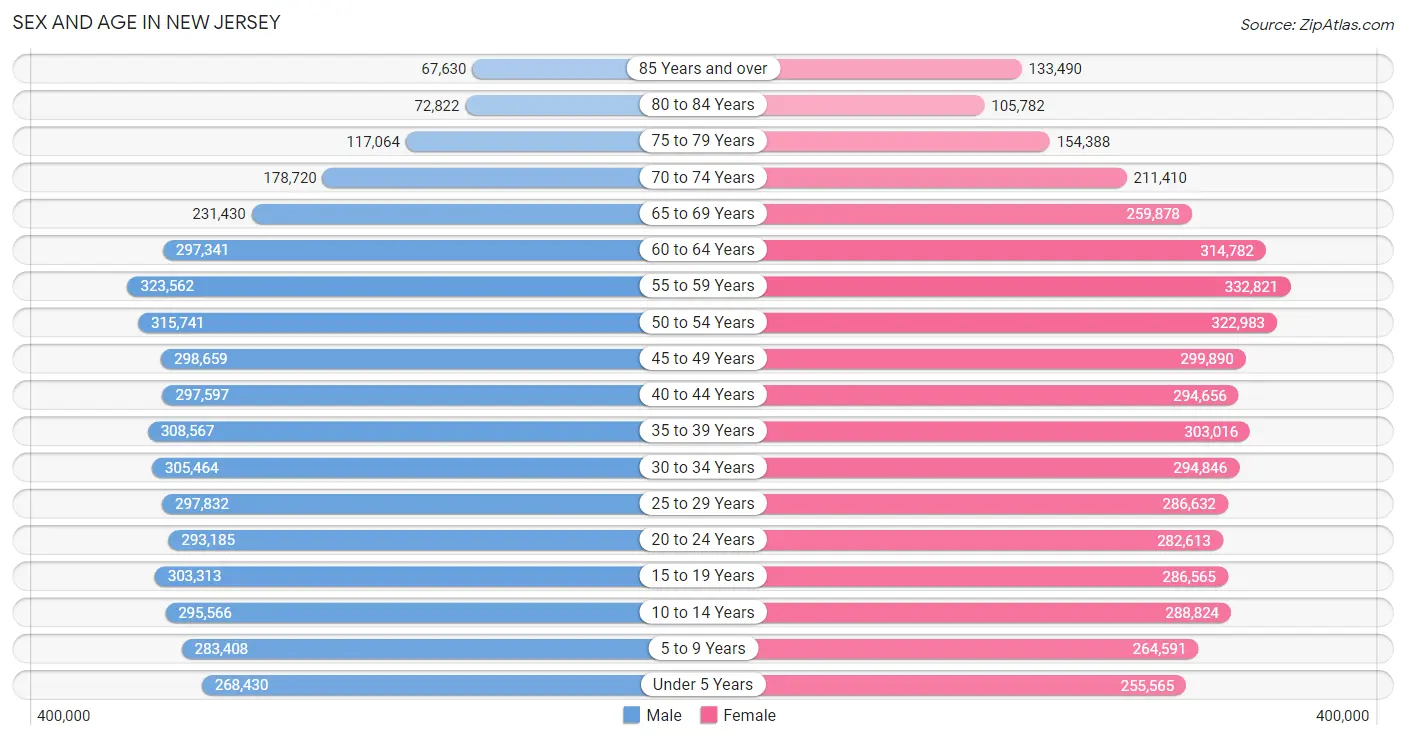
The most populous age groups in New Jersey are 55 to 59 Years (323,562 | 7.1%) for men and 55 to 59 Years (332,821 | 7.1%) for women.
| Age Bracket | Male | Female |
| Under 5 Years | 268,430 (5.9%) | 255,565 (5.4%) |
| 5 to 9 Years | 283,408 (6.2%) | 264,591 (5.6%) |
| 10 to 14 Years | 295,566 (6.5%) | 288,824 (6.1%) |
| 15 to 19 Years | 303,313 (6.7%) | 286,565 (6.1%) |
| 20 to 24 Years | 293,185 (6.4%) | 282,613 (6.0%) |
| 25 to 29 Years | 297,832 (6.5%) | 286,632 (6.1%) |
| 30 to 34 Years | 305,464 (6.7%) | 294,846 (6.3%) |
| 35 to 39 Years | 308,567 (6.8%) | 303,016 (6.5%) |
| 40 to 44 Years | 297,597 (6.5%) | 294,656 (6.3%) |
| 45 to 49 Years | 298,659 (6.6%) | 299,890 (6.4%) |
| 50 to 54 Years | 315,741 (6.9%) | 322,983 (6.9%) |
| 55 to 59 Years | 323,562 (7.1%) | 332,821 (7.1%) |
| 60 to 64 Years | 297,341 (6.5%) | 314,782 (6.7%) |
| 65 to 69 Years | 231,430 (5.1%) | 259,878 (5.5%) |
| 70 to 74 Years | 178,720 (3.9%) | 211,410 (4.5%) |
| 75 to 79 Years | 117,064 (2.6%) | 154,388 (3.3%) |
| 80 to 84 Years | 72,822 (1.6%) | 105,782 (2.2%) |
| 85 Years and over | 67,630 (1.5%) | 133,490 (2.8%) |
| Total | 4,556,331 (100.0%) | 4,692,732 (100.0%) |
Families and Households in New Jersey
Median Family Size in New Jersey
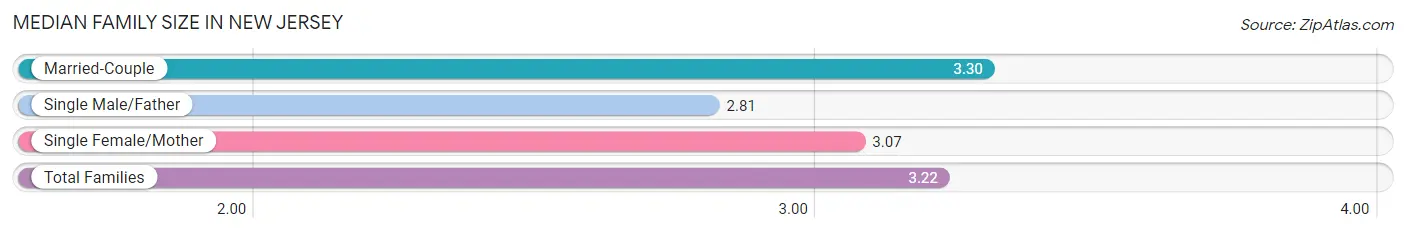
The median family size in New Jersey is 3.22 persons per family, with married-couple families (1,732,602 | 74.0%) accounting for the largest median family size of 3.3 persons per family. On the other hand, single male/father families (170,278 | 7.3%) represent the smallest median family size with 2.81 persons per family.
| Family Type | # Families | Family Size |
| Married-Couple | 1,732,602 (74.0%) | 3.30 |
| Single Male/Father | 170,278 (7.3%) | 2.81 |
| Single Female/Mother | 437,620 (18.7%) | 3.07 |
| Total Families | 2,340,500 (100.0%) | 3.22 |
Median Household Size in New Jersey
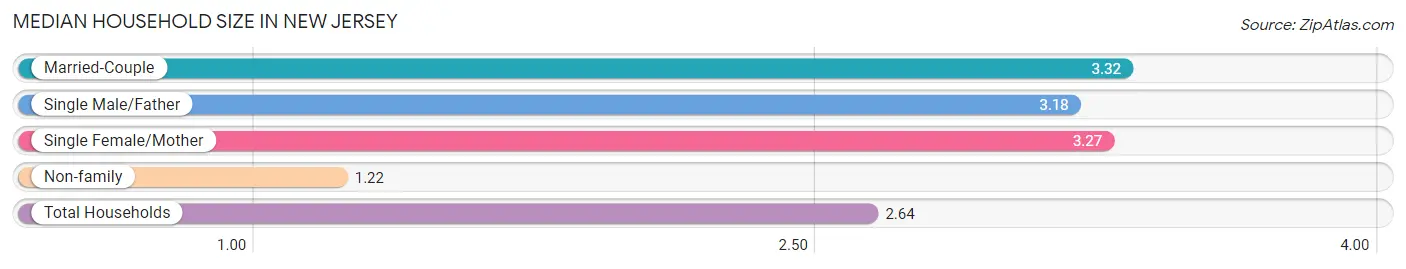
The median household size in New Jersey is 2.64 persons per household, with married-couple households (1,732,602 | 50.4%) accounting for the largest median household size of 3.32 persons per household. non-family households (1,097,662 | 31.9%) represent the smallest median household size with 1.22 persons per household.
| Household Type | # Households | Household Size |
| Married-Couple | 1,732,602 (50.4%) | 3.32 |
| Single Male/Father | 170,278 (5.0%) | 3.18 |
| Single Female/Mother | 437,620 (12.7%) | 3.27 |
| Non-family | 1,097,662 (31.9%) | 1.22 |
| Total Households | 3,438,162 (100.0%) | 2.64 |
Household Size by Marriage Status in New Jersey
Out of a total of 3,438,162 households in New Jersey, 2,340,500 (68.1%) are family households, while 1,097,662 (31.9%) are nonfamily households. The most numerous type of family households are 2-person households, comprising 907,547, and the most common type of nonfamily households are 1-person households, comprising 905,148.
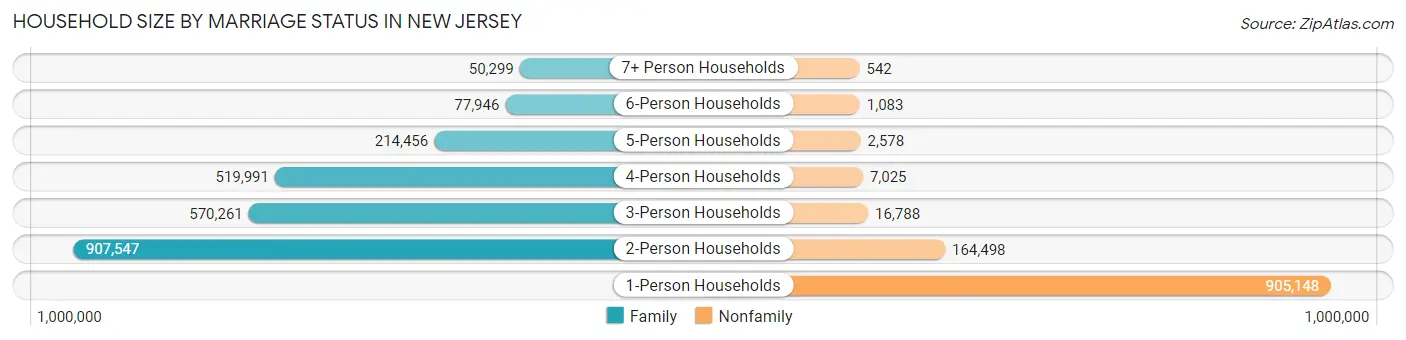
| Household Size | Family Households | Nonfamily Households |
| 1-Person Households | - | 905,148 (26.3%) |
| 2-Person Households | 907,547 (26.4%) | 164,498 (4.8%) |
| 3-Person Households | 570,261 (16.6%) | 16,788 (0.5%) |
| 4-Person Households | 519,991 (15.1%) | 7,025 (0.2%) |
| 5-Person Households | 214,456 (6.2%) | 2,578 (0.1%) |
| 6-Person Households | 77,946 (2.3%) | 1,083 (0.0%) |
| 7+ Person Households | 50,299 (1.5%) | 542 (0.0%) |
| Total | 2,340,500 (68.1%) | 1,097,662 (31.9%) |
Female Fertility in New Jersey
Fertility by Age in New Jersey
Average fertility rate in New Jersey is 51.0 births per 1,000 women. Women in the age bracket of 20 to 34 years have the highest fertility rate with 78.0 births per 1,000 women. Women in the age bracket of 20 to 34 years acount for 62.2% of all women with births.
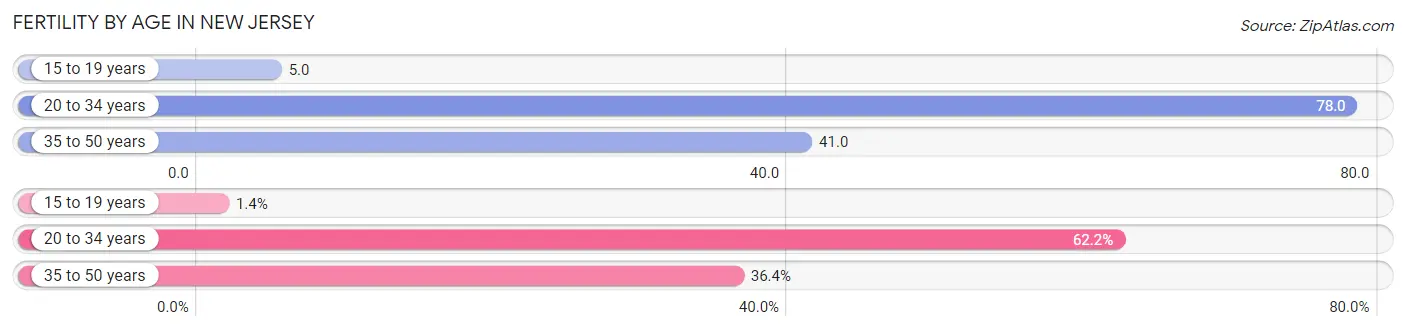
| Age Bracket | Women with Births | Births / 1,000 Women |
| 15 to 19 years | 1,526 (1.4%) | 5.0 |
| 20 to 34 years | 67,059 (62.2%) | 78.0 |
| 35 to 50 years | 39,177 (36.4%) | 41.0 |
| Total | 107,762 (100.0%) | 51.0 |
Fertility by Age by Marriage Status in New Jersey
73.6% of women with births (107,762) in New Jersey are married. The highest percentage of unmarried women with births falls into 15 to 19 years age bracket with 89.9% of them unmarried at the time of birth, while the lowest percentage of unmarried women with births belong to 35 to 50 years age bracket with 17.5% of them unmarried.
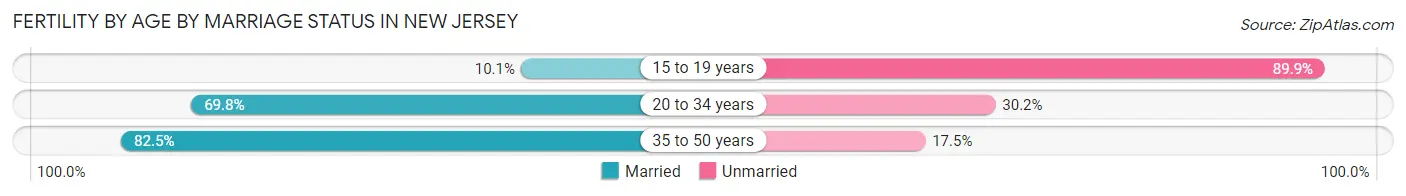
| Age Bracket | Married | Unmarried |
| 15 to 19 years | 154 (10.1%) | 1,372 (89.9%) |
| 20 to 34 years | 46,807 (69.8%) | 20,252 (30.2%) |
| 35 to 50 years | 32,321 (82.5%) | 6,856 (17.5%) |
| Total | 79,313 (73.6%) | 28,449 (26.4%) |
Fertility by Education in New Jersey
Average fertility rate in New Jersey is 51.0 births per 1,000 women. Women with the education attainment of graduate degree have the highest fertility rate of 72.0 births per 1,000 women, while women with the education attainment of less than high school have the lowest fertility at 28.0 births per 1,000 women. Women with the education attainment of bachelor's degree represent 27.1% of all women with births.
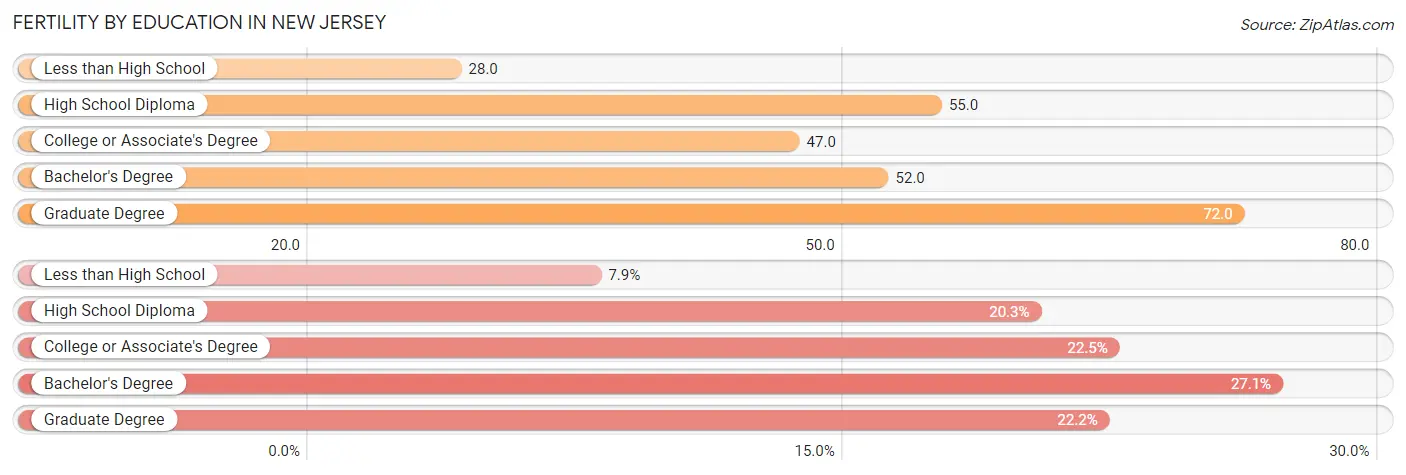
| Educational Attainment | Women with Births | Births / 1,000 Women |
| Less than High School | 8,542 (7.9%) | 28.0 |
| High School Diploma | 21,864 (20.3%) | 55.0 |
| College or Associate's Degree | 24,233 (22.5%) | 47.0 |
| Bachelor's Degree | 29,184 (27.1%) | 52.0 |
| Graduate Degree | 23,939 (22.2%) | 72.0 |
| Total | 107,762 (100.0%) | 51.0 |
Fertility by Education by Marriage Status in New Jersey
26.4% of women with births in New Jersey are unmarried. Women with the educational attainment of graduate degree are most likely to be married with 93.7% of them married at childbirth, while women with the educational attainment of less than high school are least likely to be married with 49.3% of them unmarried at childbirth.
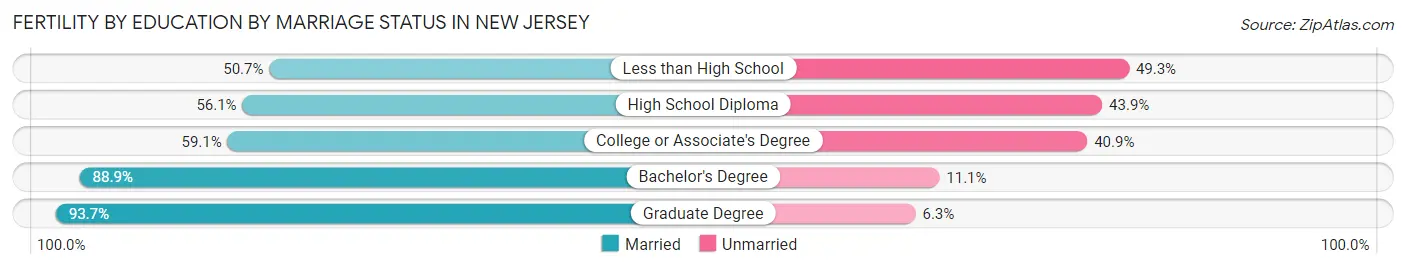
| Educational Attainment | Married | Unmarried |
| Less than High School | 4,331 (50.7%) | 4,211 (49.3%) |
| High School Diploma | 12,266 (56.1%) | 9,598 (43.9%) |
| College or Associate's Degree | 14,322 (59.1%) | 9,911 (40.9%) |
| Bachelor's Degree | 25,945 (88.9%) | 3,239 (11.1%) |
| Graduate Degree | 22,431 (93.7%) | 1,508 (6.3%) |
| Total | 79,313 (73.6%) | 28,449 (26.4%) |
Employment Characteristics in New Jersey
Employment by Class of Employer in New Jersey
Among the 4,517,714 employed individuals in New Jersey, private company employees (3,150,022 | 69.7%), local government employees (368,769 | 8.2%), and not-for-profit organizations (334,797 | 7.4%) make up the most common classes of employment.
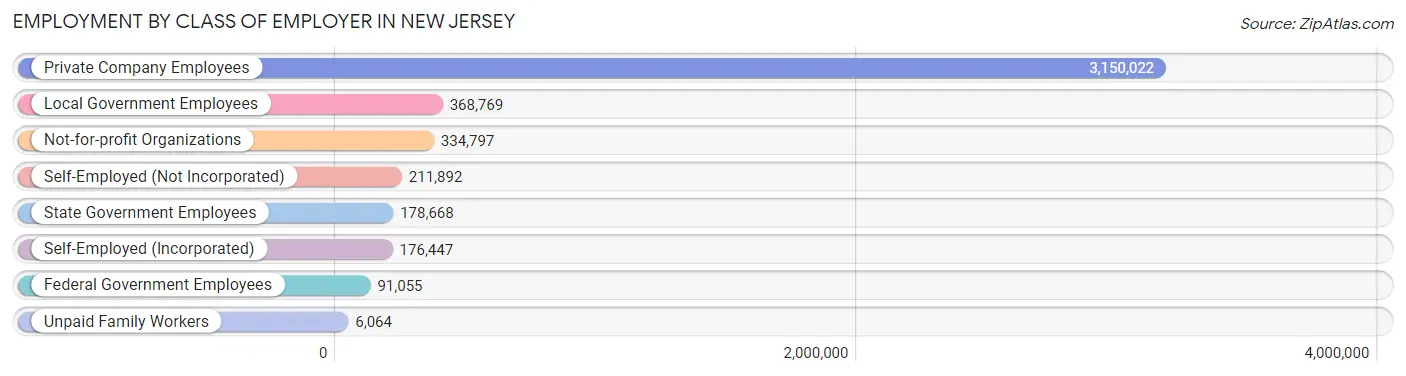
| Employer Class | # Employees | % Employees |
| Private Company Employees | 3,150,022 | 69.7% |
| Self-Employed (Incorporated) | 176,447 | 3.9% |
| Self-Employed (Not Incorporated) | 211,892 | 4.7% |
| Not-for-profit Organizations | 334,797 | 7.4% |
| Local Government Employees | 368,769 | 8.2% |
| State Government Employees | 178,668 | 4.0% |
| Federal Government Employees | 91,055 | 2.0% |
| Unpaid Family Workers | 6,064 | 0.1% |
| Total | 4,517,714 | 100.0% |
Employment Status by Age in New Jersey
According to the labor force statistics for New Jersey, out of the total population over 16 years of age (7,473,298), 66.1% or 4,939,850 individuals are in the labor force, with 6.2% or 306,271 of them unemployed. The age group with the highest labor force participation rate is 35 to 44 years, with 85.8% or 1,032,891 individuals in the labor force. Within the labor force, the 16 to 19 years age range has the highest percentage of unemployed individuals, with 15.9% or 25,435 of them being unemployed.
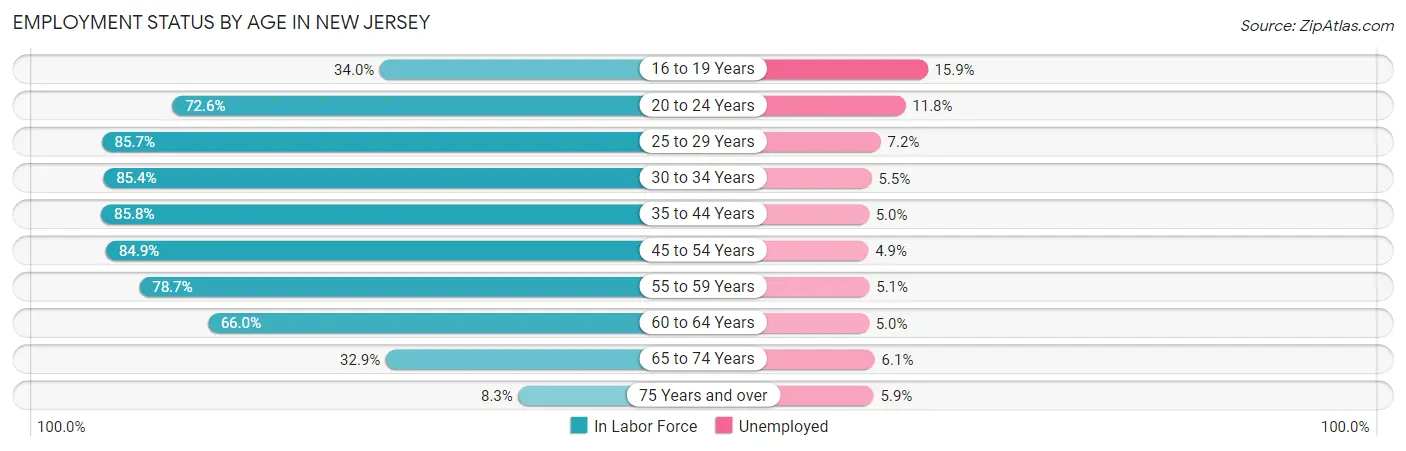
| Age Bracket | In Labor Force | Unemployed |
| 16 to 19 Years | 159,969 (34.0%) | 25,435 (15.9%) |
| 20 to 24 Years | 418,029 (72.6%) | 49,327 (11.8%) |
| 25 to 29 Years | 500,886 (85.7%) | 36,064 (7.2%) |
| 30 to 34 Years | 512,665 (85.4%) | 28,197 (5.5%) |
| 35 to 44 Years | 1,032,891 (85.8%) | 51,645 (5.0%) |
| 45 to 54 Years | 1,050,445 (84.9%) | 51,472 (4.9%) |
| 55 to 59 Years | 516,573 (78.7%) | 26,345 (5.1%) |
| 60 to 64 Years | 404,001 (66.0%) | 20,200 (5.0%) |
| 65 to 74 Years | 289,993 (32.9%) | 17,690 (6.1%) |
| 75 Years and over | 54,048 (8.3%) | 3,189 (5.9%) |
| Total | 4,939,850 (66.1%) | 306,271 (6.2%) |
Employment Status by Educational Attainment in New Jersey
According to labor force statistics for New Jersey, 82.1% of individuals (4,018,293) out of the total population between 25 and 64 years of age (4,894,389) are in the labor force, with 5.3% or 212,970 of them being unemployed. The group with the highest labor force participation rate are those with the educational attainment of bachelor's degree or higher, with 88.2% or 1,946,358 individuals in the labor force. Within the labor force, individuals with less than high school education have the highest percentage of unemployment, with 8.0% or 21,036 of them being unemployed.
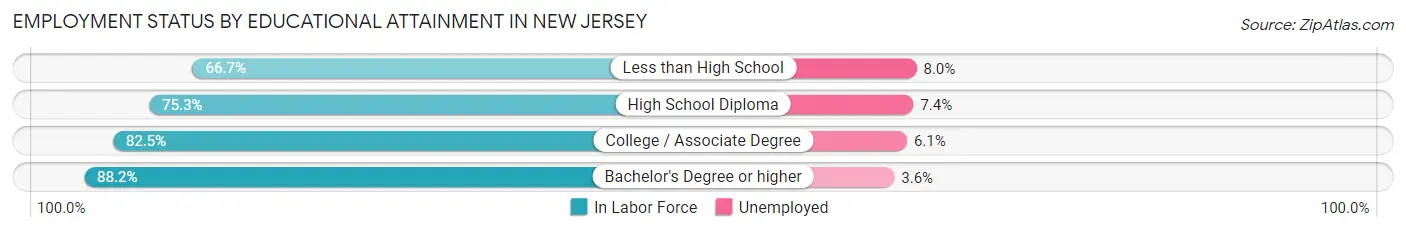
| Educational Attainment | In Labor Force | Unemployed |
| Less than High School | 262,952 (66.7%) | 31,538 (8.0%) |
| High School Diploma | 884,823 (75.3%) | 86,955 (7.4%) |
| College / Associate Degree | 922,630 (82.5%) | 68,219 (6.1%) |
| Bachelor's Degree or higher | 1,946,358 (88.2%) | 79,443 (3.6%) |
| Total | 4,018,293 (82.1%) | 259,403 (5.3%) |
Employment Occupations by Sex in New Jersey
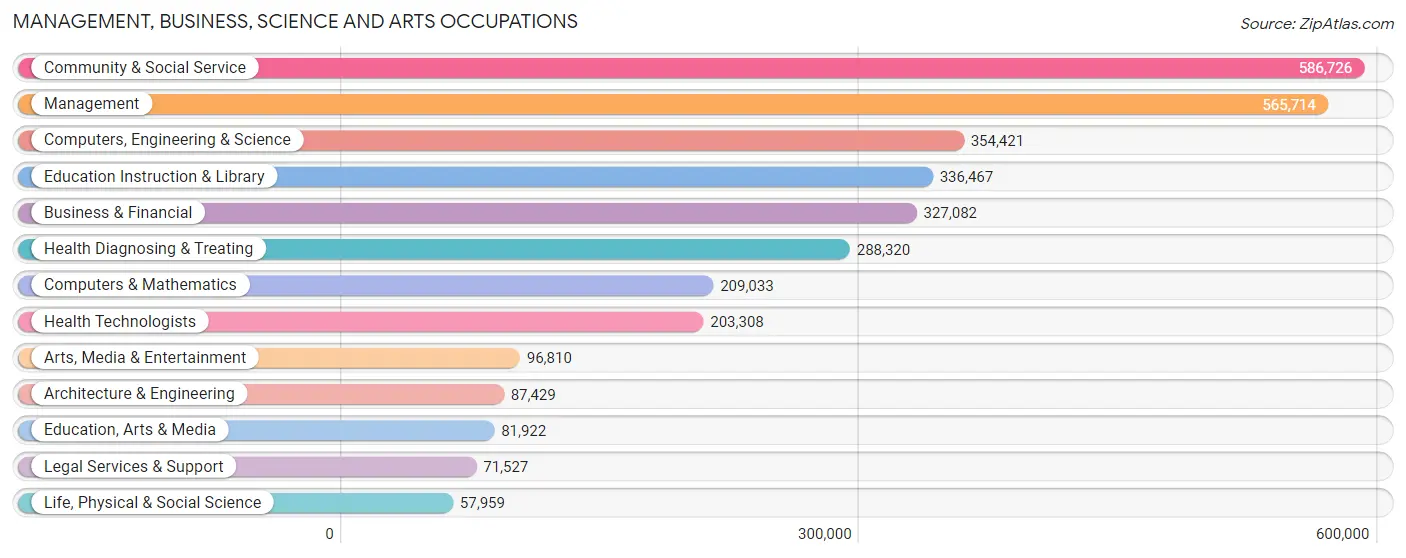
Management, Business, Science and Arts Occupations
The most common Management, Business, Science and Arts occupations in New Jersey are Community & Social Service (586,726 | 12.7%), Management (565,714 | 12.2%), Computers, Engineering & Science (354,421 | 7.7%), Education Instruction & Library (336,467 | 7.3%), and Business & Financial (327,082 | 7.1%).
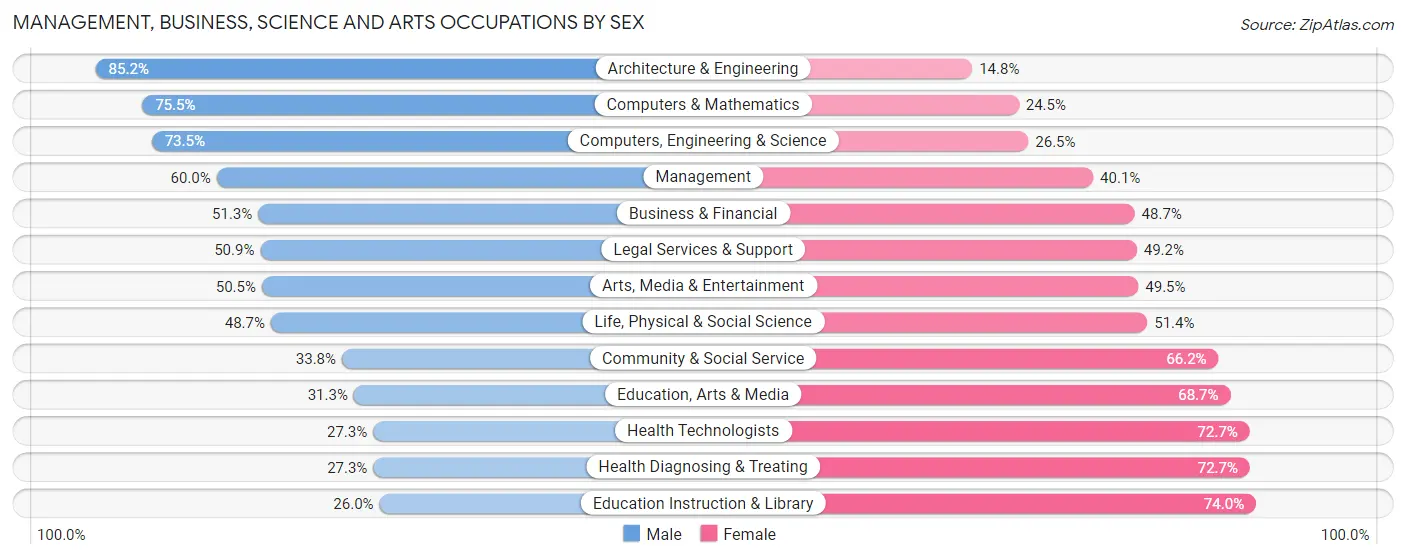
Management, Business, Science and Arts Occupations by Sex
Within the Management, Business, Science and Arts occupations in New Jersey, the most male-oriented occupations are Architecture & Engineering (85.2%), Computers & Mathematics (75.5%), and Computers, Engineering & Science (73.5%), while the most female-oriented occupations are Education Instruction & Library (74.0%), Health Diagnosing & Treating (72.7%), and Health Technologists (72.7%).
| Occupation | Male | Female |
| Management | 339,167 (60.0%) | 226,547 (40.1%) |
| Business & Financial | 167,773 (51.3%) | 159,309 (48.7%) |
| Computers, Engineering & Science | 260,395 (73.5%) | 94,026 (26.5%) |
| Computers & Mathematics | 157,737 (75.5%) | 51,296 (24.5%) |
| Architecture & Engineering | 74,461 (85.2%) | 12,968 (14.8%) |
| Life, Physical & Social Science | 28,197 (48.6%) | 29,762 (51.3%) |
| Community & Social Service | 198,404 (33.8%) | 388,322 (66.2%) |
| Education, Arts & Media | 25,674 (31.3%) | 56,248 (68.7%) |
| Legal Services & Support | 36,369 (50.8%) | 35,158 (49.1%) |
| Education Instruction & Library | 87,452 (26.0%) | 249,015 (74.0%) |
| Arts, Media & Entertainment | 48,909 (50.5%) | 47,901 (49.5%) |
| Health Diagnosing & Treating | 78,656 (27.3%) | 209,664 (72.7%) |
| Health Technologists | 55,516 (27.3%) | 147,792 (72.7%) |
| Total (Category) | 1,044,395 (49.2%) | 1,077,868 (50.8%) |
| Total (Overall) | 2,437,343 (52.8%) | 2,182,026 (47.2%) |
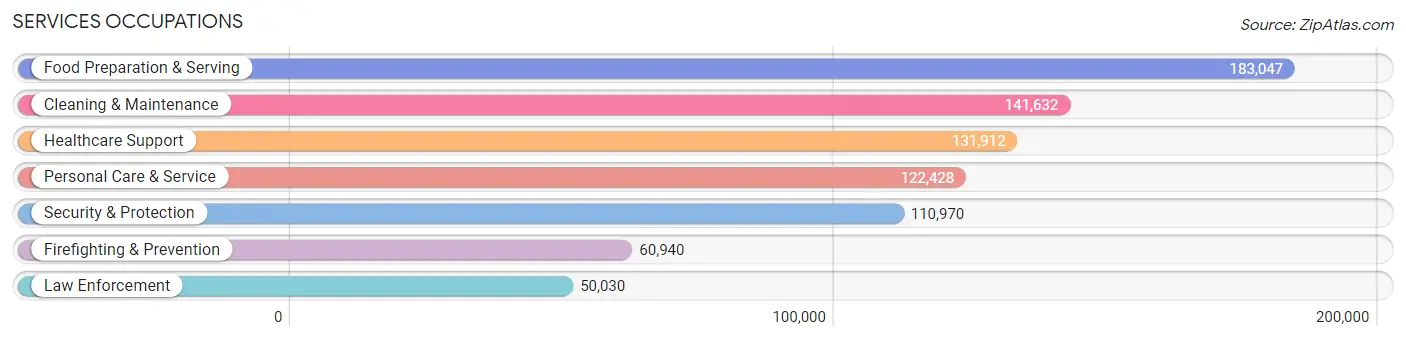
Services Occupations
The most common Services occupations in New Jersey are Food Preparation & Serving (183,047 | 4.0%), Cleaning & Maintenance (141,632 | 3.1%), Healthcare Support (131,912 | 2.9%), Personal Care & Service (122,428 | 2.6%), and Security & Protection (110,970 | 2.4%).
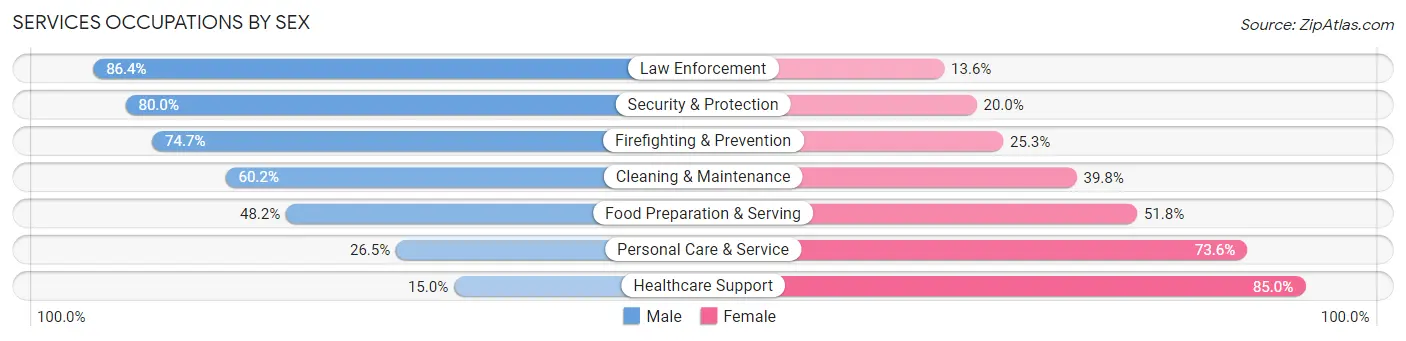
Services Occupations by Sex
Within the Services occupations in New Jersey, the most male-oriented occupations are Law Enforcement (86.4%), Security & Protection (80.0%), and Firefighting & Prevention (74.7%), while the most female-oriented occupations are Healthcare Support (85.0%), Personal Care & Service (73.6%), and Food Preparation & Serving (51.8%).
| Occupation | Male | Female |
| Healthcare Support | 19,751 (15.0%) | 112,161 (85.0%) |
| Security & Protection | 88,773 (80.0%) | 22,197 (20.0%) |
| Firefighting & Prevention | 45,544 (74.7%) | 15,396 (25.3%) |
| Law Enforcement | 43,229 (86.4%) | 6,801 (13.6%) |
| Food Preparation & Serving | 88,280 (48.2%) | 94,767 (51.8%) |
| Cleaning & Maintenance | 85,260 (60.2%) | 56,372 (39.8%) |
| Personal Care & Service | 32,385 (26.5%) | 90,043 (73.6%) |
| Total (Category) | 314,449 (45.6%) | 375,540 (54.4%) |
| Total (Overall) | 2,437,343 (52.8%) | 2,182,026 (47.2%) |
Sales and Office Occupations
The most common Sales and Office occupations in New Jersey are Office & Administration (511,182 | 11.1%), and Sales & Related (445,582 | 9.7%).

Sales and Office Occupations by Sex
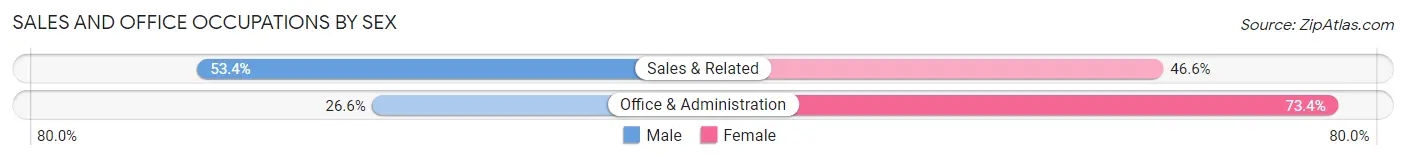
| Occupation | Male | Female |
| Sales & Related | 238,002 (53.4%) | 207,580 (46.6%) |
| Office & Administration | 136,091 (26.6%) | 375,091 (73.4%) |
| Total (Category) | 374,093 (39.1%) | 582,671 (60.9%) |
| Total (Overall) | 2,437,343 (52.8%) | 2,182,026 (47.2%) |
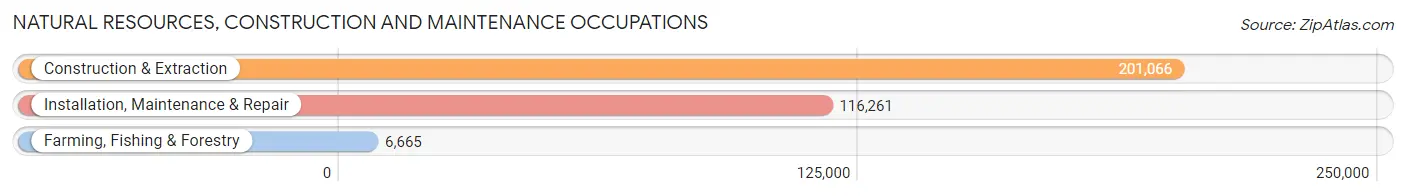
Natural Resources, Construction and Maintenance Occupations
The most common Natural Resources, Construction and Maintenance occupations in New Jersey are Construction & Extraction (201,066 | 4.3%), Installation, Maintenance & Repair (116,261 | 2.5%), and Farming, Fishing & Forestry (6,665 | 0.1%).
Natural Resources, Construction and Maintenance Occupations by Sex
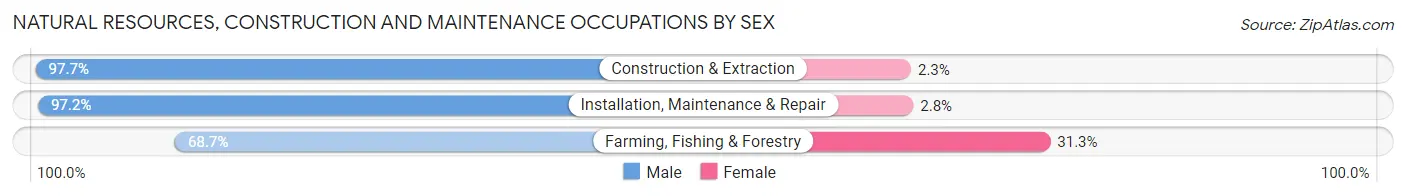
| Occupation | Male | Female |
| Farming, Fishing & Forestry | 4,579 (68.7%) | 2,086 (31.3%) |
| Construction & Extraction | 196,412 (97.7%) | 4,654 (2.3%) |
| Installation, Maintenance & Repair | 113,022 (97.2%) | 3,239 (2.8%) |
| Total (Category) | 314,013 (96.9%) | 9,979 (3.1%) |
| Total (Overall) | 2,437,343 (52.8%) | 2,182,026 (47.2%) |
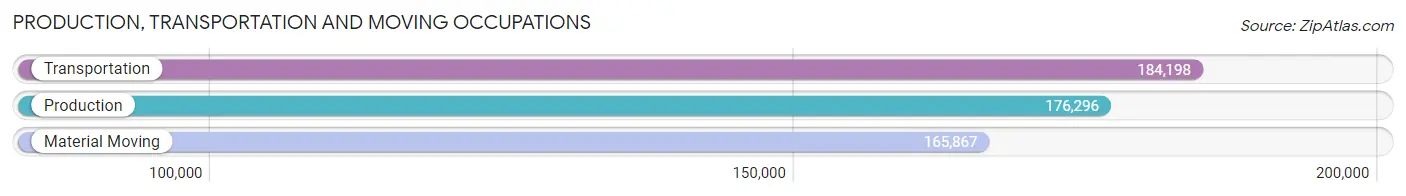
Production, Transportation and Moving Occupations
The most common Production, Transportation and Moving occupations in New Jersey are Transportation (184,198 | 4.0%), Production (176,296 | 3.8%), and Material Moving (165,867 | 3.6%).
Production, Transportation and Moving Occupations by Sex
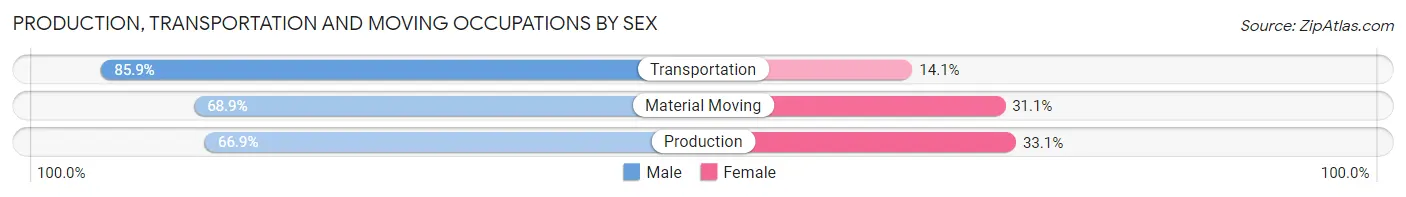
| Occupation | Male | Female |
| Production | 117,925 (66.9%) | 58,371 (33.1%) |
| Transportation | 158,230 (85.9%) | 25,968 (14.1%) |
| Material Moving | 114,238 (68.9%) | 51,629 (31.1%) |
| Total (Category) | 390,393 (74.2%) | 135,968 (25.8%) |
| Total (Overall) | 2,437,343 (52.8%) | 2,182,026 (47.2%) |
Employment Industries by Sex in New Jersey
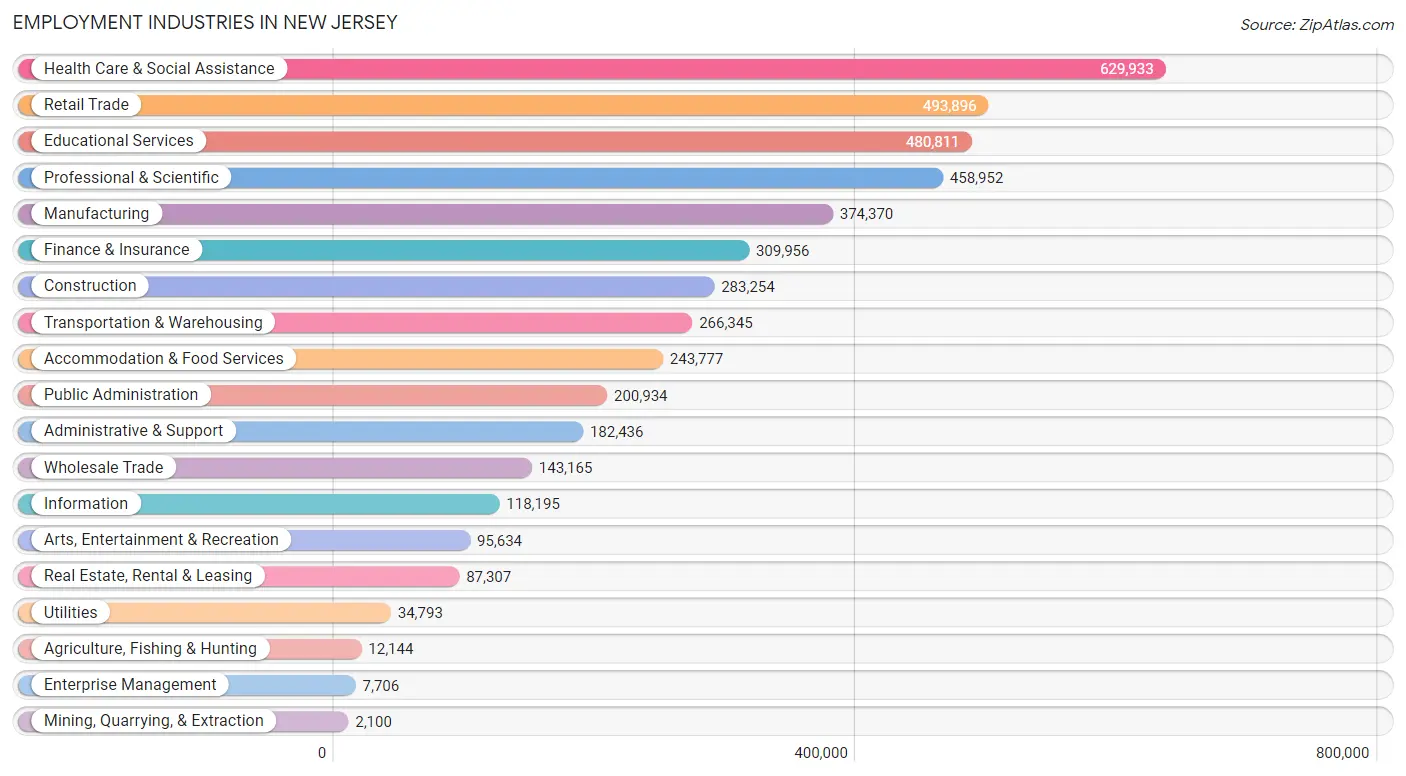
Employment Industries in New Jersey
The major employment industries in New Jersey include Health Care & Social Assistance (629,933 | 13.6%), Retail Trade (493,896 | 10.7%), Educational Services (480,811 | 10.4%), Professional & Scientific (458,952 | 9.9%), and Manufacturing (374,370 | 8.1%).
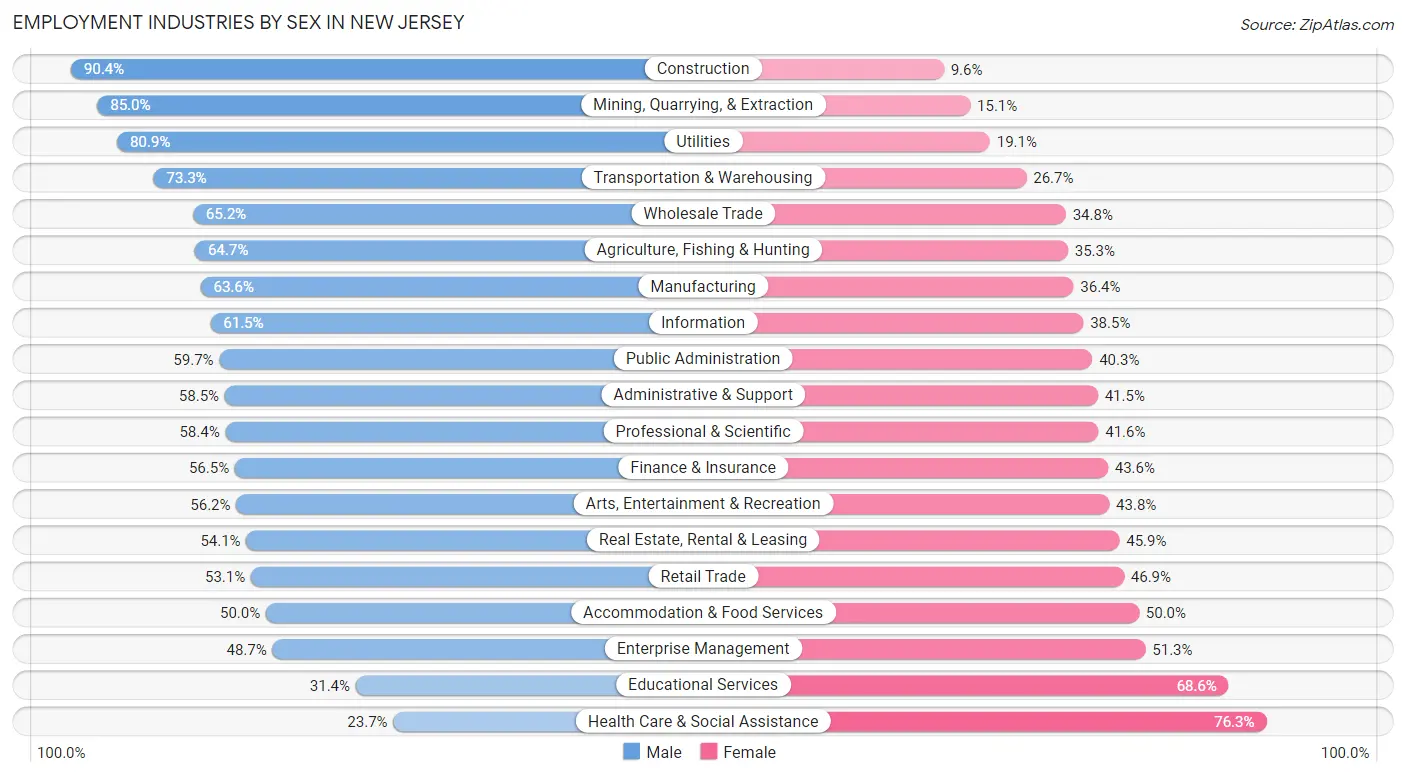
Employment Industries by Sex in New Jersey
The New Jersey industries that see more men than women are Construction (90.4%), Mining, Quarrying, & Extraction (85.0%), and Utilities (80.9%), whereas the industries that tend to have a higher number of women are Health Care & Social Assistance (76.3%), Educational Services (68.6%), and Enterprise Management (51.3%).
| Industry | Male | Female |
| Agriculture, Fishing & Hunting | 7,861 (64.7%) | 4,283 (35.3%) |
| Mining, Quarrying, & Extraction | 1,784 (85.0%) | 316 (15.0%) |
| Construction | 256,118 (90.4%) | 27,136 (9.6%) |
| Manufacturing | 238,030 (63.6%) | 136,340 (36.4%) |
| Wholesale Trade | 93,291 (65.2%) | 49,874 (34.8%) |
| Retail Trade | 262,415 (53.1%) | 231,481 (46.9%) |
| Transportation & Warehousing | 195,313 (73.3%) | 71,032 (26.7%) |
| Utilities | 28,138 (80.9%) | 6,655 (19.1%) |
| Information | 72,742 (61.5%) | 45,453 (38.5%) |
| Finance & Insurance | 174,959 (56.5%) | 134,997 (43.5%) |
| Real Estate, Rental & Leasing | 47,215 (54.1%) | 40,092 (45.9%) |
| Professional & Scientific | 268,136 (58.4%) | 190,816 (41.6%) |
| Enterprise Management | 3,751 (48.7%) | 3,955 (51.3%) |
| Administrative & Support | 106,802 (58.5%) | 75,634 (41.5%) |
| Educational Services | 151,181 (31.4%) | 329,630 (68.6%) |
| Health Care & Social Assistance | 149,063 (23.7%) | 480,870 (76.3%) |
| Arts, Entertainment & Recreation | 53,720 (56.2%) | 41,914 (43.8%) |
| Accommodation & Food Services | 121,962 (50.0%) | 121,815 (50.0%) |
| Public Administration | 119,925 (59.7%) | 81,009 (40.3%) |
| Total | 2,437,343 (52.8%) | 2,182,026 (47.2%) |
Education in New Jersey
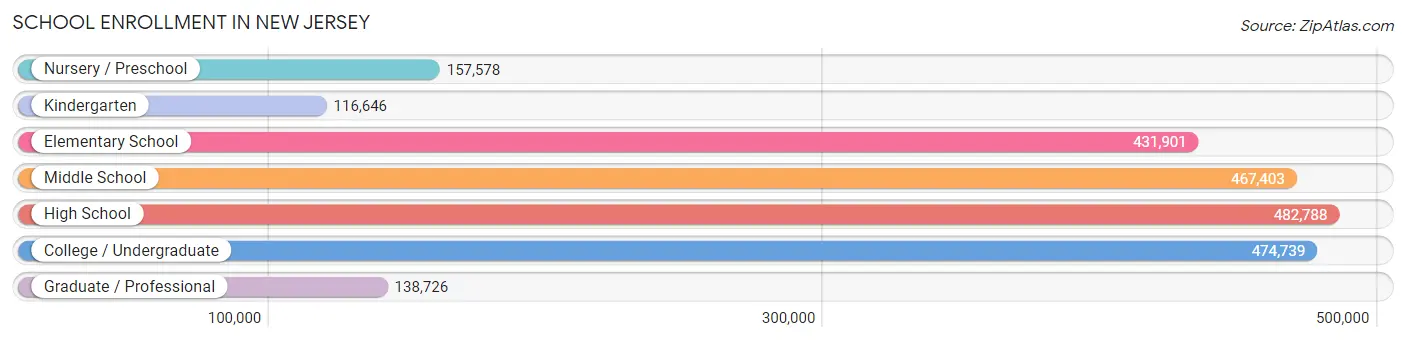
School Enrollment in New Jersey
The most common levels of schooling among the 2,269,781 students in New Jersey are high school (482,788 | 21.3%), college / undergraduate (474,739 | 20.9%), and middle school (467,403 | 20.6%).
| School Level | # Students | % Students |
| Nursery / Preschool | 157,578 | 6.9% |
| Kindergarten | 116,646 | 5.1% |
| Elementary School | 431,901 | 19.0% |
| Middle School | 467,403 | 20.6% |
| High School | 482,788 | 21.3% |
| College / Undergraduate | 474,739 | 20.9% |
| Graduate / Professional | 138,726 | 6.1% |
| Total | 2,269,781 | 100.0% |
School Enrollment by Age by Funding Source in New Jersey
Out of a total of 2,269,781 students who are enrolled in schools in New Jersey, 467,575 (20.6%) attend a private institution, while the remaining 1,802,206 (79.4%) are enrolled in public schools. The age group of 3 to 4 year olds has the highest likelihood of being enrolled in private schools, with 56,986 (42.6% in the age bracket) enrolled. Conversely, the age group of 10 to 14 year olds has the lowest likelihood of being enrolled in a private school, with 510,338 (89.0% in the age bracket) attending a public institution.
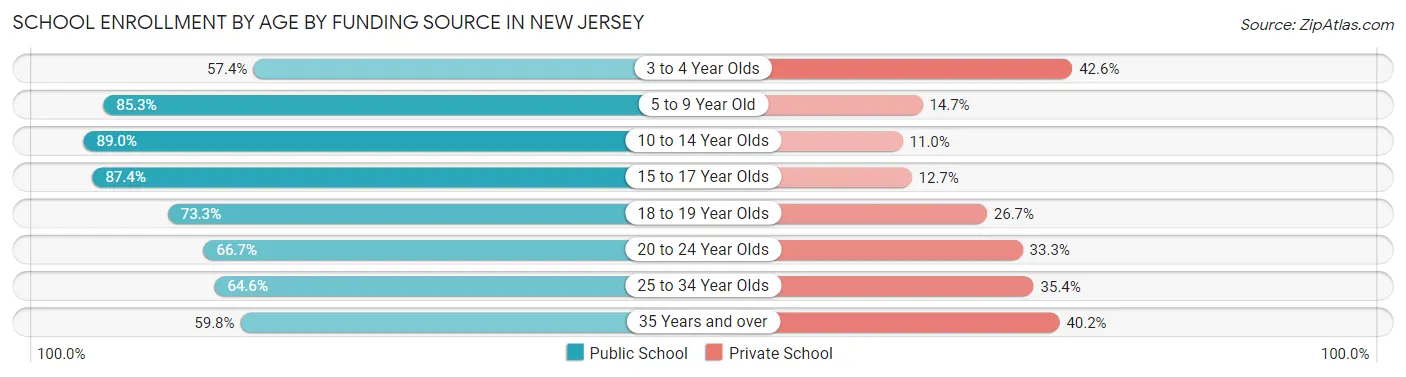
| Age Bracket | Public School | Private School |
| 3 to 4 Year Olds | 76,865 (57.4%) | 56,986 (42.6%) |
| 5 to 9 Year Old | 447,034 (85.3%) | 76,875 (14.7%) |
| 10 to 14 Year Olds | 510,338 (89.0%) | 62,957 (11.0%) |
| 15 to 17 Year Olds | 305,660 (87.4%) | 44,280 (12.7%) |
| 18 to 19 Year Olds | 137,971 (73.3%) | 50,184 (26.7%) |
| 20 to 24 Year Olds | 175,155 (66.7%) | 87,598 (33.3%) |
| 25 to 34 Year Olds | 82,864 (64.6%) | 45,374 (35.4%) |
| 35 Years and over | 65,577 (59.8%) | 44,063 (40.2%) |
| Total | 1,802,206 (79.4%) | 467,575 (20.6%) |
Educational Attainment by Field of Study in New Jersey
Business (612,140 | 20.9%), education (301,903 | 10.3%), science & technology (258,038 | 8.8%), social sciences (250,248 | 8.6%), and engineering (242,433 | 8.3%) are the most common fields of study among 2,921,936 individuals in New Jersey who have obtained a bachelor's degree or higher.
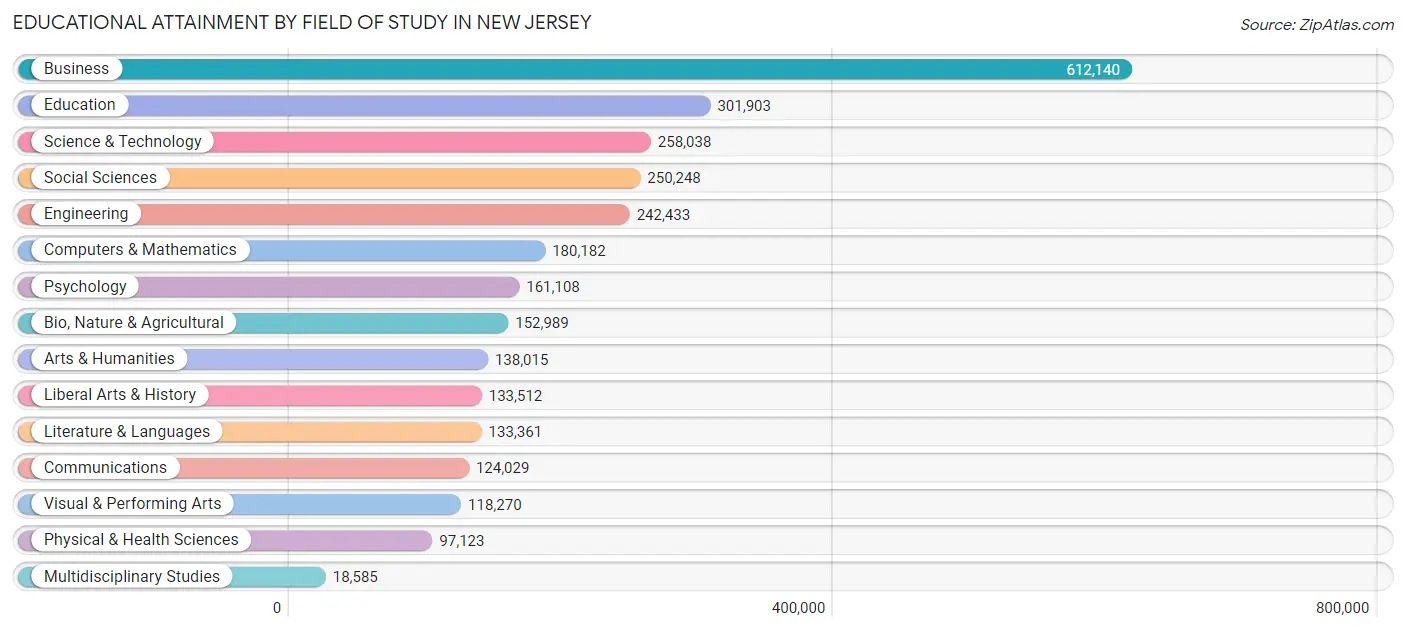
| Field of Study | # Graduates | % Graduates |
| Computers & Mathematics | 180,182 | 6.2% |
| Bio, Nature & Agricultural | 152,989 | 5.2% |
| Physical & Health Sciences | 97,123 | 3.3% |
| Psychology | 161,108 | 5.5% |
| Social Sciences | 250,248 | 8.6% |
| Engineering | 242,433 | 8.3% |
| Multidisciplinary Studies | 18,585 | 0.6% |
| Science & Technology | 258,038 | 8.8% |
| Business | 612,140 | 20.9% |
| Education | 301,903 | 10.3% |
| Literature & Languages | 133,361 | 4.6% |
| Liberal Arts & History | 133,512 | 4.6% |
| Visual & Performing Arts | 118,270 | 4.1% |
| Communications | 124,029 | 4.2% |
| Arts & Humanities | 138,015 | 4.7% |
| Total | 2,921,936 | 100.0% |
Transportation & Commute in New Jersey
Vehicle Availability by Sex in New Jersey
The most prevalent vehicle ownership categories in New Jersey are males with 2 vehicles (964,167, accounting for 40.4%) and females with 2 vehicles (821,053, making up 45.8%).
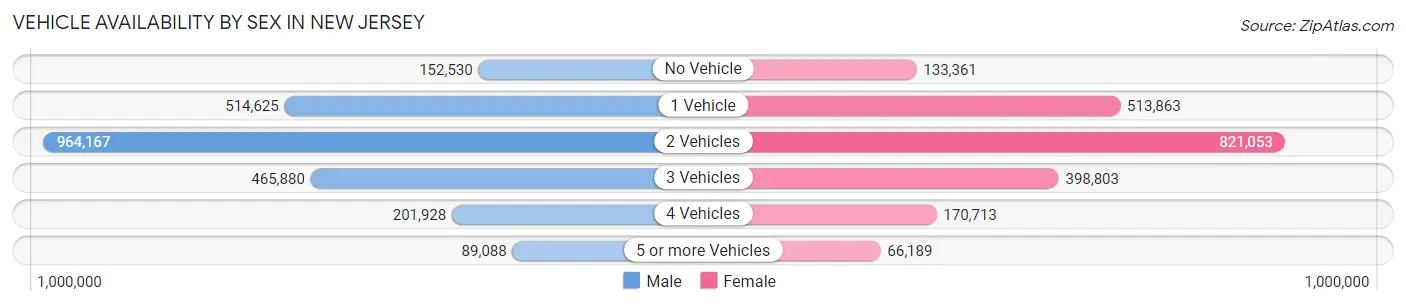
| Vehicles Available | Male | Female |
| No Vehicle | 152,530 (6.4%) | 133,361 (6.3%) |
| 1 Vehicle | 514,625 (21.5%) | 513,863 (24.4%) |
| 2 Vehicles | 964,167 (40.4%) | 821,053 (39.0%) |
| 3 Vehicles | 465,880 (19.5%) | 398,803 (19.0%) |
| 4 Vehicles | 201,928 (8.5%) | 170,713 (8.1%) |
| 5 or more Vehicles | 89,088 (3.7%) | 66,189 (3.2%) |
| Total | 2,388,218 (100.0%) | 2,103,982 (100.0%) |
Commute Time in New Jersey
The most frequently occuring commute durations in New Jersey are 30 to 34 minutes (538,403 commuters, 13.7%), 15 to 19 minutes (508,824 commuters, 13.0%), and 20 to 24 minutes (504,982 commuters, 12.9%).
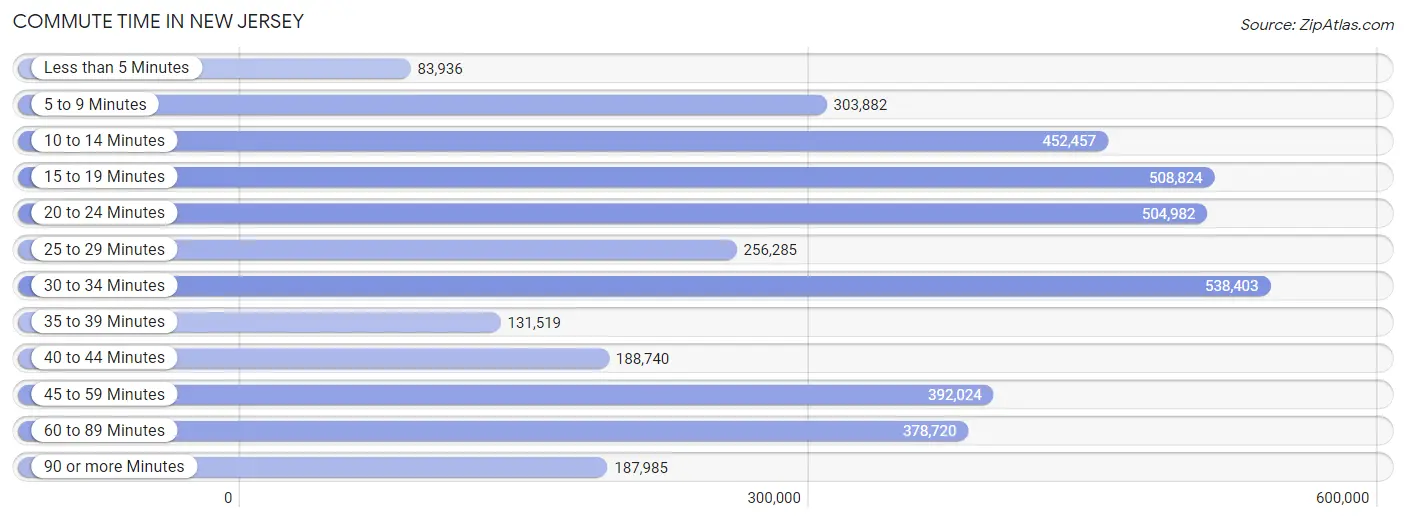
| Commute Time | # Commuters | % Commuters |
| Less than 5 Minutes | 83,936 | 2.1% |
| 5 to 9 Minutes | 303,882 | 7.7% |
| 10 to 14 Minutes | 452,457 | 11.5% |
| 15 to 19 Minutes | 508,824 | 13.0% |
| 20 to 24 Minutes | 504,982 | 12.9% |
| 25 to 29 Minutes | 256,285 | 6.5% |
| 30 to 34 Minutes | 538,403 | 13.7% |
| 35 to 39 Minutes | 131,519 | 3.4% |
| 40 to 44 Minutes | 188,740 | 4.8% |
| 45 to 59 Minutes | 392,024 | 10.0% |
| 60 to 89 Minutes | 378,720 | 9.6% |
| 90 or more Minutes | 187,985 | 4.8% |
Commute Time by Sex in New Jersey
The most common commute times in New Jersey are 30 to 34 minutes (295,320 commuters, 14.0%) for males and 15 to 19 minutes (255,242 commuters, 14.0%) for females.
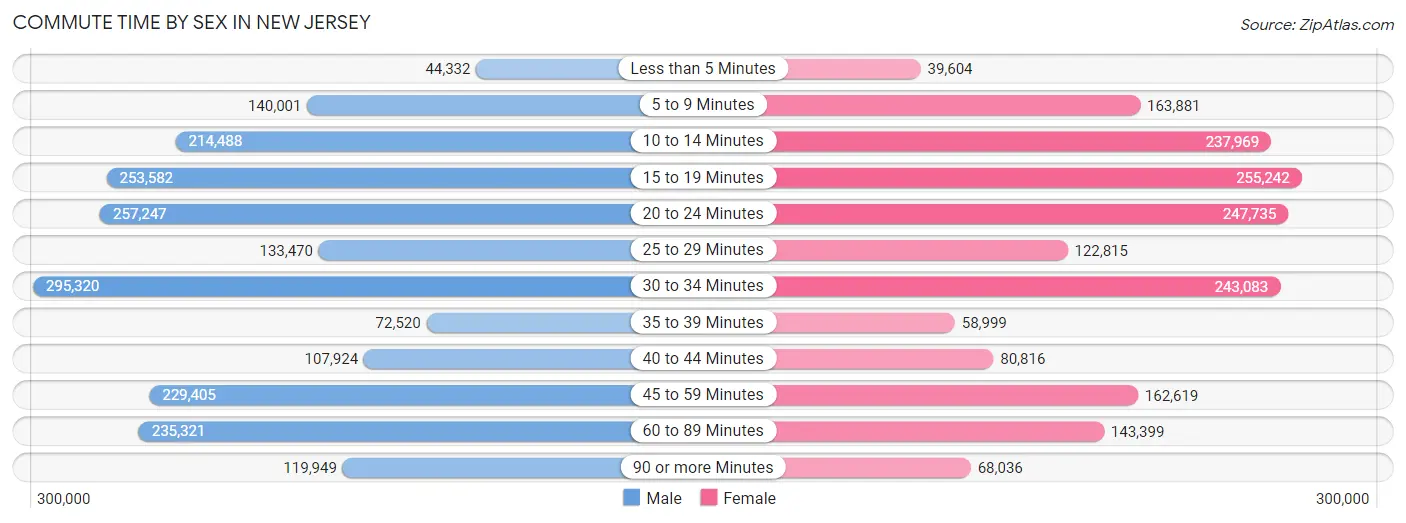
| Commute Time | Male | Female |
| Less than 5 Minutes | 44,332 (2.1%) | 39,604 (2.2%) |
| 5 to 9 Minutes | 140,001 (6.7%) | 163,881 (9.0%) |
| 10 to 14 Minutes | 214,488 (10.2%) | 237,969 (13.1%) |
| 15 to 19 Minutes | 253,582 (12.0%) | 255,242 (14.0%) |
| 20 to 24 Minutes | 257,247 (12.2%) | 247,735 (13.6%) |
| 25 to 29 Minutes | 133,470 (6.3%) | 122,815 (6.7%) |
| 30 to 34 Minutes | 295,320 (14.0%) | 243,083 (13.3%) |
| 35 to 39 Minutes | 72,520 (3.5%) | 58,999 (3.2%) |
| 40 to 44 Minutes | 107,924 (5.1%) | 80,816 (4.4%) |
| 45 to 59 Minutes | 229,405 (10.9%) | 162,619 (8.9%) |
| 60 to 89 Minutes | 235,321 (11.2%) | 143,399 (7.9%) |
| 90 or more Minutes | 119,949 (5.7%) | 68,036 (3.7%) |
Time of Departure to Work by Sex in New Jersey
The most frequent times of departure to work in New Jersey are 7:00 AM to 7:29 AM (298,397, 14.2%) for males and 8:00 AM to 8:29 AM (303,007, 16.6%) for females.
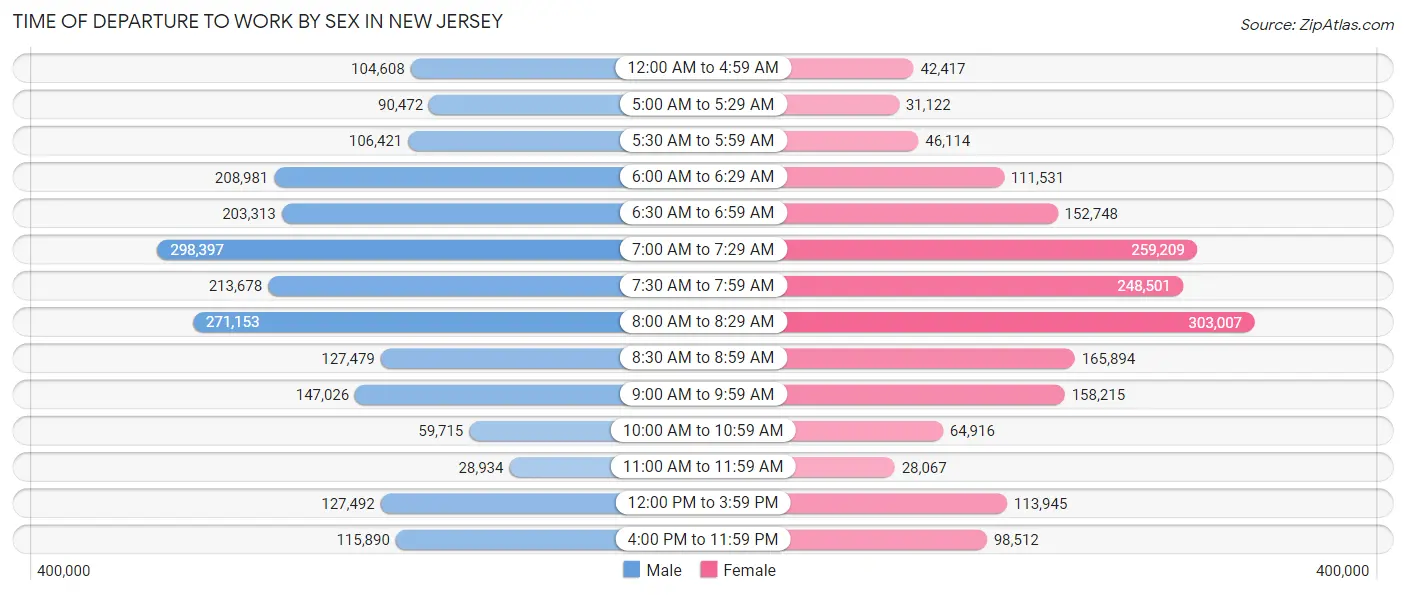
| Time of Departure | Male | Female |
| 12:00 AM to 4:59 AM | 104,608 (5.0%) | 42,417 (2.3%) |
| 5:00 AM to 5:29 AM | 90,472 (4.3%) | 31,122 (1.7%) |
| 5:30 AM to 5:59 AM | 106,421 (5.1%) | 46,114 (2.5%) |
| 6:00 AM to 6:29 AM | 208,981 (9.9%) | 111,531 (6.1%) |
| 6:30 AM to 6:59 AM | 203,313 (9.7%) | 152,748 (8.4%) |
| 7:00 AM to 7:29 AM | 298,397 (14.2%) | 259,209 (14.2%) |
| 7:30 AM to 7:59 AM | 213,678 (10.2%) | 248,501 (13.6%) |
| 8:00 AM to 8:29 AM | 271,153 (12.9%) | 303,007 (16.6%) |
| 8:30 AM to 8:59 AM | 127,479 (6.1%) | 165,894 (9.1%) |
| 9:00 AM to 9:59 AM | 147,026 (7.0%) | 158,215 (8.7%) |
| 10:00 AM to 10:59 AM | 59,715 (2.8%) | 64,916 (3.6%) |
| 11:00 AM to 11:59 AM | 28,934 (1.4%) | 28,067 (1.5%) |
| 12:00 PM to 3:59 PM | 127,492 (6.1%) | 113,945 (6.2%) |
| 4:00 PM to 11:59 PM | 115,890 (5.5%) | 98,512 (5.4%) |
| Total | 2,103,559 (100.0%) | 1,824,198 (100.0%) |
Housing Occupancy in New Jersey
Occupancy by Ownership in New Jersey
Of the total 3,438,162 dwellings in New Jersey, owner-occupied units account for 2,195,831 (63.9%), while renter-occupied units make up 1,242,331 (36.1%).
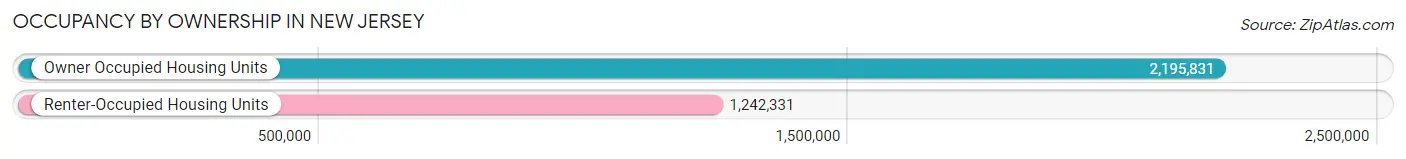
| Occupancy | # Housing Units | % Housing Units |
| Owner Occupied Housing Units | 2,195,831 | 63.9% |
| Renter-Occupied Housing Units | 1,242,331 | 36.1% |
| Total Occupied Housing Units | 3,438,162 | 100.0% |
Occupancy by Household Size in New Jersey
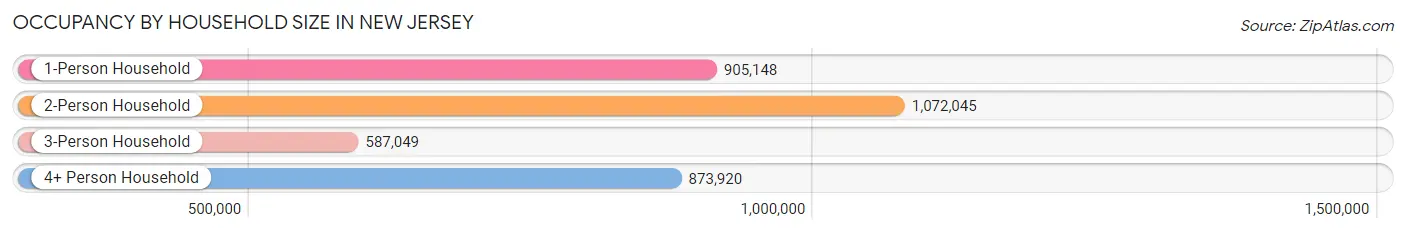
| Household Size | # Housing Units | % Housing Units |
| 1-Person Household | 905,148 | 26.3% |
| 2-Person Household | 1,072,045 | 31.2% |
| 3-Person Household | 587,049 | 17.1% |
| 4+ Person Household | 873,920 | 25.4% |
| Total Housing Units | 3,438,162 | 100.0% |
Occupancy by Ownership by Household Size in New Jersey
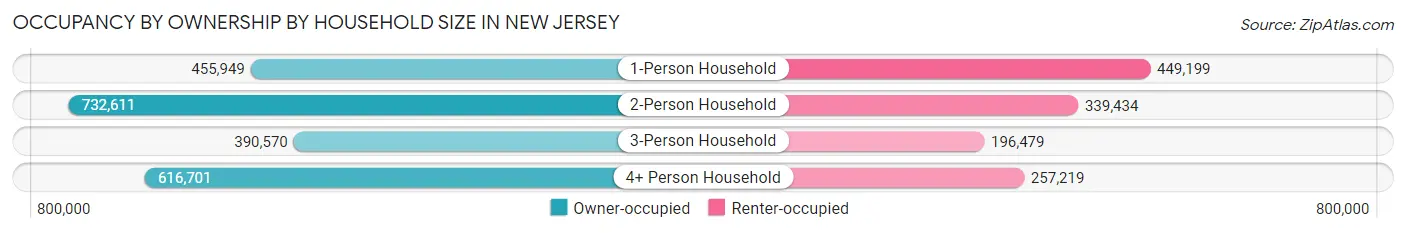
| Household Size | Owner-occupied | Renter-occupied |
| 1-Person Household | 455,949 (50.4%) | 449,199 (49.6%) |
| 2-Person Household | 732,611 (68.3%) | 339,434 (31.7%) |
| 3-Person Household | 390,570 (66.5%) | 196,479 (33.5%) |
| 4+ Person Household | 616,701 (70.6%) | 257,219 (29.4%) |
| Total Housing Units | 2,195,831 (63.9%) | 1,242,331 (36.1%) |
Occupancy by Educational Attainment in New Jersey
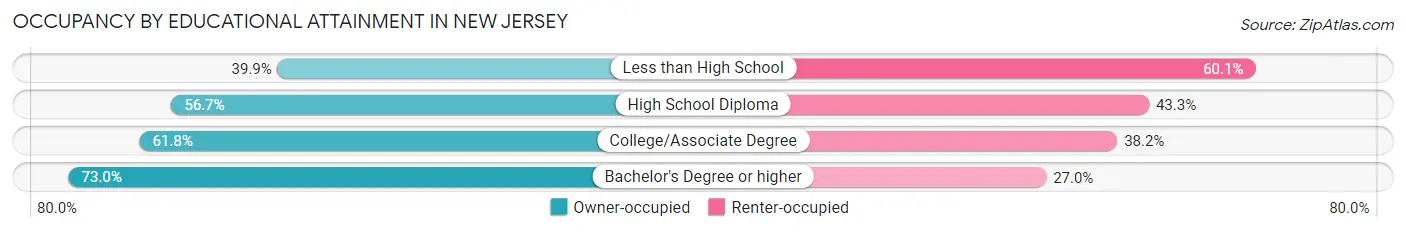
| Household Size | Owner-occupied | Renter-occupied |
| Less than High School | 110,856 (39.9%) | 167,132 (60.1%) |
| High School Diploma | 458,943 (56.7%) | 350,117 (43.3%) |
| College/Associate Degree | 498,672 (61.8%) | 308,660 (38.2%) |
| Bachelor's Degree or higher | 1,127,360 (73.0%) | 416,422 (27.0%) |
Occupancy by Age of Householder in New Jersey
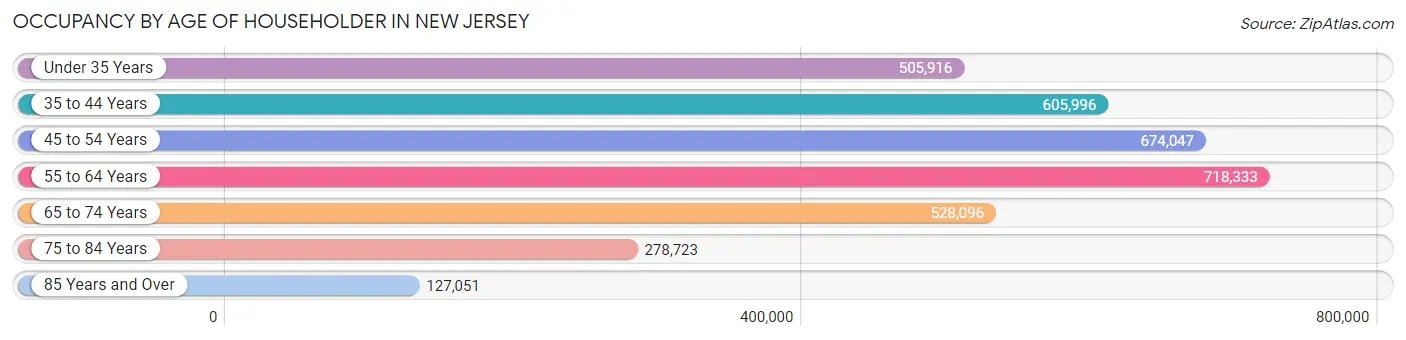
| Age Bracket | # Households | % Households |
| Under 35 Years | 505,916 | 14.7% |
| 35 to 44 Years | 605,996 | 17.6% |
| 45 to 54 Years | 674,047 | 19.6% |
| 55 to 64 Years | 718,333 | 20.9% |
| 65 to 74 Years | 528,096 | 15.4% |
| 75 to 84 Years | 278,723 | 8.1% |
| 85 Years and Over | 127,051 | 3.7% |
| Total | 3,438,162 | 100.0% |
Housing Finances in New Jersey
Median Income by Occupancy in New Jersey
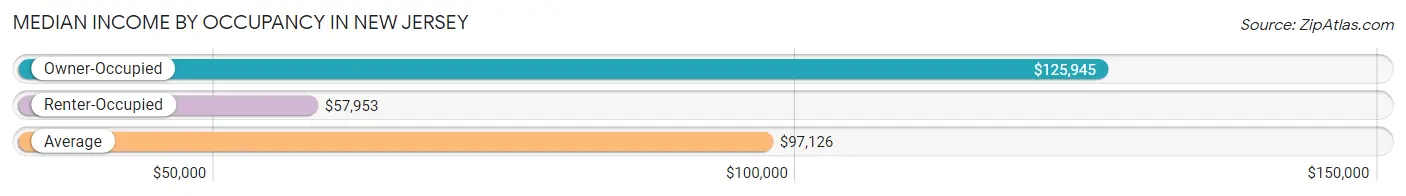
| Occupancy Type | # Households | Median Income |
| Owner-Occupied | 2,195,831 (63.9%) | $125,945 |
| Renter-Occupied | 1,242,331 (36.1%) | $57,953 |
| Average | 3,438,162 (100.0%) | $97,126 |
Occupancy by Householder Income Bracket in New Jersey
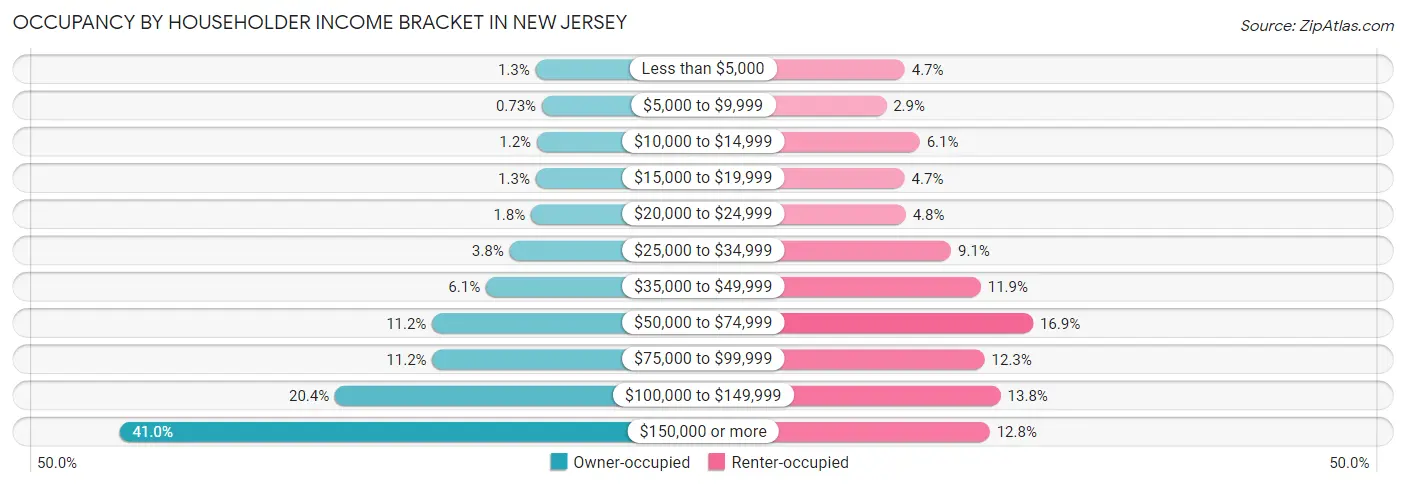
| Income Bracket | Owner-occupied | Renter-occupied |
| Less than $5,000 | 29,336 (1.3%) | 58,212 (4.7%) |
| $5,000 to $9,999 | 16,121 (0.7%) | 36,251 (2.9%) |
| $10,000 to $14,999 | 26,642 (1.2%) | 75,966 (6.1%) |
| $15,000 to $19,999 | 29,087 (1.3%) | 58,118 (4.7%) |
| $20,000 to $24,999 | 38,930 (1.8%) | 59,341 (4.8%) |
| $25,000 to $34,999 | 83,962 (3.8%) | 113,036 (9.1%) |
| $35,000 to $49,999 | 133,065 (6.1%) | 148,199 (11.9%) |
| $50,000 to $74,999 | 245,573 (11.2%) | 209,970 (16.9%) |
| $75,000 to $99,999 | 244,986 (11.2%) | 152,744 (12.3%) |
| $100,000 to $149,999 | 448,662 (20.4%) | 171,673 (13.8%) |
| $150,000 or more | 899,467 (41.0%) | 158,821 (12.8%) |
| Total | 2,195,831 (100.0%) | 1,242,331 (100.0%) |
Monthly Housing Cost Tiers in New Jersey
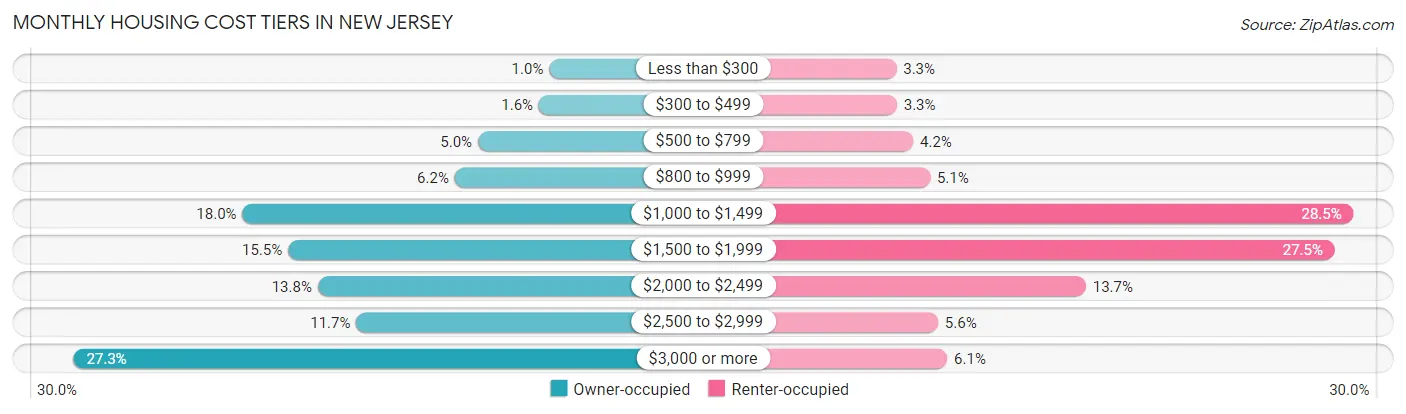
| Monthly Cost | Owner-occupied | Renter-occupied |
| Less than $300 | 22,352 (1.0%) | 40,317 (3.3%) |
| $300 to $499 | 34,833 (1.6%) | 40,759 (3.3%) |
| $500 to $799 | 108,922 (5.0%) | 51,982 (4.2%) |
| $800 to $999 | 137,084 (6.2%) | 63,438 (5.1%) |
| $1,000 to $1,499 | 394,498 (18.0%) | 354,149 (28.5%) |
| $1,500 to $1,999 | 339,191 (15.4%) | 341,267 (27.5%) |
| $2,000 to $2,499 | 303,182 (13.8%) | 170,508 (13.7%) |
| $2,500 to $2,999 | 256,414 (11.7%) | 69,000 (5.6%) |
| $3,000 or more | 599,355 (27.3%) | 75,240 (6.1%) |
| Total | 2,195,831 (100.0%) | 1,242,331 (100.0%) |
Physical Housing Characteristics in New Jersey
Housing Structures in New Jersey
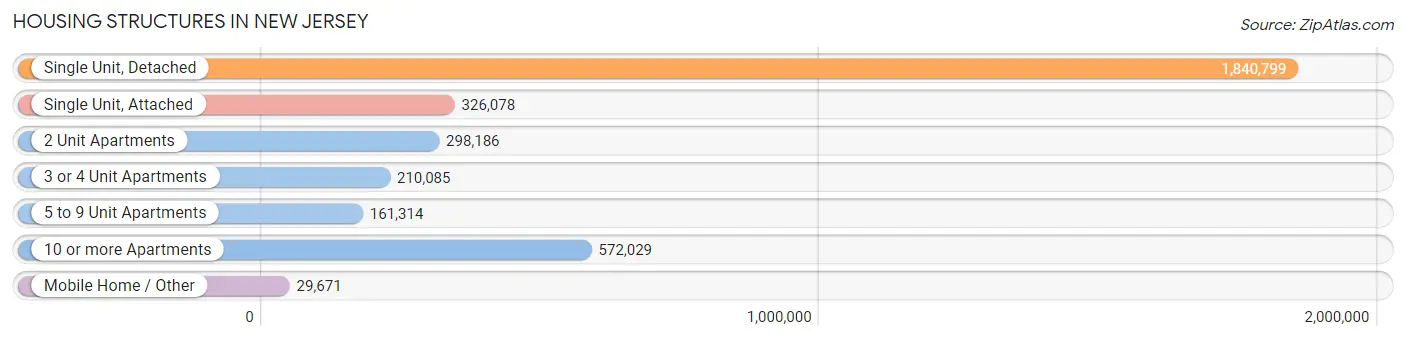
| Structure Type | # Housing Units | % Housing Units |
| Single Unit, Detached | 1,840,799 | 53.5% |
| Single Unit, Attached | 326,078 | 9.5% |
| 2 Unit Apartments | 298,186 | 8.7% |
| 3 or 4 Unit Apartments | 210,085 | 6.1% |
| 5 to 9 Unit Apartments | 161,314 | 4.7% |
| 10 or more Apartments | 572,029 | 16.6% |
| Mobile Home / Other | 29,671 | 0.9% |
| Total | 3,438,162 | 100.0% |
Housing Structures by Occupancy in New Jersey
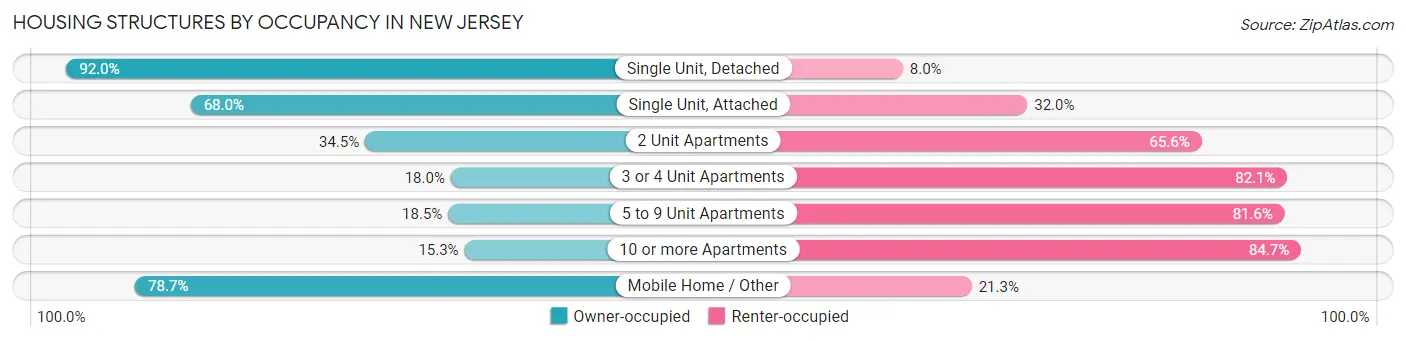
| Structure Type | Owner-occupied | Renter-occupied |
| Single Unit, Detached | 1,692,915 (92.0%) | 147,884 (8.0%) |
| Single Unit, Attached | 221,769 (68.0%) | 104,309 (32.0%) |
| 2 Unit Apartments | 102,737 (34.4%) | 195,449 (65.5%) |
| 3 or 4 Unit Apartments | 37,716 (17.9%) | 172,369 (82.1%) |
| 5 to 9 Unit Apartments | 29,769 (18.4%) | 131,545 (81.6%) |
| 10 or more Apartments | 87,572 (15.3%) | 484,457 (84.7%) |
| Mobile Home / Other | 23,353 (78.7%) | 6,318 (21.3%) |
| Total | 2,195,831 (63.9%) | 1,242,331 (36.1%) |
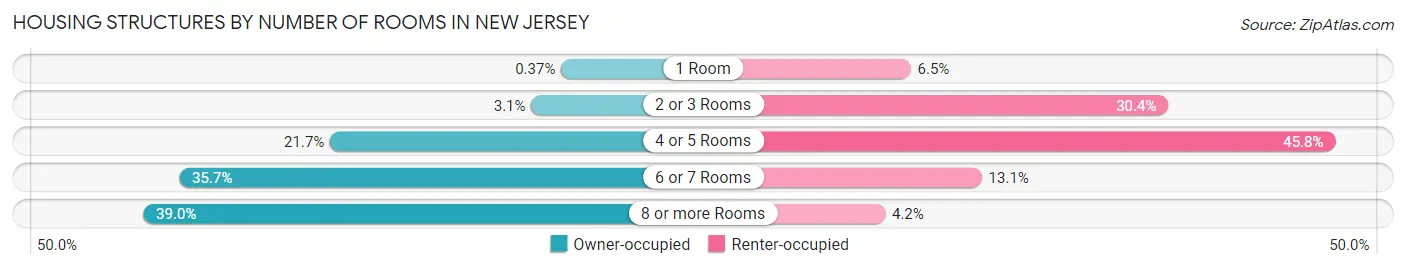
Housing Structures by Number of Rooms in New Jersey
| Number of Rooms | Owner-occupied | Renter-occupied |
| 1 Room | 8,039 (0.4%) | 81,293 (6.5%) |
| 2 or 3 Rooms | 68,838 (3.1%) | 377,196 (30.4%) |
| 4 or 5 Rooms | 477,272 (21.7%) | 569,224 (45.8%) |
| 6 or 7 Rooms | 784,429 (35.7%) | 162,861 (13.1%) |
| 8 or more Rooms | 857,253 (39.0%) | 51,757 (4.2%) |
| Total | 2,195,831 (100.0%) | 1,242,331 (100.0%) |
Housing Structure by Heating Type in New Jersey
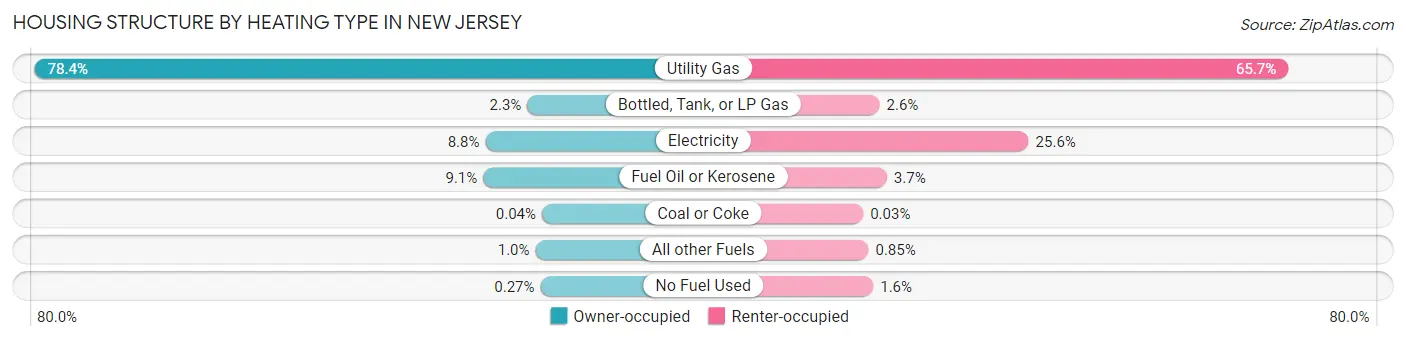
| Heating Type | Owner-occupied | Renter-occupied |
| Utility Gas | 1,722,467 (78.4%) | 816,103 (65.7%) |
| Bottled, Tank, or LP Gas | 50,796 (2.3%) | 31,754 (2.6%) |
| Electricity | 192,810 (8.8%) | 317,983 (25.6%) |
| Fuel Oil or Kerosene | 200,161 (9.1%) | 45,887 (3.7%) |
| Coal or Coke | 846 (0.0%) | 398 (0.0%) |
| All other Fuels | 22,857 (1.0%) | 10,517 (0.9%) |
| No Fuel Used | 5,894 (0.3%) | 19,689 (1.6%) |
| Total | 2,195,831 (100.0%) | 1,242,331 (100.0%) |
Household Vehicle Usage in New Jersey
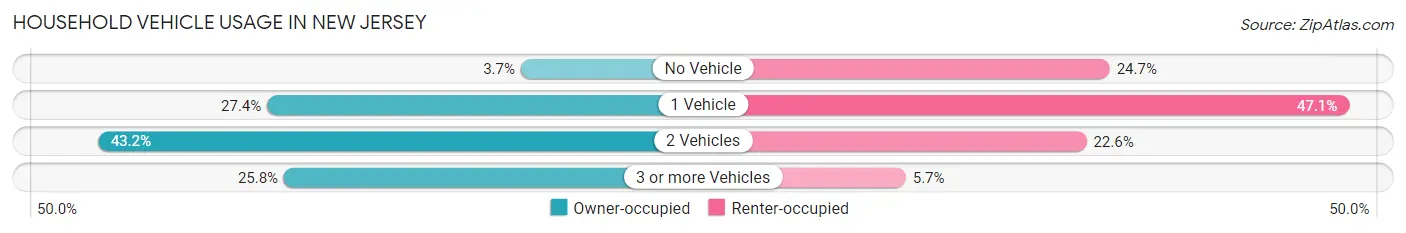
| Vehicles per Household | Owner-occupied | Renter-occupied |
| No Vehicle | 80,750 (3.7%) | 307,052 (24.7%) |
| 1 Vehicle | 600,887 (27.4%) | 584,601 (47.1%) |
| 2 Vehicles | 947,836 (43.2%) | 280,097 (22.6%) |
| 3 or more Vehicles | 566,358 (25.8%) | 70,581 (5.7%) |
| Total | 2,195,831 (100.0%) | 1,242,331 (100.0%) |
Real Estate & Mortgages in New Jersey
Real Estate and Mortgage Overview in New Jersey
| Characteristic | Without Mortgage | With Mortgage |
| Housing Units | 774,422 | 1,421,409 |
| Median Property Value | $379,700 | $413,900 |
| Median Household Income | $93,185 | $675,117 |
| Monthly Housing Costs | $1,175 | $581,756 |
| Real Estate Taxes | $9,024 | $24,098 |
Property Value by Mortgage Status in New Jersey
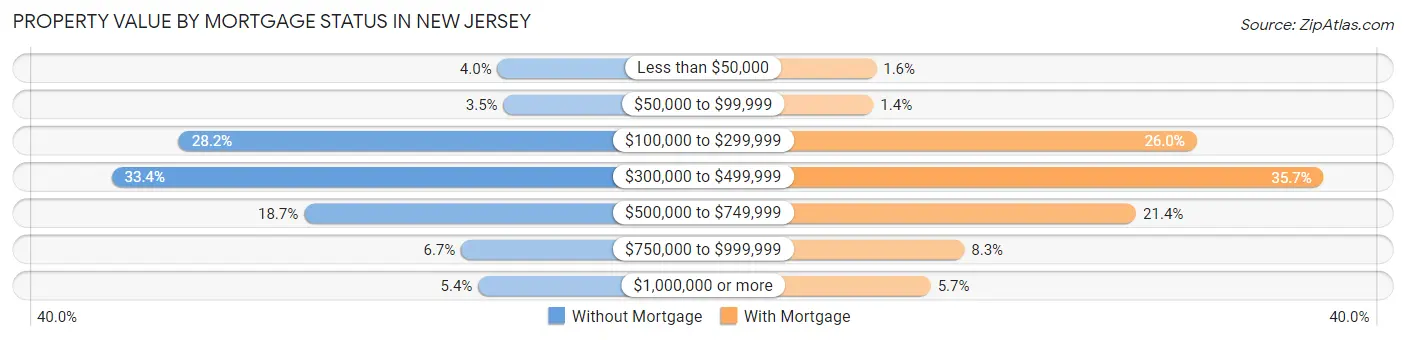
| Property Value | Without Mortgage | With Mortgage |
| Less than $50,000 | 30,775 (4.0%) | 22,447 (1.6%) |
| $50,000 to $99,999 | 27,273 (3.5%) | 19,313 (1.4%) |
| $100,000 to $299,999 | 218,681 (28.2%) | 369,488 (26.0%) |
| $300,000 to $499,999 | 258,458 (33.4%) | 506,891 (35.7%) |
| $500,000 to $749,999 | 144,897 (18.7%) | 303,881 (21.4%) |
| $750,000 to $999,999 | 52,217 (6.7%) | 117,878 (8.3%) |
| $1,000,000 or more | 42,121 (5.4%) | 81,511 (5.7%) |
| Total | 774,422 (100.0%) | 1,421,409 (100.0%) |
Household Income by Mortgage Status in New Jersey
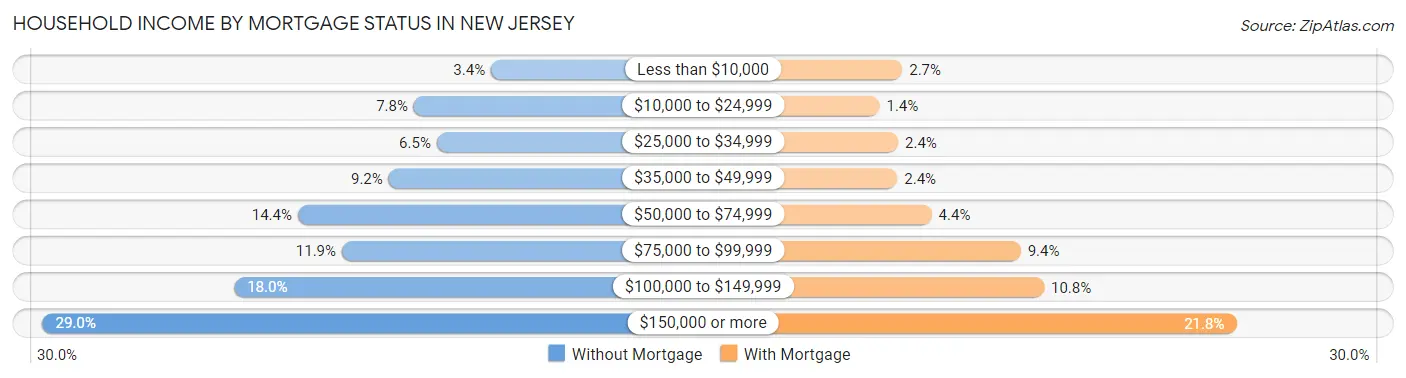
| Household Income | Without Mortgage | With Mortgage |
| Less than $10,000 | 25,934 (3.4%) | 37,959 (2.7%) |
| $10,000 to $24,999 | 60,069 (7.8%) | 19,523 (1.4%) |
| $25,000 to $34,999 | 49,981 (6.5%) | 34,590 (2.4%) |
| $35,000 to $49,999 | 71,212 (9.2%) | 33,981 (2.4%) |
| $50,000 to $74,999 | 111,444 (14.4%) | 61,853 (4.3%) |
| $75,000 to $99,999 | 91,906 (11.9%) | 134,129 (9.4%) |
| $100,000 to $149,999 | 139,526 (18.0%) | 153,080 (10.8%) |
| $150,000 or more | 224,350 (29.0%) | 309,136 (21.7%) |
| Total | 774,422 (100.0%) | 1,421,409 (100.0%) |
Property Value to Household Income Ratio in New Jersey
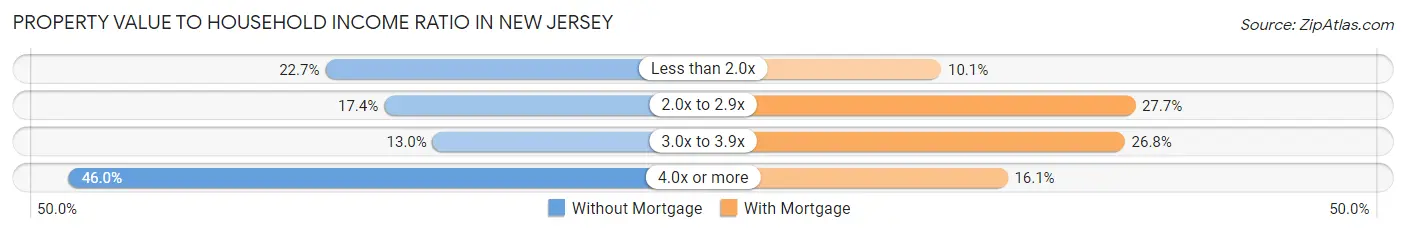
| Value-to-Income Ratio | Without Mortgage | With Mortgage |
| Less than 2.0x | 175,820 (22.7%) | 143,426 (10.1%) |
| 2.0x to 2.9x | 134,415 (17.4%) | 393,767 (27.7%) |
| 3.0x to 3.9x | 100,285 (13.0%) | 380,374 (26.8%) |
| 4.0x or more | 356,187 (46.0%) | 229,197 (16.1%) |
| Total | 774,422 (100.0%) | 1,421,409 (100.0%) |
Real Estate Taxes by Mortgage Status in New Jersey
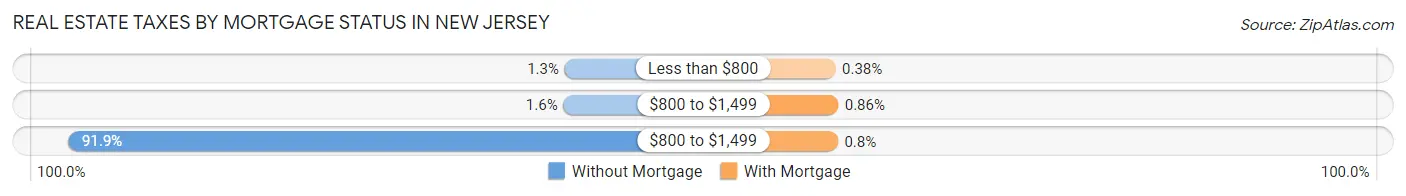
| Property Taxes | Without Mortgage | With Mortgage |
| Less than $800 | 10,322 (1.3%) | 5,419 (0.4%) |
| $800 to $1,499 | 12,177 (1.6%) | 12,216 (0.9%) |
| $800 to $1,499 | 711,676 (91.9%) | 11,350 (0.8%) |
| Total | 774,422 (100.0%) | 1,421,409 (100.0%) |
Health & Disability in New Jersey
Health Insurance Coverage by Age in New Jersey
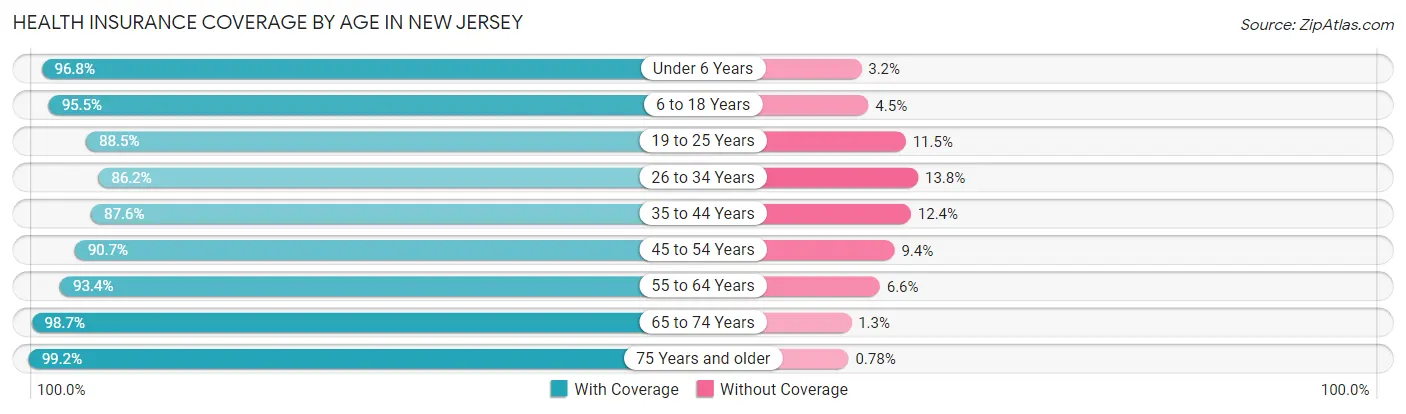
| Age Bracket | With Coverage | Without Coverage |
| Under 6 Years | 610,909 (96.8%) | 20,004 (3.2%) |
| 6 to 18 Years | 1,436,885 (95.5%) | 67,639 (4.5%) |
| 19 to 25 Years | 699,471 (88.5%) | 90,572 (11.5%) |
| 26 to 34 Years | 910,450 (86.2%) | 145,240 (13.8%) |
| 35 to 44 Years | 1,042,594 (87.6%) | 147,748 (12.4%) |
| 45 to 54 Years | 1,113,214 (90.6%) | 114,877 (9.3%) |
| 55 to 64 Years | 1,175,046 (93.4%) | 83,354 (6.6%) |
| 65 to 74 Years | 860,465 (98.7%) | 11,237 (1.3%) |
| 75 Years and older | 619,155 (99.2%) | 4,896 (0.8%) |
| Total | 8,468,189 (92.5%) | 685,567 (7.5%) |
Health Insurance Coverage by Citizenship Status in New Jersey
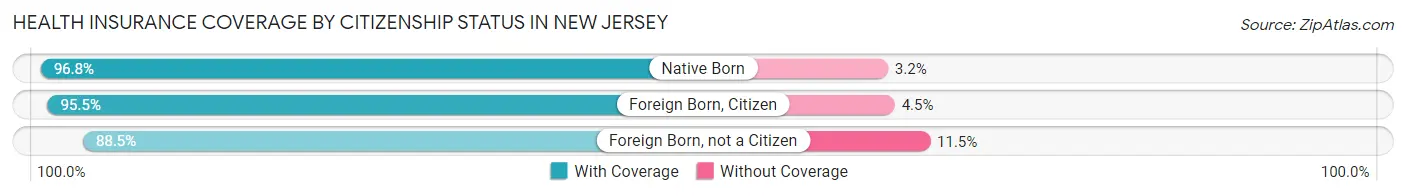
| Citizenship Status | With Coverage | Without Coverage |
| Native Born | 610,909 (96.8%) | 20,004 (3.2%) |
| Foreign Born, Citizen | 1,436,885 (95.5%) | 67,639 (4.5%) |
| Foreign Born, not a Citizen | 699,471 (88.5%) | 90,572 (11.5%) |
Health Insurance Coverage by Household Income in New Jersey
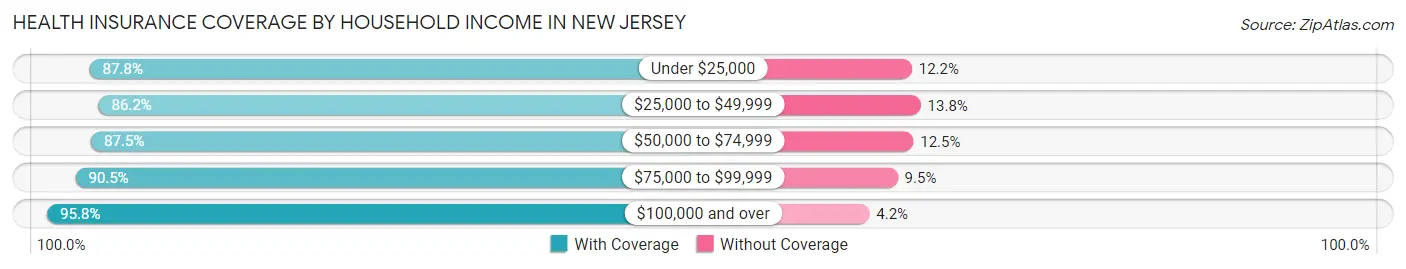
| Household Income | With Coverage | Without Coverage |
| Under $25,000 | 656,790 (87.8%) | 91,072 (12.2%) |
| $25,000 to $49,999 | 878,103 (86.2%) | 141,041 (13.8%) |
| $50,000 to $74,999 | 930,622 (87.5%) | 132,518 (12.5%) |
| $75,000 to $99,999 | 906,470 (90.5%) | 95,496 (9.5%) |
| $100,000 and over | 5,008,206 (95.8%) | 221,376 (4.2%) |
Public vs Private Health Insurance Coverage by Age in New Jersey
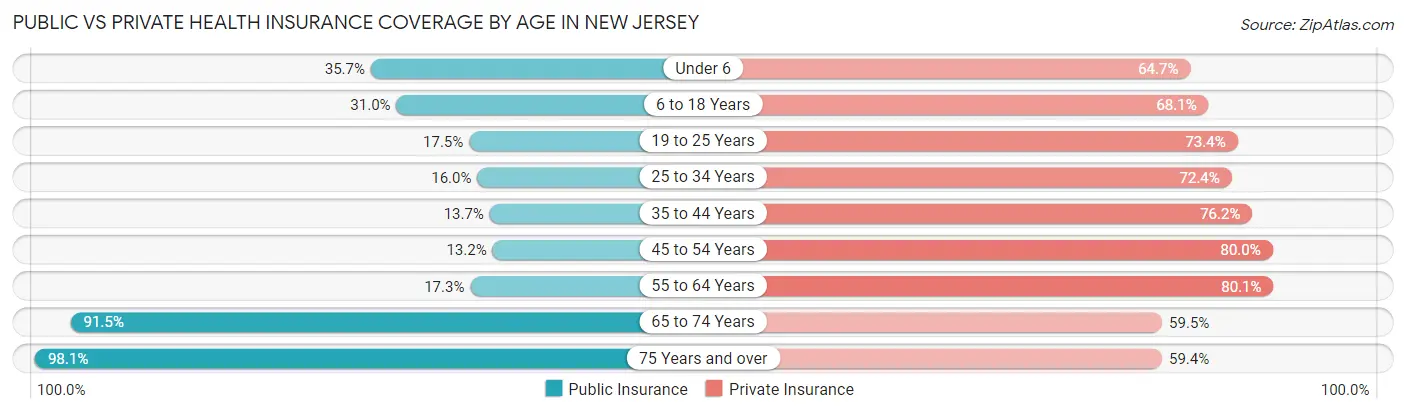
| Age Bracket | Public Insurance | Private Insurance |
| Under 6 | 225,490 (35.7%) | 408,033 (64.7%) |
| 6 to 18 Years | 466,185 (31.0%) | 1,023,979 (68.1%) |
| 19 to 25 Years | 138,148 (17.5%) | 580,212 (73.4%) |
| 25 to 34 Years | 168,687 (16.0%) | 763,828 (72.4%) |
| 35 to 44 Years | 162,746 (13.7%) | 906,817 (76.2%) |
| 45 to 54 Years | 161,521 (13.2%) | 981,879 (79.9%) |
| 55 to 64 Years | 217,475 (17.3%) | 1,008,029 (80.1%) |
| 65 to 74 Years | 797,283 (91.5%) | 518,357 (59.5%) |
| 75 Years and over | 612,018 (98.1%) | 370,939 (59.4%) |
| Total | 2,949,553 (32.2%) | 6,562,073 (71.7%) |
Disability Status by Sex by Age in New Jersey
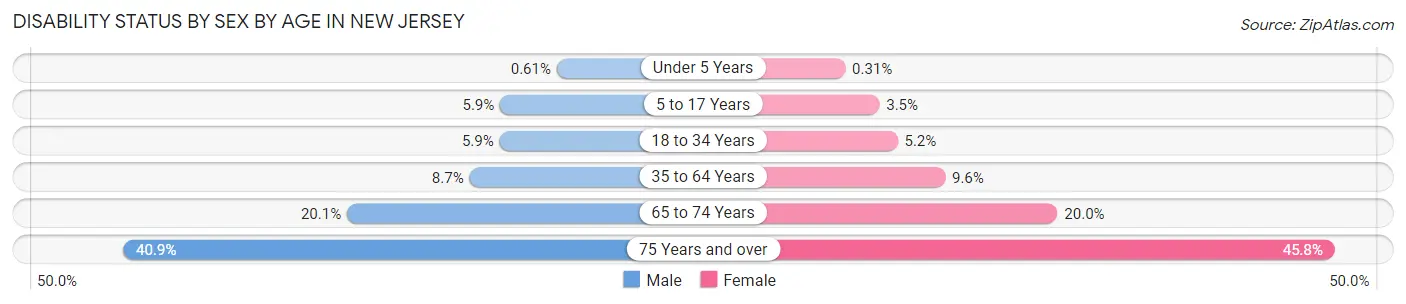
| Age Bracket | Male | Female |
| Under 5 Years | 1,639 (0.6%) | 782 (0.3%) |
| 5 to 17 Years | 44,744 (5.9%) | 25,374 (3.5%) |
| 18 to 34 Years | 58,877 (5.9%) | 50,233 (5.2%) |
| 35 to 64 Years | 157,908 (8.7%) | 178,460 (9.6%) |
| 65 to 74 Years | 81,301 (20.1%) | 93,419 (20.0%) |
| 75 Years and over | 102,023 (40.9%) | 171,279 (45.8%) |
Disability Class by Sex by Age in New Jersey
Disability Class: Hearing Difficulty
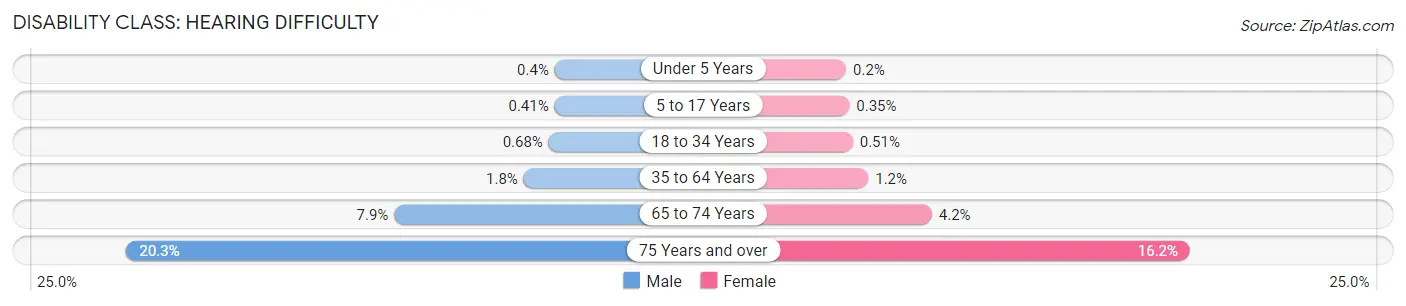
| Age Bracket | Male | Female |
| Under 5 Years | 1,069 (0.4%) | 509 (0.2%) |
| 5 to 17 Years | 3,098 (0.4%) | 2,575 (0.4%) |
| 18 to 34 Years | 6,788 (0.7%) | 4,945 (0.5%) |
| 35 to 64 Years | 33,291 (1.8%) | 22,971 (1.2%) |
| 65 to 74 Years | 31,767 (7.9%) | 19,516 (4.2%) |
| 75 Years and over | 50,628 (20.3%) | 60,449 (16.2%) |
Disability Class: Vision Difficulty
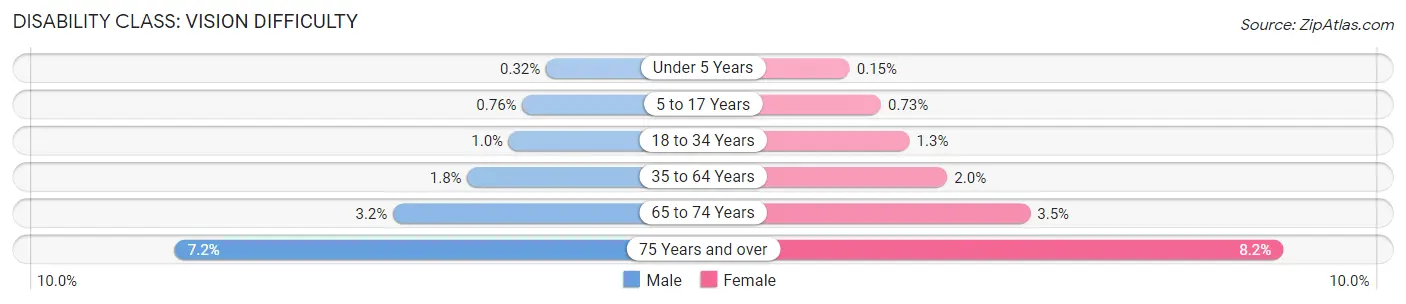
| Age Bracket | Male | Female |
| Under 5 Years | 863 (0.3%) | 391 (0.2%) |
| 5 to 17 Years | 5,811 (0.8%) | 5,324 (0.7%) |
| 18 to 34 Years | 10,063 (1.0%) | 12,299 (1.3%) |
| 35 to 64 Years | 32,192 (1.8%) | 36,471 (2.0%) |
| 65 to 74 Years | 12,794 (3.2%) | 16,319 (3.5%) |
| 75 Years and over | 18,009 (7.2%) | 30,645 (8.2%) |
Disability Class: Cognitive Difficulty
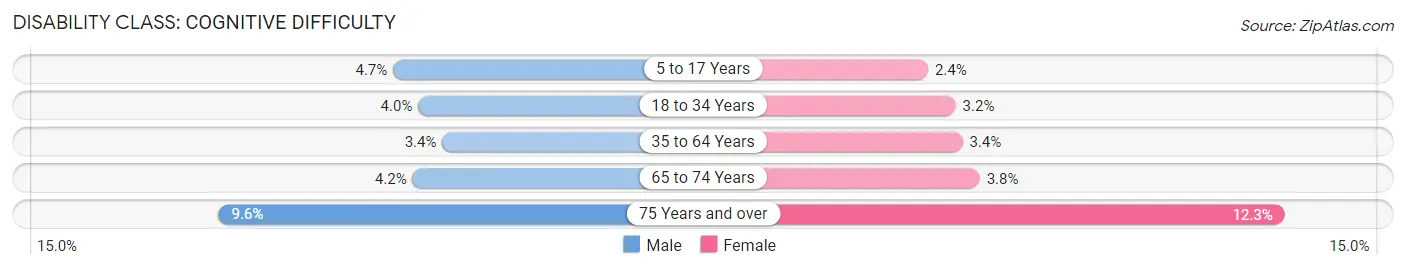
| Age Bracket | Male | Female |
| 5 to 17 Years | 36,155 (4.7%) | 17,491 (2.4%) |
| 18 to 34 Years | 40,183 (4.0%) | 30,812 (3.2%) |
| 35 to 64 Years | 61,173 (3.4%) | 62,616 (3.4%) |
| 65 to 74 Years | 17,025 (4.2%) | 17,948 (3.8%) |
| 75 Years and over | 23,961 (9.6%) | 46,173 (12.3%) |
Disability Class: Ambulatory Difficulty
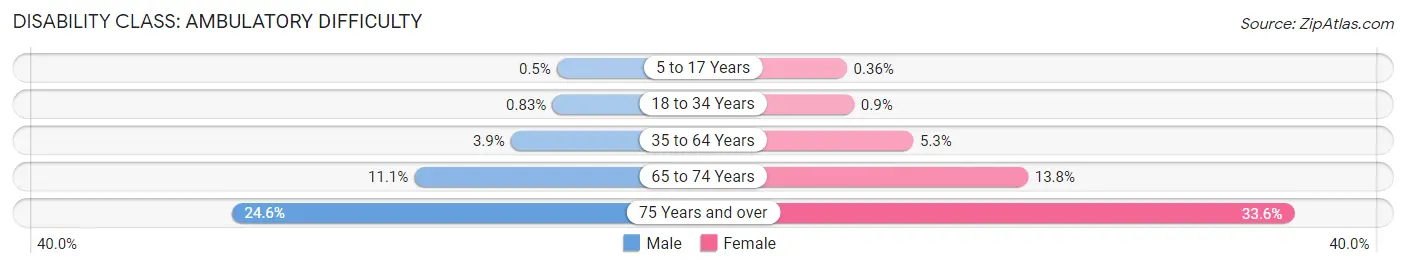
| Age Bracket | Male | Female |
| 5 to 17 Years | 3,808 (0.5%) | 2,601 (0.4%) |
| 18 to 34 Years | 8,256 (0.8%) | 8,739 (0.9%) |
| 35 to 64 Years | 71,076 (3.9%) | 98,500 (5.3%) |
| 65 to 74 Years | 44,850 (11.1%) | 64,463 (13.8%) |
| 75 Years and over | 61,496 (24.6%) | 125,718 (33.6%) |
Disability Class: Self-Care Difficulty
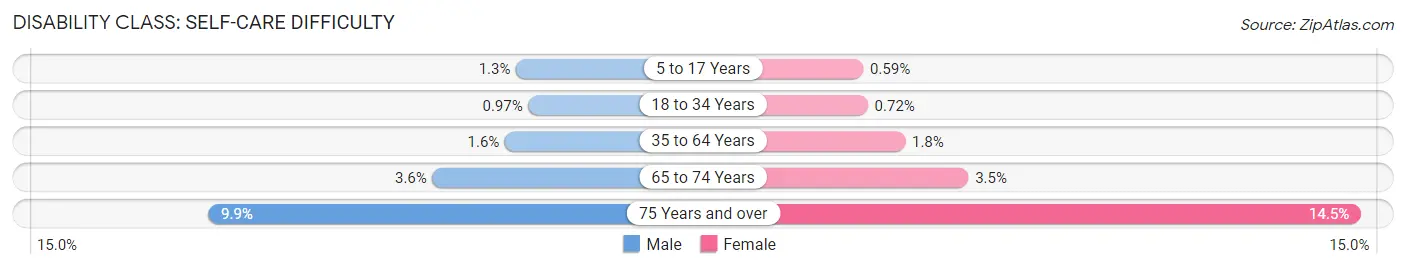
| Age Bracket | Male | Female |
| 5 to 17 Years | 9,954 (1.3%) | 4,323 (0.6%) |
| 18 to 34 Years | 9,655 (1.0%) | 6,983 (0.7%) |
| 35 to 64 Years | 29,322 (1.6%) | 32,806 (1.8%) |
| 65 to 74 Years | 14,718 (3.6%) | 16,452 (3.5%) |
| 75 Years and over | 24,705 (9.9%) | 54,137 (14.5%) |
Technology Access in New Jersey
Computing Device Access in New Jersey
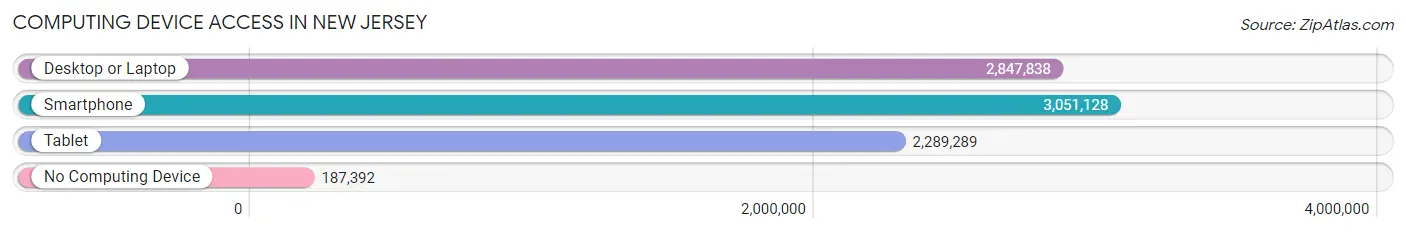
| Device Type | # Households | % Households |
| Desktop or Laptop | 2,847,838 | 82.8% |
| Smartphone | 3,051,128 | 88.7% |
| Tablet | 2,289,289 | 66.6% |
| No Computing Device | 187,392 | 5.4% |
| Total | 3,438,162 | 100.0% |
Internet Access in New Jersey
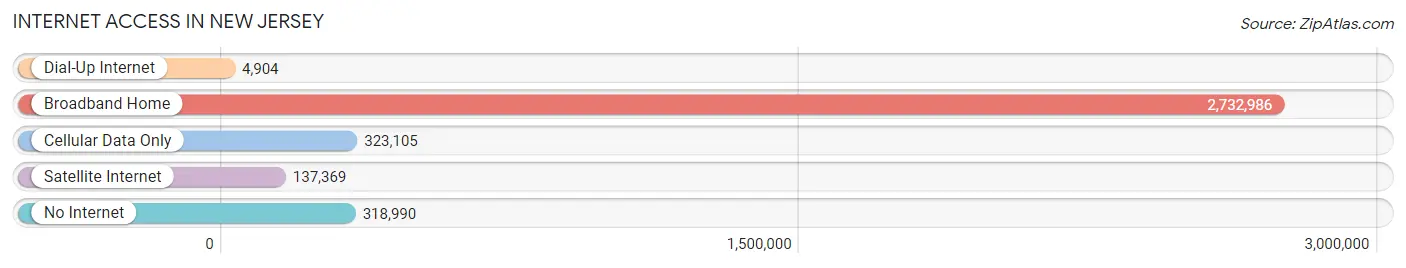
| Internet Type | # Households | % Households |
| Dial-Up Internet | 4,904 | 0.1% |
| Broadband Home | 2,732,986 | 79.5% |
| Cellular Data Only | 323,105 | 9.4% |
| Satellite Internet | 137,369 | 4.0% |
| No Internet | 318,990 | 9.3% |
| Total | 3,438,162 | 100.0% |
New Jersey Summary
New Jersey is a state located in the Northeastern and Mid-Atlantic regions of the United States. It is bordered by New York to the north and east, Pennsylvania to the west, and Delaware to the south. New Jersey is the fourth smallest state by area but the 11th most populous, with 8,882,190 residents as of 2019. It is the most densely populated state in the country.
History
The area that is now New Jersey was inhabited by Native Americans for thousands of years before the arrival of Europeans. The Lenape were the dominant tribe in the area, and their name for the region was "Scheyichbi," which means "land between the streams." The first Europeans to explore the area were the Dutch, who established a trading post in 1614. The Dutch colony of New Netherland was established in 1624, and the area that is now New Jersey was part of it. In 1664, the English took control of the colony and renamed it New Jersey after the Isle of Jersey in the English Channel.
The colony was divided into East and West Jersey in 1674, and the two were reunited in 1702. New Jersey was one of the original 13 colonies that declared independence from Britain in 1776. During the Revolutionary War, New Jersey was a major battleground, and the state was the site of several important battles, including the Battle of Trenton and the Battle of Princeton.
Geography
New Jersey is located in the Northeastern and Mid-Atlantic regions of the United States. It is bordered by New York to the north and east, Pennsylvania to the west, and Delaware to the south. The state has a total area of 8,722 square miles, making it the fourth smallest state by area.
New Jersey is divided into three distinct geographic regions. The northern part of the state is known as the Highlands, and it is characterized by rolling hills and valleys. The central part of the state is known as the Piedmont, and it is characterized by flat plains and rolling hills. The southern part of the state is known as the Atlantic Coastal Plain, and it is characterized by flat plains and sandy beaches.
Economy
New Jersey has a diverse economy that is driven by a variety of industries. The state is home to several major corporations, including Johnson & Johnson, Prudential Financial, and Merck & Co. The state is also home to several major ports, including the Port of Newark and the Port of Elizabeth.
The state's economy is also driven by tourism. New Jersey is home to several popular tourist destinations, including Atlantic City, the Jersey Shore, and the Delaware Water Gap National Recreation Area.
Demographics
As of 2019, New Jersey had a population of 8,882,190, making it the 11th most populous state in the country. The state is home to a diverse population, with the largest ethnic groups being White (66.2%), Hispanic or Latino (19.2%), and Black or African American (13.5%).
The median household income in New Jersey is $80,088, and the median home value is $323,400. The state has a poverty rate of 10.2%, and the unemployment rate is 4.2%.
New Jersey is home to several major cities, including Newark, Jersey City, and Paterson. The state capital is Trenton.
Common Questions
When was New Jersey Incorporated?
New Jersey was Incorporated into the Union on Dec 18, 1787.
What is the Total Area of New Jersey?
Total Area of New Jersey is 8,723 Square Miles.
What is the Total Land Area of New Jersey?
Total Land Area of New Jersey is 7,354 Square Miles.
What is the Total Water Area of New Jersey?
Total Water Area of New Jersey is 1,369 Square Miles.
What is the Average Elevation in New Jersey?
Average Elevation in New Jersey is 250 Feet.
What is the Highest Elevation in New Jersey?
Highest Elevation in New Jersey is 1,803 Feet.
What is the Lowest Elevation in New Jersey?
Lowest Elevation in New Jersey is 0 Feet.
What is the Population Density in New Jersey?
Population Density in New Jersey is 1,257.7 People per Square Mile.
What is Per Capita Income in New Jersey?
Per Capita income in New Jersey is $50,995.
What is the Median Family Income in New Jersey?
Median Family Income in New Jersey is $119,240.
What is the Median Household income in New Jersey?
Median Household Income in New Jersey is $97,126.
What is Income or Wage Gap in New Jersey?
Income or Wage Gap in New Jersey is 29.5%.
Women in New Jersey earn 70.5 cents for every dollar earned by a man.
What is Family Income Deficit in New Jersey?
Family Income Deficit in New Jersey is $10,841.
Families that are below poverty line in New Jersey earn $10,841 less on average than the poverty threshold level.
What is Inequality or Gini Index in New Jersey?
Inequality or Gini Index in New Jersey is 0.48.
What is the Total Population of New Jersey?
Total Population of New Jersey is 9,249,063.
What is the Total Male Population of New Jersey?
Total Male Population of New Jersey is 4,556,331.
What is the Total Female Population of New Jersey?
Total Female Population of New Jersey is 4,692,732.
What is the Ratio of Males per 100 Females in New Jersey?
There are 97.09 Males per 100 Females in New Jersey.
What is the Ratio of Females per 100 Males in New Jersey?
There are 102.99 Females per 100 Males in New Jersey.
What is the Median Population Age in New Jersey?
Median Population Age in New Jersey is 40.0 Years.
What is the Average Family Size in New Jersey
Average Family Size in New Jersey is 3.2 People.
What is the Average Household Size in New Jersey
Average Household Size in New Jersey is 2.6 People.
How Large is the Labor Force in New Jersey?
There are 4,939,850 People in the Labor Forcein in New Jersey.
What is the Percentage of People in the Labor Force in New Jersey?
66.1% of People are in the Labor Force in New Jersey.
What is the Unemployment Rate in New Jersey?
Unemployment Rate in New Jersey is 6.2%.