Cities with the Highest Poverty Level Among Females Between Ages 25 and 34 in California
RELATED REPORTS & OPTIONS
Highest Poverty | Female 25-34
California
Compare Cities
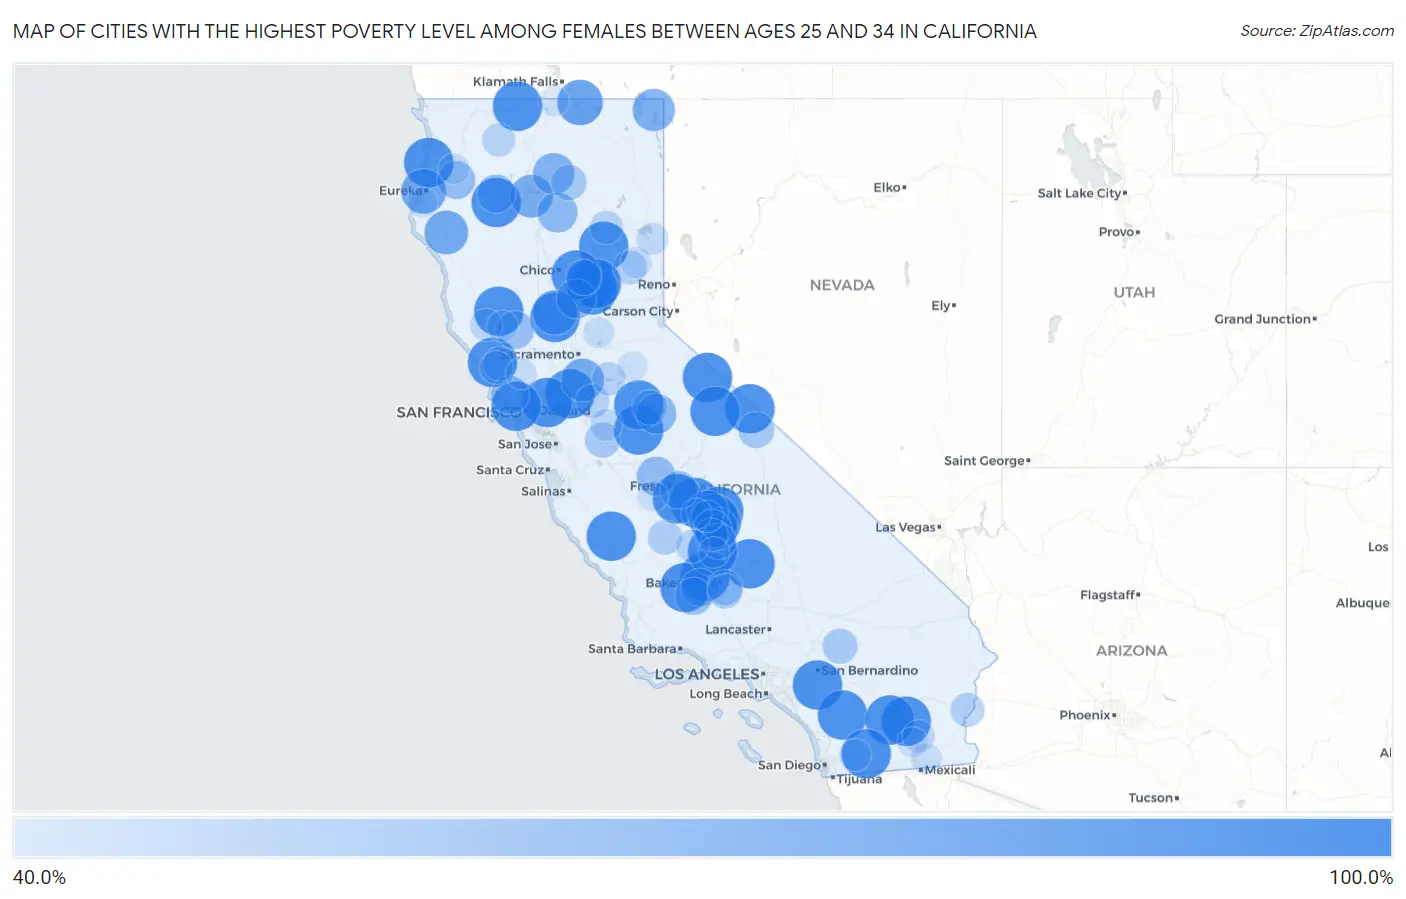
Map of Cities with the Highest Poverty Level Among Females Between Ages 25 and 34 in California
0.0%
100.0%
Cities with the Highest Poverty Level Among Females Between Ages 25 and 34 in California
| City | Female Poverty | vs State | vs National | |
| 1. | Lake Isabella | 100.0% | 12.7%(+87.3)#1 | 14.5%(+85.5)#1 |
| 2. | Bethel Island | 100.0% | 12.7%(+87.3)#2 | 14.5%(+85.5)#17 |
| 3. | March Arb | 100.0% | 12.7%(+87.3)#3 | 14.5%(+85.5)#63 |
| 4. | Douglas City | 100.0% | 12.7%(+87.3)#4 | 14.5%(+85.5)#70 |
| 5. | Shell Ridge | 100.0% | 12.7%(+87.3)#5 | 14.5%(+85.5)#74 |
| 6. | Delft Colony | 100.0% | 12.7%(+87.3)#6 | 14.5%(+85.5)#76 |
| 7. | Upper Lake | 100.0% | 12.7%(+87.3)#7 | 14.5%(+85.5)#90 |
| 8. | Challenge Brownsville | 100.0% | 12.7%(+87.3)#8 | 14.5%(+85.5)#101 |
| 9. | Monte Rio | 100.0% | 12.7%(+87.3)#9 | 14.5%(+85.5)#119 |
| 10. | San Ardo | 100.0% | 12.7%(+87.3)#10 | 14.5%(+85.5)#156 |
| 11. | Aguanga | 100.0% | 12.7%(+87.3)#11 | 14.5%(+85.5)#160 |
| 12. | Lemon Cove | 100.0% | 12.7%(+87.3)#12 | 14.5%(+85.5)#190 |
| 13. | Bridgeport | 100.0% | 12.7%(+87.3)#13 | 14.5%(+85.5)#217 |
| 14. | Muir Beach | 100.0% | 12.7%(+87.3)#14 | 14.5%(+85.5)#218 |
| 15. | Benton | 100.0% | 12.7%(+87.3)#15 | 14.5%(+85.5)#224 |
| 16. | Hornbrook | 100.0% | 12.7%(+87.3)#16 | 14.5%(+85.5)#233 |
| 17. | Forbestown | 100.0% | 12.7%(+87.3)#17 | 14.5%(+85.5)#239 |
| 18. | Grimes | 100.0% | 12.7%(+87.3)#18 | 14.5%(+85.5)#251 |
| 19. | Twain | 100.0% | 12.7%(+87.3)#19 | 14.5%(+85.5)#266 |
| 20. | Clipper Mills | 100.0% | 12.7%(+87.3)#20 | 14.5%(+85.5)#273 |
| 21. | June Lake | 100.0% | 12.7%(+87.3)#21 | 14.5%(+85.5)#279 |
| 22. | Bombay Beach | 100.0% | 12.7%(+87.3)#22 | 14.5%(+85.5)#324 |
| 23. | Cherokee | 100.0% | 12.7%(+87.3)#23 | 14.5%(+85.5)#360 |
| 24. | Monmouth | 100.0% | 12.7%(+87.3)#24 | 14.5%(+85.5)#363 |
| 25. | Salton Sea Beach | 100.0% | 12.7%(+87.3)#25 | 14.5%(+85.5)#383 |
| 26. | Snelling | 100.0% | 12.7%(+87.3)#26 | 14.5%(+85.5)#395 |
| 27. | Cherokee Strip | 100.0% | 12.7%(+87.3)#27 | 14.5%(+85.5)#402 |
| 28. | La Grange | 100.0% | 12.7%(+87.3)#28 | 14.5%(+85.5)#450 |
| 29. | Mount Laguna | 100.0% | 12.7%(+87.3)#30 | 14.5%(+85.5)#528 |
| 30. | Big Lagoon | 100.0% | 12.7%(+87.3)#31 | 14.5%(+85.5)#529 |
| 31. | Mckittrick | 100.0% | 12.7%(+87.3)#32 | 14.5%(+85.5)#555 |
| 32. | Weitchpec | 100.0% | 12.7%(+87.3)#33 | 14.5%(+85.5)#584 |
| 33. | El Rancho | 100.0% | 12.7%(+87.3)#34 | 14.5%(+85.5)#618 |
| 34. | Chinese Camp | 100.0% | 12.7%(+87.3)#35 | 14.5%(+85.5)#628 |
| 35. | Rodriguez Camp | 100.0% | 12.7%(+87.3)#36 | 14.5%(+85.5)#631 |
| 36. | Tooleville | 100.0% | 12.7%(+87.3)#37 | 14.5%(+85.5)#632 |
| 37. | Tulelake | 88.6% | 12.7%(+75.9)#38 | 14.5%(+74.1)#755 |
| 38. | Fairhaven | 86.7% | 12.7%(+73.9)#39 | 14.5%(+72.2)#783 |
| 39. | Meridian | 85.7% | 12.7%(+73.0)#40 | 14.5%(+71.2)#796 |
| 40. | Miranda | 83.3% | 12.7%(+70.6)#41 | 14.5%(+68.8)#844 |
| 41. | Strathmore | 81.9% | 12.7%(+69.2)#42 | 14.5%(+67.4)#881 |
| 42. | Mountain Gate | 80.9% | 12.7%(+68.1)#43 | 14.5%(+66.4)#903 |
| 43. | Thornton | 80.8% | 12.7%(+68.1)#44 | 14.5%(+66.3)#904 |
| 44. | Fort Bidwell | 78.9% | 12.7%(+66.2)#45 | 14.5%(+64.5)#959 |
| 45. | Ivanhoe | 76.9% | 12.7%(+64.2)#46 | 14.5%(+62.4)#1,010 |
| 46. | Big Bend | 76.9% | 12.7%(+64.2)#47 | 14.5%(+62.4)#1,021 |
| 47. | Greeley Hill | 73.0% | 12.7%(+60.3)#48 | 14.5%(+58.5)#1,116 |
| 48. | Shingletown | 72.7% | 12.7%(+60.0)#49 | 14.5%(+58.2)#1,120 |
| 49. | Honcut | 71.1% | 12.7%(+58.3)#50 | 14.5%(+56.6)#1,184 |
| 50. | La Vina | 70.1% | 12.7%(+57.4)#51 | 14.5%(+55.6)#1,216 |
| 51. | Weaverville | 68.0% | 12.7%(+55.2)#52 | 14.5%(+53.5)#1,302 |
| 52. | Willow Creek | 67.5% | 12.7%(+54.8)#53 | 14.5%(+53.0)#1,314 |
| 53. | Lower Lake | 66.9% | 12.7%(+54.2)#54 | 14.5%(+52.4)#1,336 |
| 54. | Lagunitas Forest Knolls | 66.7% | 12.7%(+53.9)#55 | 14.5%(+52.2)#1,341 |
| 55. | Plainview | 66.7% | 12.7%(+53.9)#56 | 14.5%(+52.2)#1,363 |
| 56. | Tupman | 66.7% | 12.7%(+53.9)#57 | 14.5%(+52.2)#1,398 |
| 57. | Bayview Cdp Humboldt County | 66.2% | 12.7%(+53.5)#58 | 14.5%(+51.7)#1,433 |
| 58. | Malaga | 66.0% | 12.7%(+53.2)#59 | 14.5%(+51.5)#1,441 |
| 59. | Ford City | 65.3% | 12.7%(+52.6)#60 | 14.5%(+50.8)#1,469 |
| 60. | Chalfant | 61.5% | 12.7%(+48.8)#61 | 14.5%(+47.0)#1,628 |
| 61. | Berry Creek | 60.0% | 12.7%(+47.3)#62 | 14.5%(+45.5)#1,684 |
| 62. | Yermo | 59.3% | 12.7%(+46.6)#63 | 14.5%(+44.8)#1,751 |
| 63. | Burney | 59.3% | 12.7%(+46.6)#64 | 14.5%(+44.8)#1,752 |
| 64. | Crows Landing | 59.3% | 12.7%(+46.5)#65 | 14.5%(+44.8)#1,757 |
| 65. | Terra Bella | 59.2% | 12.7%(+46.5)#66 | 14.5%(+44.7)#1,758 |
| 66. | Lucerne Valley | 58.7% | 12.7%(+46.0)#67 | 14.5%(+44.2)#1,792 |
| 67. | Fuller Acres | 58.7% | 12.7%(+46.0)#68 | 14.5%(+44.2)#1,795 |
| 68. | Weedpatch | 57.9% | 12.7%(+45.2)#69 | 14.5%(+43.4)#1,846 |
| 69. | Groveland | 57.6% | 12.7%(+44.9)#70 | 14.5%(+43.1)#1,867 |
| 70. | Kettleman City | 56.8% | 12.7%(+44.1)#71 | 14.5%(+42.3)#1,925 |
| 71. | Ripley | 55.8% | 12.7%(+43.1)#72 | 14.5%(+41.3)#1,983 |
| 72. | Clio | 55.8% | 12.7%(+43.1)#73 | 14.5%(+41.3)#1,984 |
| 73. | Kennedy | 55.0% | 12.7%(+42.2)#74 | 14.5%(+40.5)#2,061 |
| 74. | Graton | 54.9% | 12.7%(+42.2)#75 | 14.5%(+40.4)#2,063 |
| 75. | Camanche North Shore | 54.4% | 12.7%(+41.6)#76 | 14.5%(+39.9)#2,109 |
| 76. | Westwood | 53.7% | 12.7%(+40.9)#77 | 14.5%(+39.2)#2,162 |
| 77. | Etna | 53.6% | 12.7%(+40.9)#78 | 14.5%(+39.1)#2,168 |
| 78. | Poplar Cotton Center | 53.2% | 12.7%(+40.4)#79 | 14.5%(+38.7)#2,210 |
| 79. | Alpaugh | 52.6% | 12.7%(+39.9)#80 | 14.5%(+38.1)#2,247 |
| 80. | Occidental | 52.3% | 12.7%(+39.6)#81 | 14.5%(+37.8)#2,274 |
| 81. | Hopland | 51.2% | 12.7%(+38.5)#82 | 14.5%(+36.8)#2,344 |
| 82. | Calipatria | 50.5% | 12.7%(+37.8)#83 | 14.5%(+36.0)#2,382 |
| 83. | Descanso | 50.0% | 12.7%(+37.3)#84 | 14.5%(+35.5)#2,412 |
| 84. | Patton Village | 50.0% | 12.7%(+37.3)#85 | 14.5%(+35.5)#2,434 |
| 85. | Bret Harte | 49.9% | 12.7%(+37.2)#86 | 14.5%(+35.4)#2,592 |
| 86. | Linnell Camp | 49.0% | 12.7%(+36.3)#87 | 14.5%(+34.5)#2,637 |
| 87. | Kelseyville | 48.2% | 12.7%(+35.4)#88 | 14.5%(+33.7)#2,695 |
| 88. | Portola | 48.1% | 12.7%(+35.4)#89 | 14.5%(+33.7)#2,696 |
| 89. | Newcastle | 47.5% | 12.7%(+34.8)#90 | 14.5%(+33.0)#2,759 |
| 90. | Holtville | 46.8% | 12.7%(+34.1)#91 | 14.5%(+32.3)#2,829 |
| 91. | Boyes Hot Springs | 46.8% | 12.7%(+34.0)#92 | 14.5%(+32.3)#2,840 |
| 92. | Richgrove | 46.7% | 12.7%(+34.0)#93 | 14.5%(+32.2)#2,842 |
| 93. | Casa Loma | 46.4% | 12.7%(+33.7)#94 | 14.5%(+31.9)#2,877 |
| 94. | Hoopa | 46.4% | 12.7%(+33.7)#95 | 14.5%(+31.9)#2,883 |
| 95. | Westmorland | 45.7% | 12.7%(+33.0)#96 | 14.5%(+31.3)#2,956 |
| 96. | San Joaquin | 45.7% | 12.7%(+33.0)#97 | 14.5%(+31.2)#2,961 |
| 97. | Dorris | 45.3% | 12.7%(+32.6)#98 | 14.5%(+30.8)#3,006 |
| 98. | West Point | 45.0% | 12.7%(+32.3)#99 | 14.5%(+30.5)#3,029 |
| 99. | Loleta | 45.0% | 12.7%(+32.3)#100 | 14.5%(+30.5)#3,033 |
| 100. | Goshen | 45.0% | 12.7%(+32.3)#101 | 14.5%(+30.5)#3,040 |
Common Questions
What are the Top 10 Cities with the Highest Poverty Level Among Females Between Ages 25 and 34 in California?
Top 10 Cities with the Highest Poverty Level Among Females Between Ages 25 and 34 in California are:
#1
100.0%
#2
100.0%
#3
100.0%
#4
100.0%
#5
100.0%
#6
100.0%
#7
100.0%
#8
100.0%
#9
100.0%
#10
100.0%
What city has the Highest Poverty Level Among Females Between Ages 25 and 34 in California?
Lake Isabella has the Highest Poverty Level Among Females Between Ages 25 and 34 in California with 100.0%.
What is the Poverty Level Among Females Between Ages 25 and 34 in the State of California?
Poverty Level Among Females Between Ages 25 and 34 in California is 12.7%.
What is the Poverty Level Among Females Between Ages 25 and 34 in the United States?
Poverty Level Among Females Between Ages 25 and 34 in the United States is 14.5%.