Cities with the Highest Percentage of Population Employed in Material Moving in California
RELATED REPORTS & OPTIONS
Material Moving
California
Compare Cities
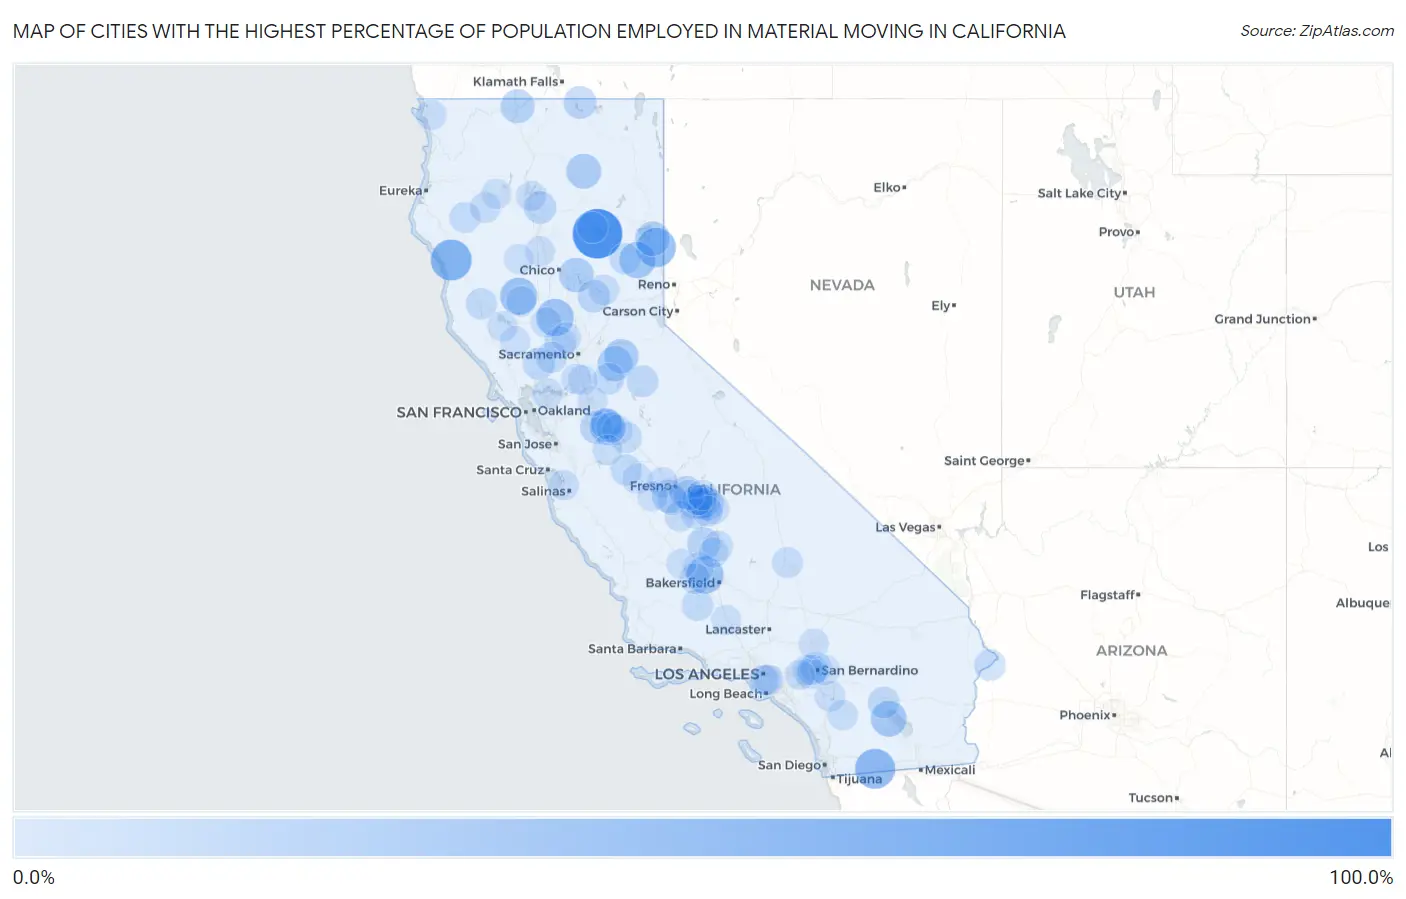
Map of Cities with the Highest Percentage of Population Employed in Material Moving in California
0.0%
100.0%
Cities with the Highest Percentage of Population Employed in Material Moving in California
| City | % Employed | vs State | vs National | |
| 1. | Prattville | 100.0% | 3.8%(+96.2)#1 | 3.8%(+96.2)#22 |
| 2. | Leggett | 59.1% | 3.8%(+55.3)#2 | 3.8%(+55.3)#70 |
| 3. | Boulevard | 54.0% | 3.8%(+50.2)#3 | 3.8%(+50.2)#87 |
| 4. | Doyle | 51.1% | 3.8%(+47.3)#4 | 3.8%(+47.3)#94 |
| 5. | Grimes | 42.7% | 3.8%(+38.8)#5 | 3.8%(+38.8)#139 |
| 6. | Smith Corner | 42.0% | 3.8%(+38.2)#6 | 3.8%(+38.2)#147 |
| 7. | Stonyford | 41.7% | 3.8%(+37.8)#7 | 3.8%(+37.8)#149 |
| 8. | Lake Davis | 38.3% | 3.8%(+34.4)#8 | 3.8%(+34.4)#179 |
| 9. | Desert Shores | 35.6% | 3.8%(+31.7)#9 | 3.8%(+31.7)#214 |
| 10. | Drytown | 32.0% | 3.8%(+28.2)#10 | 3.8%(+28.2)#266 |
| 11. | Mcarthur | 31.3% | 3.8%(+27.5)#11 | 3.8%(+27.5)#283 |
| 12. | Patton Village | 30.6% | 3.8%(+26.8)#12 | 3.8%(+26.8)#298 |
| 13. | Cherokee | 30.5% | 3.8%(+26.7)#13 | 3.8%(+26.7)#302 |
| 14. | River Pines | 30.1% | 3.8%(+26.3)#14 | 3.8%(+26.3)#305 |
| 15. | Cowan | 30.1% | 3.8%(+26.3)#15 | 3.8%(+26.3)#306 |
| 16. | Hornbrook | 27.3% | 3.8%(+23.4)#16 | 3.8%(+23.4)#377 |
| 17. | Bret Harte | 25.4% | 3.8%(+21.5)#17 | 3.8%(+21.6)#428 |
| 18. | Raisin City | 24.7% | 3.8%(+20.9)#18 | 3.8%(+20.9)#460 |
| 19. | Delft Colony | 24.3% | 3.8%(+20.5)#19 | 3.8%(+20.5)#471 |
| 20. | Del Rey | 23.9% | 3.8%(+20.1)#20 | 3.8%(+20.1)#495 |
| 21. | Teviston | 23.4% | 3.8%(+19.5)#21 | 3.8%(+19.5)#517 |
| 22. | Hypericum | 23.2% | 3.8%(+19.4)#22 | 3.8%(+19.4)#527 |
| 23. | Tulelake | 22.6% | 3.8%(+18.8)#23 | 3.8%(+18.8)#558 |
| 24. | Seville | 22.6% | 3.8%(+18.7)#24 | 3.8%(+18.8)#560 |
| 25. | Cutler | 22.4% | 3.8%(+18.6)#25 | 3.8%(+18.6)#572 |
| 26. | Grayson | 21.8% | 3.8%(+17.9)#26 | 3.8%(+18.0)#607 |
| 27. | Dobbins | 21.1% | 3.8%(+17.3)#27 | 3.8%(+17.3)#649 |
| 28. | Millville | 20.9% | 3.8%(+17.0)#28 | 3.8%(+17.0)#664 |
| 29. | Yolo | 18.2% | 3.8%(+14.3)#29 | 3.8%(+14.4)#884 |
| 30. | Moskowite Corner | 18.2% | 3.8%(+14.3)#30 | 3.8%(+14.4)#887 |
| 31. | Thermal | 17.7% | 3.8%(+13.8)#31 | 3.8%(+13.8)#941 |
| 32. | Avery | 17.6% | 3.8%(+13.7)#32 | 3.8%(+13.8)#956 |
| 33. | Maricopa | 17.4% | 3.8%(+13.5)#33 | 3.8%(+13.5)#994 |
| 34. | Camanche North Shore | 16.9% | 3.8%(+13.1)#34 | 3.8%(+13.1)#1,049 |
| 35. | Bluewater | 16.7% | 3.8%(+12.8)#35 | 3.8%(+12.8)#1,083 |
| 36. | Las Flores Cdp Tehama County | 16.7% | 3.8%(+12.8)#36 | 3.8%(+12.8)#1,086 |
| 37. | Winters | 16.3% | 3.8%(+12.4)#37 | 3.8%(+12.5)#1,147 |
| 38. | Redwood Valley | 16.0% | 3.8%(+12.2)#38 | 3.8%(+12.2)#1,185 |
| 39. | Monson | 15.9% | 3.8%(+12.0)#39 | 3.8%(+12.0)#1,213 |
| 40. | South Dos Palos | 15.6% | 3.8%(+11.7)#40 | 3.8%(+11.7)#1,268 |
| 41. | Cressey | 15.3% | 3.8%(+11.5)#41 | 3.8%(+11.5)#1,321 |
| 42. | Cromberg | 15.2% | 3.8%(+11.3)#42 | 3.8%(+11.3)#1,339 |
| 43. | Mad River | 14.9% | 3.8%(+11.1)#43 | 3.8%(+11.1)#1,392 |
| 44. | Sultana | 14.8% | 3.8%(+11.0)#44 | 3.8%(+11.0)#1,413 |
| 45. | Edison | 14.7% | 3.8%(+10.9)#45 | 3.8%(+10.9)#1,432 |
| 46. | Chester | 14.4% | 3.8%(+10.6)#46 | 3.8%(+10.6)#1,499 |
| 47. | Inyokern | 14.3% | 3.8%(+10.5)#47 | 3.8%(+10.5)#1,518 |
| 48. | Goshen | 14.1% | 3.8%(+10.2)#48 | 3.8%(+10.2)#1,598 |
| 49. | Ducor | 14.0% | 3.8%(+10.2)#49 | 3.8%(+10.2)#1,604 |
| 50. | Buttonwillow | 14.0% | 3.8%(+10.1)#50 | 3.8%(+10.1)#1,624 |
| 51. | Woodlake | 13.8% | 3.8%(+9.97)#51 | 3.8%(+9.97)#1,665 |
| 52. | Rouse | 13.7% | 3.8%(+9.89)#52 | 3.8%(+9.90)#1,692 |
| 53. | Camptonville | 13.3% | 3.8%(+9.50)#53 | 3.8%(+9.50)#1,810 |
| 54. | Hayfork | 13.3% | 3.8%(+9.42)#54 | 3.8%(+9.43)#1,835 |
| 55. | San Bernardino | 13.2% | 3.8%(+9.32)#55 | 3.8%(+9.32)#1,875 |
| 56. | Armona | 13.1% | 3.8%(+9.25)#56 | 3.8%(+9.26)#1,894 |
| 57. | Firebaugh | 12.9% | 3.8%(+9.06)#57 | 3.8%(+9.07)#1,966 |
| 58. | Winchester | 12.8% | 3.8%(+8.98)#58 | 3.8%(+8.99)#1,996 |
| 59. | Bloomington | 12.8% | 3.8%(+8.97)#59 | 3.8%(+8.98)#1,998 |
| 60. | Ivanhoe | 12.6% | 3.8%(+8.80)#60 | 3.8%(+8.81)#2,047 |
| 61. | Biola | 12.6% | 3.8%(+8.77)#61 | 3.8%(+8.77)#2,062 |
| 62. | Mountain Gate | 12.6% | 3.8%(+8.77)#62 | 3.8%(+8.77)#2,064 |
| 63. | Parlier | 12.6% | 3.8%(+8.75)#63 | 3.8%(+8.76)#2,070 |
| 64. | Di Giorgio | 12.5% | 3.8%(+8.66)#64 | 3.8%(+8.67)#2,099 |
| 65. | Castroville | 12.4% | 3.8%(+8.61)#65 | 3.8%(+8.61)#2,128 |
| 66. | Denair | 12.3% | 3.8%(+8.46)#66 | 3.8%(+8.46)#2,183 |
| 67. | Fontana | 12.3% | 3.8%(+8.44)#67 | 3.8%(+8.45)#2,190 |
| 68. | Hiouchi | 12.2% | 3.8%(+8.41)#68 | 3.8%(+8.41)#2,202 |
| 69. | Caruthers | 12.2% | 3.8%(+8.33)#69 | 3.8%(+8.33)#2,232 |
| 70. | Clyde | 12.1% | 3.8%(+8.29)#70 | 3.8%(+8.30)#2,243 |
| 71. | Woodville Farm Labor Camp | 12.1% | 3.8%(+8.27)#71 | 3.8%(+8.27)#2,256 |
| 72. | Wasco | 12.1% | 3.8%(+8.26)#72 | 3.8%(+8.26)#2,258 |
| 73. | Lodoga | 12.0% | 3.8%(+8.21)#73 | 3.8%(+8.22)#2,273 |
| 74. | Cudahy | 12.0% | 3.8%(+8.19)#74 | 3.8%(+8.20)#2,276 |
| 75. | Orange Cove | 12.0% | 3.8%(+8.19)#75 | 3.8%(+8.20)#2,277 |
| 76. | Rialto | 12.0% | 3.8%(+8.19)#76 | 3.8%(+8.19)#2,280 |
| 77. | Walnut Grove | 12.0% | 3.8%(+8.15)#77 | 3.8%(+8.15)#2,301 |
| 78. | Aguanga | 11.8% | 3.8%(+7.96)#78 | 3.8%(+7.97)#2,370 |
| 79. | Arbuckle | 11.7% | 3.8%(+7.90)#79 | 3.8%(+7.91)#2,408 |
| 80. | Dinuba | 11.7% | 3.8%(+7.83)#80 | 3.8%(+7.84)#2,428 |
| 81. | Gustine | 11.7% | 3.8%(+7.82)#81 | 3.8%(+7.82)#2,436 |
| 82. | Weaverville | 11.6% | 3.8%(+7.77)#82 | 3.8%(+7.78)#2,453 |
| 83. | Knights Landing | 11.6% | 3.8%(+7.73)#83 | 3.8%(+7.73)#2,477 |
| 84. | Richfield | 11.5% | 3.8%(+7.70)#84 | 3.8%(+7.71)#2,484 |
| 85. | Kelseyville | 11.5% | 3.8%(+7.67)#85 | 3.8%(+7.67)#2,500 |
| 86. | Bell Gardens | 11.4% | 3.8%(+7.59)#86 | 3.8%(+7.60)#2,531 |
| 87. | Highland | 11.3% | 3.8%(+7.48)#87 | 3.8%(+7.48)#2,581 |
| 88. | San Joaquin | 11.2% | 3.8%(+7.38)#88 | 3.8%(+7.39)#2,621 |
| 89. | Mountain View Acres | 11.2% | 3.8%(+7.35)#89 | 3.8%(+7.36)#2,633 |
| 90. | Kennedy | 11.2% | 3.8%(+7.35)#90 | 3.8%(+7.35)#2,640 |
| 91. | Thornton | 11.1% | 3.8%(+7.28)#91 | 3.8%(+7.28)#2,663 |
| 92. | Lost Hills | 11.1% | 3.8%(+7.23)#92 | 3.8%(+7.23)#2,702 |
| 93. | Keyes | 10.9% | 3.8%(+7.08)#93 | 3.8%(+7.08)#2,773 |
| 94. | Ontario | 10.8% | 3.8%(+6.99)#94 | 3.8%(+6.99)#2,815 |
| 95. | Benton Park | 10.8% | 3.8%(+6.92)#95 | 3.8%(+6.93)#2,841 |
| 96. | Richgrove | 10.7% | 3.8%(+6.91)#96 | 3.8%(+6.92)#2,844 |
| 97. | Lebec | 10.7% | 3.8%(+6.91)#97 | 3.8%(+6.91)#2,846 |
| 98. | Middletown | 10.7% | 3.8%(+6.91)#98 | 3.8%(+6.91)#2,849 |
| 99. | Florence Graham | 10.7% | 3.8%(+6.90)#99 | 3.8%(+6.90)#2,856 |
| 100. | Paskenta | 10.7% | 3.8%(+6.88)#100 | 3.8%(+6.88)#2,867 |
Common Questions
What are the Top 10 Cities with the Highest Percentage of Population Employed in Material Moving in California?
Top 10 Cities with the Highest Percentage of Population Employed in Material Moving in California are:
#1
100.0%
#2
59.1%
#3
54.0%
#4
51.1%
#5
42.7%
#6
42.0%
#7
41.7%
#8
38.3%
#9
35.6%
#10
32.0%
What city has the Highest Percentage of Population Employed in Material Moving in California?
Prattville has the Highest Percentage of Population Employed in Material Moving in California with 100.0%.
What is the Percentage of Population Employed in Material Moving in the State of California?
Percentage of Population Employed in Material Moving in California is 3.8%.
What is the Percentage of Population Employed in Material Moving in the United States?
Percentage of Population Employed in Material Moving in the United States is 3.8%.