Cities with the Highest Percentage of Brazilian Population in California
RELATED REPORTS & OPTIONS
Brazilian
California
Compare Cities
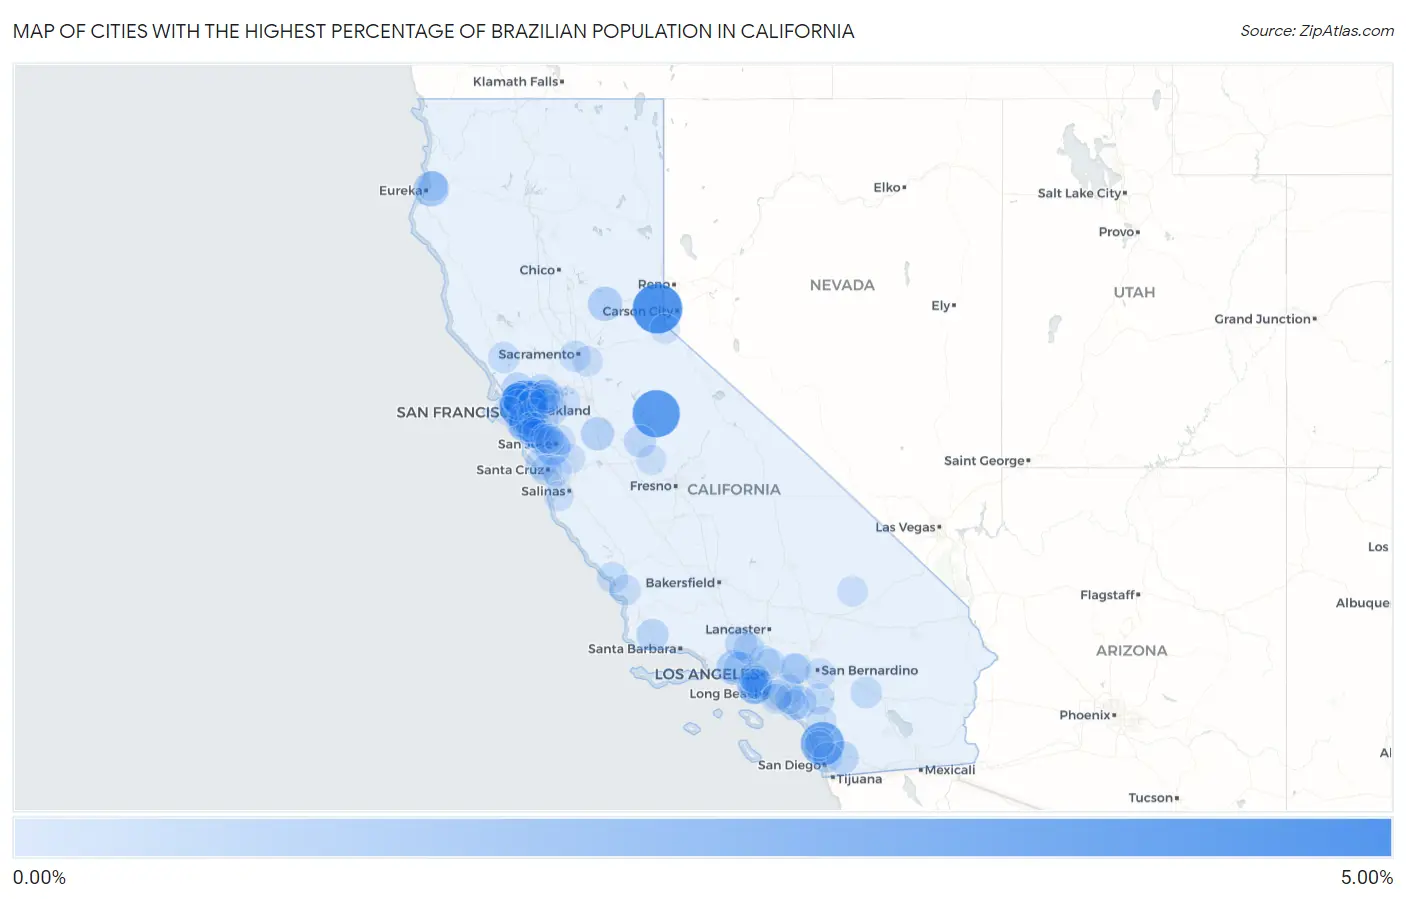
Map of Cities with the Highest Percentage of Brazilian Population in California
0.00%
5.00%
Cities with the Highest Percentage of Brazilian Population in California
| City | Brazilian | vs State | vs National | |
| 1. | Dollar Point | 4.22% | 0.12%(+4.10)#1 | 0.15%(+4.06)#52 |
| 2. | Tiburon | 3.99% | 0.12%(+3.87)#2 | 0.15%(+3.84)#60 |
| 3. | Greeley Hill | 3.75% | 0.12%(+3.63)#3 | 0.15%(+3.60)#67 |
| 4. | Rancho Santa Fe | 2.90% | 0.12%(+2.78)#4 | 0.15%(+2.75)#91 |
| 5. | Marin City | 1.96% | 0.12%(+1.84)#5 | 0.15%(+1.81)#163 |
| 6. | Richmond | 1.46% | 0.12%(+1.34)#6 | 0.15%(+1.30)#236 |
| 7. | Rollingwood | 1.32% | 0.12%(+1.20)#7 | 0.15%(+1.17)#275 |
| 8. | Campbell | 1.30% | 0.12%(+1.18)#8 | 0.15%(+1.14)#279 |
| 9. | Indianola | 1.26% | 0.12%(+1.14)#9 | 0.15%(+1.10)#295 |
| 10. | Millbrae | 1.15% | 0.12%(+1.03)#10 | 0.15%(+0.998)#335 |
| 11. | Agoura Hills | 1.13% | 0.12%(+1.01)#11 | 0.15%(+0.976)#345 |
| 12. | El Sobrante Cdp Contra Costa County | 1.07% | 0.12%(+0.952)#12 | 0.15%(+0.917)#367 |
| 13. | Cedar Flat | 1.05% | 0.12%(+0.935)#13 | 0.15%(+0.901)#374 |
| 14. | Nevada City | 1.05% | 0.12%(+0.931)#14 | 0.15%(+0.896)#376 |
| 15. | Pacheco | 1.03% | 0.12%(+0.912)#15 | 0.15%(+0.878)#387 |
| 16. | Larkspur | 1.01% | 0.12%(+0.891)#16 | 0.15%(+0.856)#402 |
| 17. | Kentfield | 0.97% | 0.12%(+0.852)#17 | 0.15%(+0.818)#414 |
| 18. | Patterson | 0.87% | 0.12%(+0.746)#18 | 0.15%(+0.712)#465 |
| 19. | Hermosa Beach | 0.86% | 0.12%(+0.745)#19 | 0.15%(+0.711)#466 |
| 20. | Belmont | 0.79% | 0.12%(+0.668)#20 | 0.15%(+0.633)#504 |
| 21. | Rancho Santa Margarita | 0.73% | 0.12%(+0.608)#21 | 0.15%(+0.574)#552 |
| 22. | Harbison Canyon | 0.73% | 0.12%(+0.606)#22 | 0.15%(+0.571)#553 |
| 23. | Stanford | 0.72% | 0.12%(+0.605)#23 | 0.15%(+0.571)#554 |
| 24. | Corte Madera | 0.72% | 0.12%(+0.599)#24 | 0.15%(+0.565)#558 |
| 25. | Novato | 0.71% | 0.12%(+0.589)#25 | 0.15%(+0.555)#567 |
| 26. | San Bruno | 0.68% | 0.12%(+0.558)#26 | 0.15%(+0.524)#591 |
| 27. | California Polytechnic State University | 0.67% | 0.12%(+0.554)#27 | 0.15%(+0.519)#597 |
| 28. | Pacifica | 0.66% | 0.12%(+0.545)#28 | 0.15%(+0.511)#605 |
| 29. | Buellton | 0.66% | 0.12%(+0.541)#29 | 0.15%(+0.506)#612 |
| 30. | University Of California Merced | 0.65% | 0.12%(+0.529)#30 | 0.15%(+0.495)#626 |
| 31. | Rancho Mission Viejo | 0.65% | 0.12%(+0.525)#31 | 0.15%(+0.491)#633 |
| 32. | Castaic | 0.63% | 0.12%(+0.513)#32 | 0.15%(+0.479)#639 |
| 33. | Eastern Goleta Valley | 0.62% | 0.12%(+0.503)#33 | 0.15%(+0.469)#652 |
| 34. | San Pablo | 0.61% | 0.12%(+0.495)#34 | 0.15%(+0.460)#665 |
| 35. | La Cresta | 0.60% | 0.12%(+0.483)#35 | 0.15%(+0.448)#677 |
| 36. | Calabasas | 0.59% | 0.12%(+0.469)#36 | 0.15%(+0.435)#689 |
| 37. | Redondo Beach | 0.56% | 0.12%(+0.443)#37 | 0.15%(+0.408)#724 |
| 38. | Bonny Doon | 0.56% | 0.12%(+0.440)#38 | 0.15%(+0.406)#729 |
| 39. | Burlingame | 0.55% | 0.12%(+0.429)#39 | 0.15%(+0.395)#737 |
| 40. | La Crescenta Montrose | 0.53% | 0.12%(+0.413)#40 | 0.15%(+0.379)#755 |
| 41. | Rancho Mirage | 0.53% | 0.12%(+0.408)#41 | 0.15%(+0.373)#765 |
| 42. | Villa Park | 0.52% | 0.12%(+0.396)#42 | 0.15%(+0.362)#782 |
| 43. | Canyon Lake | 0.50% | 0.12%(+0.376)#43 | 0.15%(+0.341)#808 |
| 44. | Benicia | 0.49% | 0.12%(+0.372)#44 | 0.15%(+0.338)#815 |
| 45. | Torrance | 0.48% | 0.12%(+0.362)#45 | 0.15%(+0.327)#837 |
| 46. | Ross | 0.47% | 0.12%(+0.353)#46 | 0.15%(+0.319)#846 |
| 47. | West Sacramento | 0.47% | 0.12%(+0.351)#47 | 0.15%(+0.317)#850 |
| 48. | Windsor | 0.47% | 0.12%(+0.348)#48 | 0.15%(+0.313)#856 |
| 49. | South San Francisco | 0.44% | 0.12%(+0.321)#49 | 0.15%(+0.287)#892 |
| 50. | Claremont | 0.44% | 0.12%(+0.320)#50 | 0.15%(+0.285)#896 |
| 51. | Berkeley | 0.44% | 0.12%(+0.318)#51 | 0.15%(+0.284)#898 |
| 52. | Santa Clarita | 0.43% | 0.12%(+0.314)#52 | 0.15%(+0.280)#903 |
| 53. | Cayucos | 0.42% | 0.12%(+0.304)#53 | 0.15%(+0.270)#925 |
| 54. | Gardena | 0.41% | 0.12%(+0.291)#54 | 0.15%(+0.257)#947 |
| 55. | Cherryland | 0.41% | 0.12%(+0.287)#55 | 0.15%(+0.253)#957 |
| 56. | San Luis Obispo | 0.41% | 0.12%(+0.287)#56 | 0.15%(+0.252)#958 |
| 57. | Lennox | 0.40% | 0.12%(+0.282)#57 | 0.15%(+0.247)#967 |
| 58. | Laguna Hills | 0.40% | 0.12%(+0.281)#58 | 0.15%(+0.247)#969 |
| 59. | Albany | 0.40% | 0.12%(+0.280)#59 | 0.15%(+0.246)#972 |
| 60. | Santa Cruz | 0.40% | 0.12%(+0.278)#60 | 0.15%(+0.244)#978 |
| 61. | Daly City | 0.39% | 0.12%(+0.271)#61 | 0.15%(+0.237)#998 |
| 62. | Tamalpais Homestead Valley | 0.39% | 0.12%(+0.266)#62 | 0.15%(+0.232)#1,010 |
| 63. | Altadena | 0.37% | 0.12%(+0.248)#63 | 0.15%(+0.214)#1,050 |
| 64. | Kensington | 0.36% | 0.12%(+0.238)#64 | 0.15%(+0.204)#1,069 |
| 65. | El Segundo | 0.36% | 0.12%(+0.238)#65 | 0.15%(+0.203)#1,070 |
| 66. | San Carlos | 0.35% | 0.12%(+0.228)#66 | 0.15%(+0.194)#1,104 |
| 67. | Upland | 0.35% | 0.12%(+0.227)#67 | 0.15%(+0.192)#1,107 |
| 68. | Fort Irwin | 0.35% | 0.12%(+0.226)#68 | 0.15%(+0.192)#1,109 |
| 69. | Alameda | 0.34% | 0.12%(+0.223)#69 | 0.15%(+0.189)#1,120 |
| 70. | Vineyard | 0.34% | 0.12%(+0.220)#70 | 0.15%(+0.186)#1,123 |
| 71. | Strawberry Cdp Marin County | 0.34% | 0.12%(+0.218)#71 | 0.15%(+0.184)#1,130 |
| 72. | Loma Linda | 0.33% | 0.12%(+0.214)#72 | 0.15%(+0.180)#1,147 |
| 73. | Irvine | 0.33% | 0.12%(+0.213)#73 | 0.15%(+0.178)#1,151 |
| 74. | Hawthorne | 0.33% | 0.12%(+0.208)#74 | 0.15%(+0.174)#1,170 |
| 75. | Brentwood | 0.33% | 0.12%(+0.206)#75 | 0.15%(+0.172)#1,179 |
| 76. | Midway City | 0.32% | 0.12%(+0.204)#76 | 0.15%(+0.170)#1,185 |
| 77. | North Fair Oaks | 0.32% | 0.12%(+0.201)#77 | 0.15%(+0.167)#1,194 |
| 78. | Arcata | 0.31% | 0.12%(+0.193)#78 | 0.15%(+0.159)#1,217 |
| 79. | Foster City | 0.31% | 0.12%(+0.191)#79 | 0.15%(+0.156)#1,227 |
| 80. | San Mateo | 0.31% | 0.12%(+0.188)#80 | 0.15%(+0.153)#1,236 |
| 81. | Mountain View | 0.30% | 0.12%(+0.181)#81 | 0.15%(+0.147)#1,256 |
| 82. | Danville | 0.30% | 0.12%(+0.180)#82 | 0.15%(+0.145)#1,261 |
| 83. | Fallbrook | 0.30% | 0.12%(+0.177)#83 | 0.15%(+0.143)#1,268 |
| 84. | Morgan Hill | 0.29% | 0.12%(+0.174)#84 | 0.15%(+0.140)#1,281 |
| 85. | Santa Clara | 0.29% | 0.12%(+0.173)#85 | 0.15%(+0.139)#1,287 |
| 86. | East Foothills | 0.29% | 0.12%(+0.171)#86 | 0.15%(+0.136)#1,293 |
| 87. | Chowchilla | 0.29% | 0.12%(+0.168)#87 | 0.15%(+0.134)#1,302 |
| 88. | Huntington Beach | 0.29% | 0.12%(+0.168)#88 | 0.15%(+0.133)#1,305 |
| 89. | Solana Beach | 0.29% | 0.12%(+0.166)#89 | 0.15%(+0.132)#1,312 |
| 90. | San Diego | 0.28% | 0.12%(+0.161)#90 | 0.15%(+0.127)#1,327 |
| 91. | Vine Hill | 0.28% | 0.12%(+0.160)#91 | 0.15%(+0.126)#1,330 |
| 92. | Rio Del Mar | 0.28% | 0.12%(+0.158)#92 | 0.15%(+0.124)#1,336 |
| 93. | Lafayette | 0.27% | 0.12%(+0.153)#93 | 0.15%(+0.119)#1,346 |
| 94. | Pleasant Hill | 0.27% | 0.12%(+0.153)#94 | 0.15%(+0.119)#1,348 |
| 95. | San Francisco | 0.26% | 0.12%(+0.140)#95 | 0.15%(+0.105)#1,389 |
| 96. | Culver City | 0.26% | 0.12%(+0.138)#96 | 0.15%(+0.104)#1,392 |
| 97. | South Lake Tahoe | 0.26% | 0.12%(+0.138)#97 | 0.15%(+0.104)#1,393 |
| 98. | Encinitas | 0.26% | 0.12%(+0.136)#98 | 0.15%(+0.101)#1,407 |
| 99. | Del Rey Oaks | 0.25% | 0.12%(+0.129)#99 | 0.15%(+0.094)#1,426 |
| 100. | Sunnyvale | 0.25% | 0.12%(+0.128)#100 | 0.15%(+0.093)#1,433 |
Common Questions
What are the Top 10 Cities with the Highest Percentage of Brazilian Population in California?
Top 10 Cities with the Highest Percentage of Brazilian Population in California are:
#1
4.22%
#2
3.99%
#3
3.75%
#4
2.90%
#5
1.96%
#6
1.46%
#7
1.32%
#8
1.30%
#9
1.26%
#10
1.15%
What city has the Highest Percentage of Brazilian Population in California?
Dollar Point has the Highest Percentage of Brazilian Population in California with 4.22%.
What is the Percentage of Brazilian Population in the State of California?
Percentage of Brazilian Population in California is 0.12%.
What is the Percentage of Brazilian Population in the United States?
Percentage of Brazilian Population in the United States is 0.15%.