Cities with the Most Immigrants from Honduras in California
RELATED REPORTS & OPTIONS
Honduras
California
Compare Cities
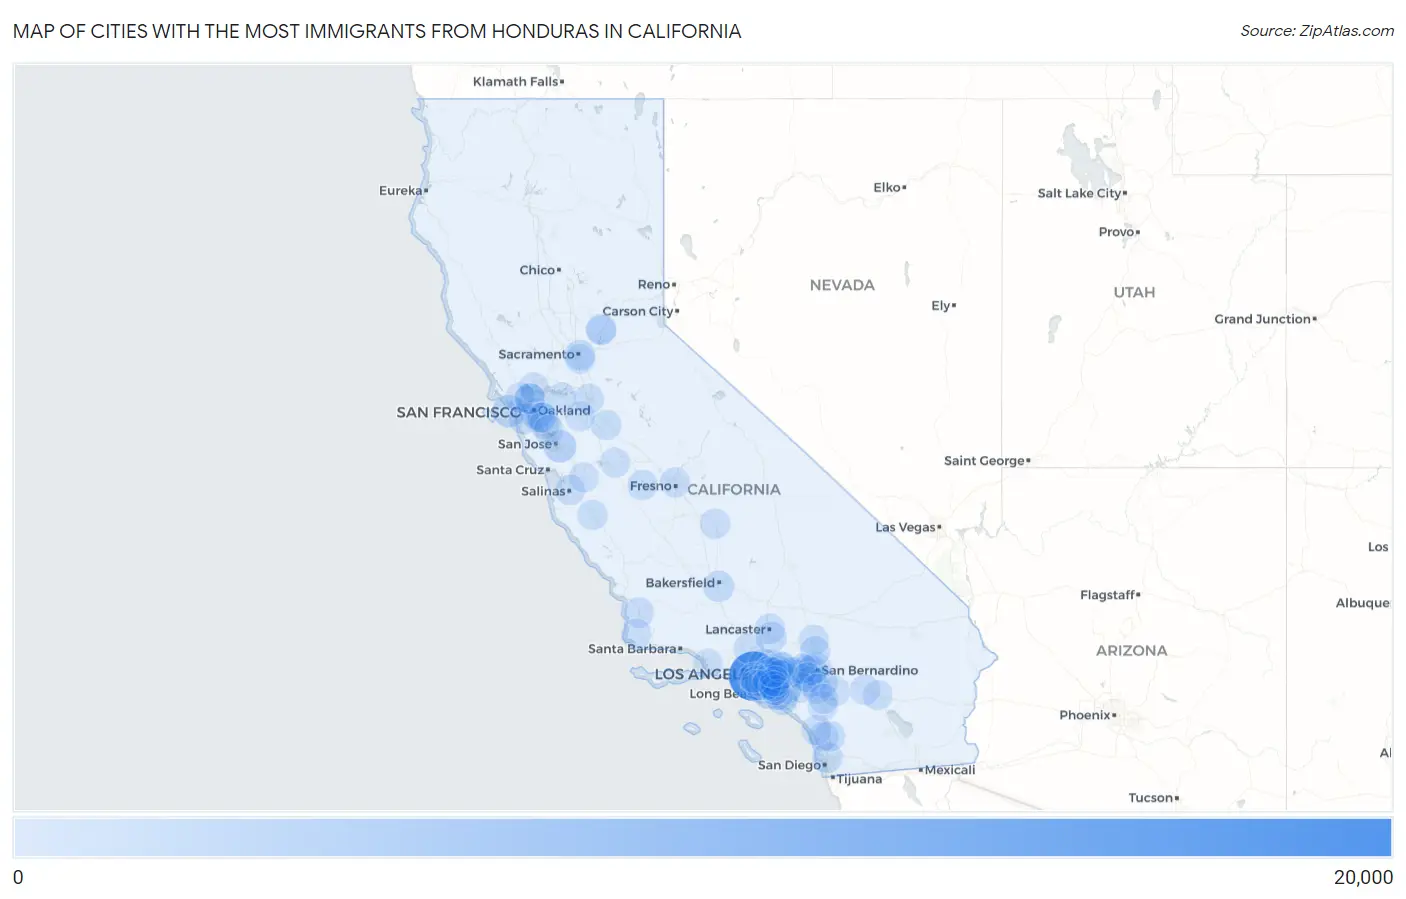
Map of Cities with the Most Immigrants from Honduras in California
0
20,000
Cities with the Most Immigrants from Honduras in California
| City | Honduras | vs State | vs National | |
| 1. | Los Angeles | 19,625 | 66,590(29.47%)#1 | 727,303(2.70%)#4 |
| 2. | Long Beach | 2,544 | 66,590(3.82%)#2 | 727,303(0.35%)#24 |
| 3. | San Jose | 2,454 | 66,590(3.69%)#3 | 727,303(0.34%)#28 |
| 4. | San Francisco | 2,260 | 66,590(3.39%)#4 | 727,303(0.31%)#34 |
| 5. | Oakland | 1,340 | 66,590(2.01%)#5 | 727,303(0.18%)#65 |
| 6. | Bakersfield | 1,135 | 66,590(1.70%)#6 | 727,303(0.16%)#81 |
| 7. | Pasadena | 1,020 | 66,590(1.53%)#7 | 727,303(0.14%)#92 |
| 8. | South Gate | 868 | 66,590(1.30%)#8 | 727,303(0.12%)#109 |
| 9. | Palmdale | 812 | 66,590(1.22%)#9 | 727,303(0.11%)#119 |
| 10. | Ontario | 799 | 66,590(1.20%)#10 | 727,303(0.11%)#121 |
| 11. | Fontana | 787 | 66,590(1.18%)#11 | 727,303(0.11%)#125 |
| 12. | Daly City | 734 | 66,590(1.10%)#12 | 727,303(0.10%)#142 |
| 13. | Westmont | 645 | 66,590(0.97%)#13 | 727,303(0.09%)#159 |
| 14. | Compton | 640 | 66,590(0.96%)#14 | 727,303(0.09%)#160 |
| 15. | Richmond | 637 | 66,590(0.96%)#15 | 727,303(0.09%)#163 |
| 16. | Lynwood | 633 | 66,590(0.95%)#16 | 727,303(0.09%)#165 |
| 17. | Huntington Park | 620 | 66,590(0.93%)#17 | 727,303(0.09%)#171 |
| 18. | Riverside | 609 | 66,590(0.91%)#18 | 727,303(0.08%)#176 |
| 19. | El Monte | 559 | 66,590(0.84%)#19 | 727,303(0.08%)#190 |
| 20. | Santa Ana | 551 | 66,590(0.83%)#20 | 727,303(0.08%)#194 |
| 21. | Florence Graham | 550 | 66,590(0.83%)#21 | 727,303(0.08%)#195 |
| 22. | San Diego | 544 | 66,590(0.82%)#22 | 727,303(0.07%)#196 |
| 23. | Montclair | 531 | 66,590(0.80%)#23 | 727,303(0.07%)#201 |
| 24. | Sacramento | 510 | 66,590(0.77%)#24 | 727,303(0.07%)#208 |
| 25. | East Los Angeles | 503 | 66,590(0.76%)#25 | 727,303(0.07%)#210 |
| 26. | San Bernardino | 466 | 66,590(0.70%)#26 | 727,303(0.06%)#226 |
| 27. | Santa Maria | 405 | 66,590(0.61%)#27 | 727,303(0.06%)#261 |
| 28. | Inglewood | 403 | 66,590(0.61%)#28 | 727,303(0.06%)#262 |
| 29. | Pomona | 402 | 66,590(0.60%)#29 | 727,303(0.06%)#263 |
| 30. | Montebello | 379 | 66,590(0.57%)#30 | 727,303(0.05%)#275 |
| 31. | Hayward | 374 | 66,590(0.56%)#31 | 727,303(0.05%)#279 |
| 32. | La Mirada | 372 | 66,590(0.56%)#32 | 727,303(0.05%)#280 |
| 33. | Lancaster | 336 | 66,590(0.50%)#33 | 727,303(0.05%)#308 |
| 34. | Willowbrook | 322 | 66,590(0.48%)#34 | 727,303(0.04%)#326 |
| 35. | Downey | 316 | 66,590(0.47%)#35 | 727,303(0.04%)#337 |
| 36. | Anaheim | 315 | 66,590(0.47%)#36 | 727,303(0.04%)#339 |
| 37. | Carson | 303 | 66,590(0.46%)#37 | 727,303(0.04%)#350 |
| 38. | Lennox | 300 | 66,590(0.45%)#38 | 727,303(0.04%)#357 |
| 39. | Bell | 297 | 66,590(0.45%)#39 | 727,303(0.04%)#362 |
| 40. | Fresno | 281 | 66,590(0.42%)#40 | 727,303(0.04%)#384 |
| 41. | Rialto | 278 | 66,590(0.42%)#41 | 727,303(0.04%)#386 |
| 42. | Escondido | 274 | 66,590(0.41%)#42 | 727,303(0.04%)#392 |
| 43. | Salinas | 272 | 66,590(0.41%)#43 | 727,303(0.04%)#393 |
| 44. | Victorville | 270 | 66,590(0.41%)#44 | 727,303(0.04%)#395 |
| 45. | Norwalk | 268 | 66,590(0.40%)#45 | 727,303(0.04%)#401 |
| 46. | Mendota | 265 | 66,590(0.40%)#46 | 727,303(0.04%)#406 |
| 47. | Moreno Valley | 251 | 66,590(0.38%)#47 | 727,303(0.03%)#422 |
| 48. | San Pablo | 241 | 66,590(0.36%)#48 | 727,303(0.03%)#429 |
| 49. | Stockton | 238 | 66,590(0.36%)#49 | 727,303(0.03%)#435 |
| 50. | Glendale | 230 | 66,590(0.35%)#50 | 727,303(0.03%)#447 |
| 51. | West Covina | 229 | 66,590(0.34%)#51 | 727,303(0.03%)#448 |
| 52. | Bellflower | 222 | 66,590(0.33%)#52 | 727,303(0.03%)#457 |
| 53. | Hesperia | 221 | 66,590(0.33%)#53 | 727,303(0.03%)#461 |
| 54. | Corona | 212 | 66,590(0.32%)#54 | 727,303(0.03%)#480 |
| 55. | Modesto | 210 | 66,590(0.32%)#55 | 727,303(0.03%)#485 |
| 56. | San Marcos | 210 | 66,590(0.32%)#56 | 727,303(0.03%)#486 |
| 57. | Buena Park | 207 | 66,590(0.31%)#57 | 727,303(0.03%)#489 |
| 58. | Gardena | 206 | 66,590(0.31%)#58 | 727,303(0.03%)#491 |
| 59. | Santa Clarita | 201 | 66,590(0.30%)#59 | 727,303(0.03%)#500 |
| 60. | Rancho Cucamonga | 199 | 66,590(0.30%)#60 | 727,303(0.03%)#503 |
| 61. | Cathedral City | 199 | 66,590(0.30%)#61 | 727,303(0.03%)#504 |
| 62. | Baldwin Park | 195 | 66,590(0.29%)#62 | 727,303(0.03%)#515 |
| 63. | Alhambra | 193 | 66,590(0.29%)#63 | 727,303(0.03%)#520 |
| 64. | Lindsay | 193 | 66,590(0.29%)#64 | 727,303(0.03%)#521 |
| 65. | Bell Gardens | 188 | 66,590(0.28%)#65 | 727,303(0.03%)#535 |
| 66. | Greenfield | 183 | 66,590(0.27%)#66 | 727,303(0.03%)#551 |
| 67. | San Leandro | 181 | 66,590(0.27%)#67 | 727,303(0.02%)#556 |
| 68. | Lawndale | 176 | 66,590(0.26%)#68 | 727,303(0.02%)#569 |
| 69. | Costa Mesa | 173 | 66,590(0.26%)#69 | 727,303(0.02%)#579 |
| 70. | Ashland | 172 | 66,590(0.26%)#70 | 727,303(0.02%)#583 |
| 71. | Azusa | 166 | 66,590(0.25%)#71 | 727,303(0.02%)#596 |
| 72. | Paramount | 163 | 66,590(0.24%)#72 | 727,303(0.02%)#604 |
| 73. | Lompoc | 163 | 66,590(0.24%)#73 | 727,303(0.02%)#606 |
| 74. | Tracy | 162 | 66,590(0.24%)#74 | 727,303(0.02%)#612 |
| 75. | Antioch | 161 | 66,590(0.24%)#75 | 727,303(0.02%)#616 |
| 76. | San Rafael | 159 | 66,590(0.24%)#76 | 727,303(0.02%)#622 |
| 77. | La Puente | 150 | 66,590(0.23%)#77 | 727,303(0.02%)#644 |
| 78. | Vallejo | 147 | 66,590(0.22%)#78 | 727,303(0.02%)#654 |
| 79. | Lemon Hill | 144 | 66,590(0.22%)#79 | 727,303(0.02%)#669 |
| 80. | Indio | 140 | 66,590(0.21%)#80 | 727,303(0.02%)#676 |
| 81. | East Rancho Dominguez | 138 | 66,590(0.21%)#81 | 727,303(0.02%)#686 |
| 82. | Westminster | 137 | 66,590(0.21%)#82 | 727,303(0.02%)#689 |
| 83. | North Auburn | 137 | 66,590(0.21%)#83 | 727,303(0.02%)#692 |
| 84. | Jurupa Valley | 132 | 66,590(0.20%)#84 | 727,303(0.02%)#710 |
| 85. | Oceanside | 128 | 66,590(0.19%)#85 | 727,303(0.02%)#723 |
| 86. | Duarte | 128 | 66,590(0.19%)#86 | 727,303(0.02%)#728 |
| 87. | Oxnard | 127 | 66,590(0.19%)#87 | 727,303(0.02%)#731 |
| 88. | Murrieta | 126 | 66,590(0.19%)#88 | 727,303(0.02%)#740 |
| 89. | Fremont | 117 | 66,590(0.18%)#89 | 727,303(0.02%)#792 |
| 90. | Los Banos | 117 | 66,590(0.18%)#90 | 727,303(0.02%)#793 |
| 91. | Mead Valley | 115 | 66,590(0.17%)#91 | 727,303(0.02%)#803 |
| 92. | Cypress | 113 | 66,590(0.17%)#92 | 727,303(0.02%)#809 |
| 93. | Culver City | 113 | 66,590(0.17%)#93 | 727,303(0.02%)#810 |
| 94. | South Whittier | 108 | 66,590(0.16%)#94 | 727,303(0.01%)#831 |
| 95. | Hollister | 107 | 66,590(0.16%)#95 | 727,303(0.01%)#835 |
| 96. | San Jacinto | 106 | 66,590(0.16%)#96 | 727,303(0.01%)#839 |
| 97. | Auburn | 103 | 66,590(0.15%)#97 | 727,303(0.01%)#861 |
| 98. | Menifee | 101 | 66,590(0.15%)#98 | 727,303(0.01%)#868 |
| 99. | Cerritos | 101 | 66,590(0.15%)#99 | 727,303(0.01%)#872 |
| 100. | Rosemead | 100 | 66,590(0.15%)#100 | 727,303(0.01%)#879 |
Common Questions
What are the Top 10 Cities with the Most Immigrants from Honduras in California?
Top 10 Cities with the Most Immigrants from Honduras in California are:
#1
19,625
#2
2,544
#3
2,454
#4
2,260
#5
1,340
#6
1,135
#7
1,020
#8
868
#9
812
#10
799
What city has the Most Immigrants from Honduras in California?
Los Angeles has the Most Immigrants from Honduras in California with 19,625.
What is the Total Immigrants from Honduras in the State of California?
Total Immigrants from Honduras in California is 66,590.
What is the Total Immigrants from Honduras in the United States?
Total Immigrants from Honduras in the United States is 727,303.