Cities with the Lowest Female Poverty Level in California
RELATED REPORTS & OPTIONS
Lowest Poverty | Female
California
Compare Cities
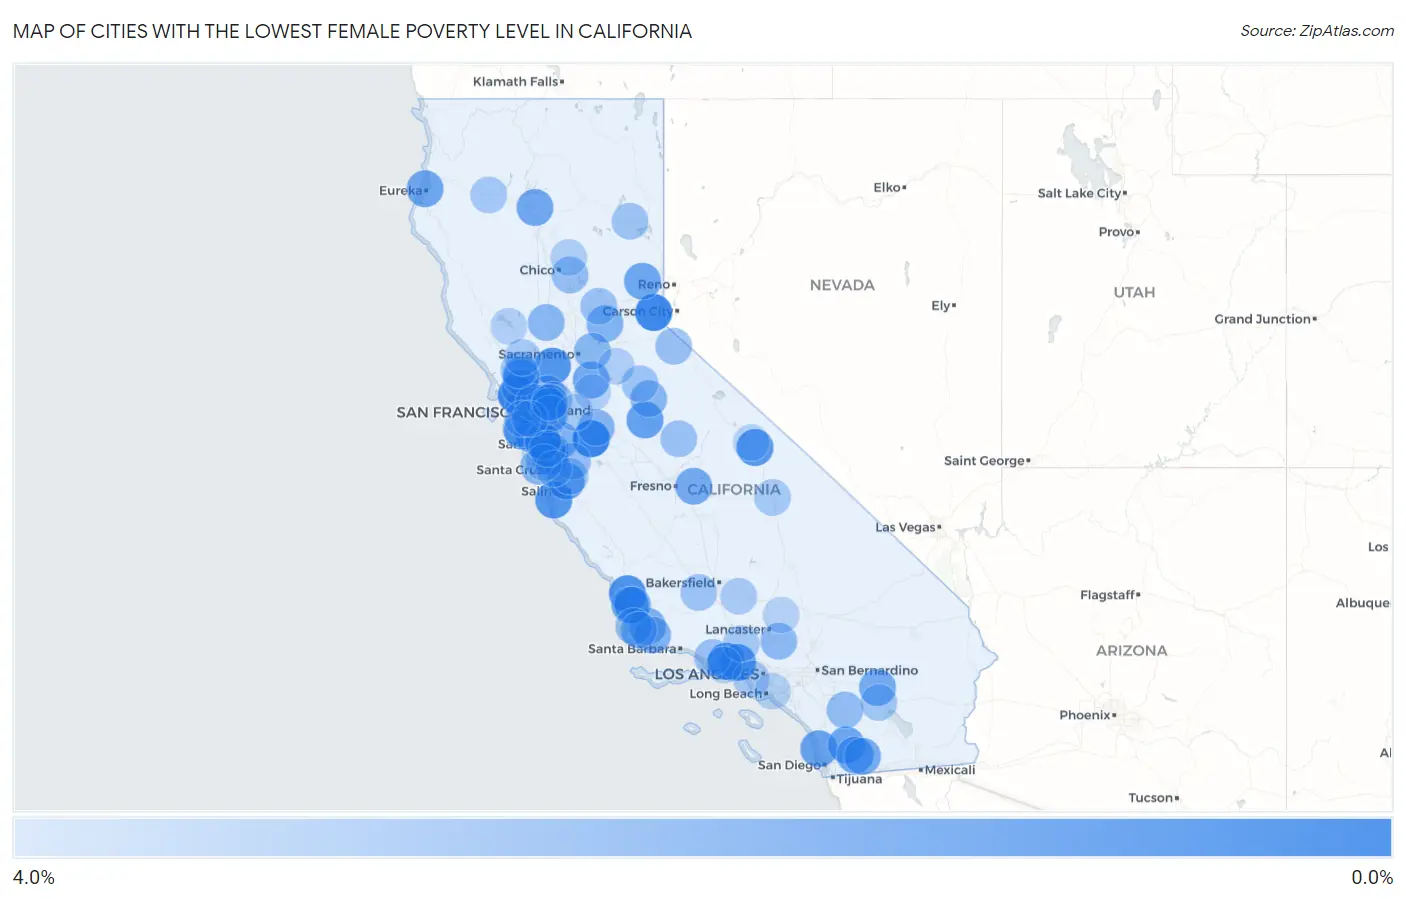
Map of Cities with the Lowest Female Poverty Level in California
4.0%
0.0%
Cities with the Lowest Female Poverty Level in California
| City | Female Poverty | vs State | vs National | |
| 1. | Diablo Grande | 0.14% | 13.2%(-13.0)#1 | 13.7%(-13.6)#6 |
| 2. | Sleepy Hollow | 0.30% | 13.2%(-12.9)#2 | 13.7%(-13.4)#28 |
| 3. | Sunnyside Tahoe City | 0.39% | 13.2%(-12.8)#3 | 13.7%(-13.3)#44 |
| 4. | Castle Hill | 0.55% | 13.2%(-12.6)#4 | 13.7%(-13.2)#85 |
| 5. | Emerald Lake Hills | 0.61% | 13.2%(-12.6)#5 | 13.7%(-13.1)#109 |
| 6. | Santa Rosa Valley | 0.63% | 13.2%(-12.5)#6 | 13.7%(-13.1)#119 |
| 7. | Los Ranchos | 0.75% | 13.2%(-12.4)#7 | 13.7%(-12.9)#160 |
| 8. | Hartley | 0.87% | 13.2%(-12.3)#8 | 13.7%(-12.8)#202 |
| 9. | Carmel By The Sea | 0.87% | 13.2%(-12.3)#9 | 13.7%(-12.8)#203 |
| 10. | Bell Canyon | 0.94% | 13.2%(-12.2)#10 | 13.7%(-12.8)#227 |
| 11. | Wilkerson | 0.98% | 13.2%(-12.2)#11 | 13.7%(-12.7)#247 |
| 12. | Monte Sereno | 0.99% | 13.2%(-12.2)#12 | 13.7%(-12.7)#253 |
| 13. | Lexington Hills | 1.1% | 13.2%(-12.1)#13 | 13.7%(-12.6)#302 |
| 14. | Callender | 1.3% | 13.2%(-11.9)#14 | 13.7%(-12.4)#390 |
| 15. | Elkhorn | 1.4% | 13.2%(-11.8)#15 | 13.7%(-12.3)#441 |
| 16. | Lake Don Pedro | 1.4% | 13.2%(-11.8)#16 | 13.7%(-12.3)#446 |
| 17. | Del Mar | 1.5% | 13.2%(-11.7)#17 | 13.7%(-12.2)#485 |
| 18. | Baywood Park | 1.5% | 13.2%(-11.7)#18 | 13.7%(-12.2)#503 |
| 19. | Sierraville | 1.5% | 13.2%(-11.7)#19 | 13.7%(-12.2)#524 |
| 20. | El Verano | 1.5% | 13.2%(-11.6)#20 | 13.7%(-12.2)#544 |
| 21. | San Diego Country Estates | 1.5% | 13.2%(-11.6)#21 | 13.7%(-12.2)#547 |
| 22. | Descanso | 1.6% | 13.2%(-11.6)#22 | 13.7%(-12.1)#550 |
| 23. | Samoa | 1.6% | 13.2%(-11.6)#23 | 13.7%(-12.1)#590 |
| 24. | Palo Cedro | 1.7% | 13.2%(-11.5)#24 | 13.7%(-12.0)#620 |
| 25. | El Granada | 1.7% | 13.2%(-11.5)#25 | 13.7%(-12.0)#624 |
| 26. | Modjeska | 1.7% | 13.2%(-11.5)#26 | 13.7%(-12.0)#632 |
| 27. | Tiburon | 1.7% | 13.2%(-11.5)#27 | 13.7%(-12.0)#657 |
| 28. | Collierville | 1.7% | 13.2%(-11.5)#28 | 13.7%(-12.0)#661 |
| 29. | Minkler | 1.7% | 13.2%(-11.4)#29 | 13.7%(-12.0)#680 |
| 30. | Saranap | 1.8% | 13.2%(-11.4)#30 | 13.7%(-11.9)#691 |
| 31. | Petaluma Center | 1.8% | 13.2%(-11.4)#31 | 13.7%(-11.9)#694 |
| 32. | Indio Hills | 1.8% | 13.2%(-11.4)#32 | 13.7%(-11.9)#701 |
| 33. | Pine Valley | 1.8% | 13.2%(-11.4)#33 | 13.7%(-11.9)#707 |
| 34. | Black Point Green Point | 1.9% | 13.2%(-11.3)#34 | 13.7%(-11.8)#780 |
| 35. | Los Alamos | 1.9% | 13.2%(-11.2)#35 | 13.7%(-11.8)#811 |
| 36. | Shell Ridge | 1.9% | 13.2%(-11.2)#36 | 13.7%(-11.8)#815 |
| 37. | East Foothills | 2.0% | 13.2%(-11.2)#37 | 13.7%(-11.7)#888 |
| 38. | Fairview | 2.1% | 13.2%(-11.1)#38 | 13.7%(-11.6)#914 |
| 39. | Blacklake | 2.1% | 13.2%(-11.1)#39 | 13.7%(-11.6)#928 |
| 40. | Buellton | 2.1% | 13.2%(-11.1)#40 | 13.7%(-11.6)#940 |
| 41. | Clyde | 2.1% | 13.2%(-11.0)#41 | 13.7%(-11.6)#982 |
| 42. | Meadow Vista | 2.2% | 13.2%(-11.0)#42 | 13.7%(-11.5)#1,018 |
| 43. | Highlands | 2.2% | 13.2%(-11.0)#43 | 13.7%(-11.5)#1,054 |
| 44. | Orinda | 2.3% | 13.2%(-10.9)#44 | 13.7%(-11.4)#1,093 |
| 45. | Davenport | 2.3% | 13.2%(-10.9)#45 | 13.7%(-11.4)#1,112 |
| 46. | Montara | 2.3% | 13.2%(-10.9)#46 | 13.7%(-11.4)#1,116 |
| 47. | Grayson | 2.3% | 13.2%(-10.9)#47 | 13.7%(-11.4)#1,118 |
| 48. | Gold River | 2.3% | 13.2%(-10.9)#48 | 13.7%(-11.4)#1,133 |
| 49. | Arbuckle | 2.3% | 13.2%(-10.9)#49 | 13.7%(-11.4)#1,147 |
| 50. | San Miguel Cdp Contra Costa County | 2.3% | 13.2%(-10.9)#50 | 13.7%(-11.4)#1,157 |
| 51. | Loyola | 2.3% | 13.2%(-10.8)#51 | 13.7%(-11.4)#1,161 |
| 52. | Tuolumne City | 2.3% | 13.2%(-10.8)#52 | 13.7%(-11.4)#1,168 |
| 53. | Acalanes Ridge | 2.4% | 13.2%(-10.8)#53 | 13.7%(-11.3)#1,217 |
| 54. | Littlerock | 2.4% | 13.2%(-10.8)#54 | 13.7%(-11.3)#1,241 |
| 55. | Somis | 2.5% | 13.2%(-10.7)#55 | 13.7%(-11.2)#1,277 |
| 56. | Clayton | 2.5% | 13.2%(-10.7)#56 | 13.7%(-11.2)#1,338 |
| 57. | Lake Riverside | 2.5% | 13.2%(-10.6)#57 | 13.7%(-11.2)#1,352 |
| 58. | Bayview Cdp Contra Costa County | 2.5% | 13.2%(-10.6)#58 | 13.7%(-11.2)#1,355 |
| 59. | Vandenberg Afb | 2.5% | 13.2%(-10.6)#59 | 13.7%(-11.2)#1,368 |
| 60. | Mission Hills | 2.6% | 13.2%(-10.6)#60 | 13.7%(-11.1)#1,375 |
| 61. | Temelec | 2.6% | 13.2%(-10.6)#61 | 13.7%(-11.1)#1,408 |
| 62. | San Martin | 2.6% | 13.2%(-10.6)#62 | 13.7%(-11.1)#1,433 |
| 63. | Los Altos Hills | 2.6% | 13.2%(-10.5)#63 | 13.7%(-11.0)#1,451 |
| 64. | Butte Valley | 2.7% | 13.2%(-10.5)#64 | 13.7%(-11.0)#1,475 |
| 65. | Markleeville | 2.7% | 13.2%(-10.5)#65 | 13.7%(-11.0)#1,504 |
| 66. | Saticoy | 2.7% | 13.2%(-10.5)#66 | 13.7%(-11.0)#1,518 |
| 67. | Rough And Ready | 2.8% | 13.2%(-10.4)#67 | 13.7%(-10.9)#1,564 |
| 68. | Nipinnawasee | 2.8% | 13.2%(-10.4)#68 | 13.7%(-10.9)#1,576 |
| 69. | Kensington | 2.8% | 13.2%(-10.4)#69 | 13.7%(-10.9)#1,588 |
| 70. | Dustin Acres | 2.8% | 13.2%(-10.4)#70 | 13.7%(-10.9)#1,617 |
| 71. | Alamo | 2.8% | 13.2%(-10.4)#71 | 13.7%(-10.9)#1,632 |
| 72. | Forest Meadows | 2.8% | 13.2%(-10.3)#72 | 13.7%(-10.9)#1,641 |
| 73. | Johnstonville | 2.9% | 13.2%(-10.3)#73 | 13.7%(-10.8)#1,676 |
| 74. | El Sobrante Cdp Riverside County | 2.9% | 13.2%(-10.3)#74 | 13.7%(-10.8)#1,708 |
| 75. | Glen Ellen | 2.9% | 13.2%(-10.3)#75 | 13.7%(-10.8)#1,722 |
| 76. | Norris Canyon | 2.9% | 13.2%(-10.2)#76 | 13.7%(-10.8)#1,740 |
| 77. | Vista Santa Rosa | 3.0% | 13.2%(-10.2)#77 | 13.7%(-10.7)#1,780 |
| 78. | Aromas | 3.0% | 13.2%(-10.2)#78 | 13.7%(-10.7)#1,801 |
| 79. | Ben Lomond | 3.0% | 13.2%(-10.2)#79 | 13.7%(-10.7)#1,828 |
| 80. | Junction City | 3.0% | 13.2%(-10.1)#80 | 13.7%(-10.7)#1,836 |
| 81. | Marina Del Rey | 3.1% | 13.2%(-10.1)#81 | 13.7%(-10.6)#1,880 |
| 82. | Lone Pine | 3.1% | 13.2%(-10.1)#82 | 13.7%(-10.6)#1,887 |
| 83. | Deer Park | 3.1% | 13.2%(-10.1)#83 | 13.7%(-10.6)#1,895 |
| 84. | Mountain House | 3.1% | 13.2%(-10.1)#84 | 13.7%(-10.6)#1,911 |
| 85. | Castaic | 3.1% | 13.2%(-10.1)#85 | 13.7%(-10.6)#1,924 |
| 86. | Broadmoor | 3.1% | 13.2%(-10.0)#86 | 13.7%(-10.6)#1,928 |
| 87. | Bear Valley Springs | 3.2% | 13.2%(-10.0)#87 | 13.7%(-10.5)#1,967 |
| 88. | Forest Ranch | 3.3% | 13.2%(-9.90)#88 | 13.7%(-10.4)#2,093 |
| 89. | Amador City | 3.3% | 13.2%(-9.88)#89 | 13.7%(-10.4)#2,113 |
| 90. | Rancho Mission Viejo | 3.4% | 13.2%(-9.82)#90 | 13.7%(-10.3)#2,189 |
| 91. | Seacliff | 3.4% | 13.2%(-9.81)#91 | 13.7%(-10.3)#2,198 |
| 92. | Clearlake Riviera | 3.4% | 13.2%(-9.81)#92 | 13.7%(-10.3)#2,199 |
| 93. | Brisbane | 3.4% | 13.2%(-9.80)#93 | 13.7%(-10.3)#2,207 |
| 94. | Morada | 3.4% | 13.2%(-9.79)#94 | 13.7%(-10.3)#2,218 |
| 95. | Casa Conejo | 3.4% | 13.2%(-9.77)#95 | 13.7%(-10.3)#2,243 |
| 96. | North Gate | 3.4% | 13.2%(-9.76)#96 | 13.7%(-10.3)#2,254 |
| 97. | Rossmoor | 3.5% | 13.2%(-9.73)#97 | 13.7%(-10.2)#2,288 |
| 98. | West Bishop | 3.5% | 13.2%(-9.73)#98 | 13.7%(-10.2)#2,289 |
| 99. | Saratoga | 3.5% | 13.2%(-9.72)#99 | 13.7%(-10.2)#2,293 |
| 100. | Edwards Afb | 3.5% | 13.2%(-9.68)#100 | 13.7%(-10.2)#2,330 |
Common Questions
What are the Top 10 Cities with the Lowest Female Poverty Level in California?
Top 10 Cities with the Lowest Female Poverty Level in California are:
#1
0.14%
#2
0.30%
#3
0.39%
#4
0.55%
#5
0.61%
#6
0.63%
#7
0.75%
#8
0.87%
#9
0.87%
#10
0.94%
What city has the Lowest Female Poverty Level in California?
Diablo Grande has the Lowest Female Poverty Level in California with 0.14%.
What is the Poverty Level Among Females in the State of California?
Poverty Level Among Females in California is 13.2%.
What is the Poverty Level Among Females in the United States?
Poverty Level Among Females in the United States is 13.7%.