Cities with the Highest Percentage of Population Employed in Installation, Maintenance & Repair in New Jersey
RELATED REPORTS & OPTIONS
Installation, Maintenance & Repair
New Jersey
Compare Cities
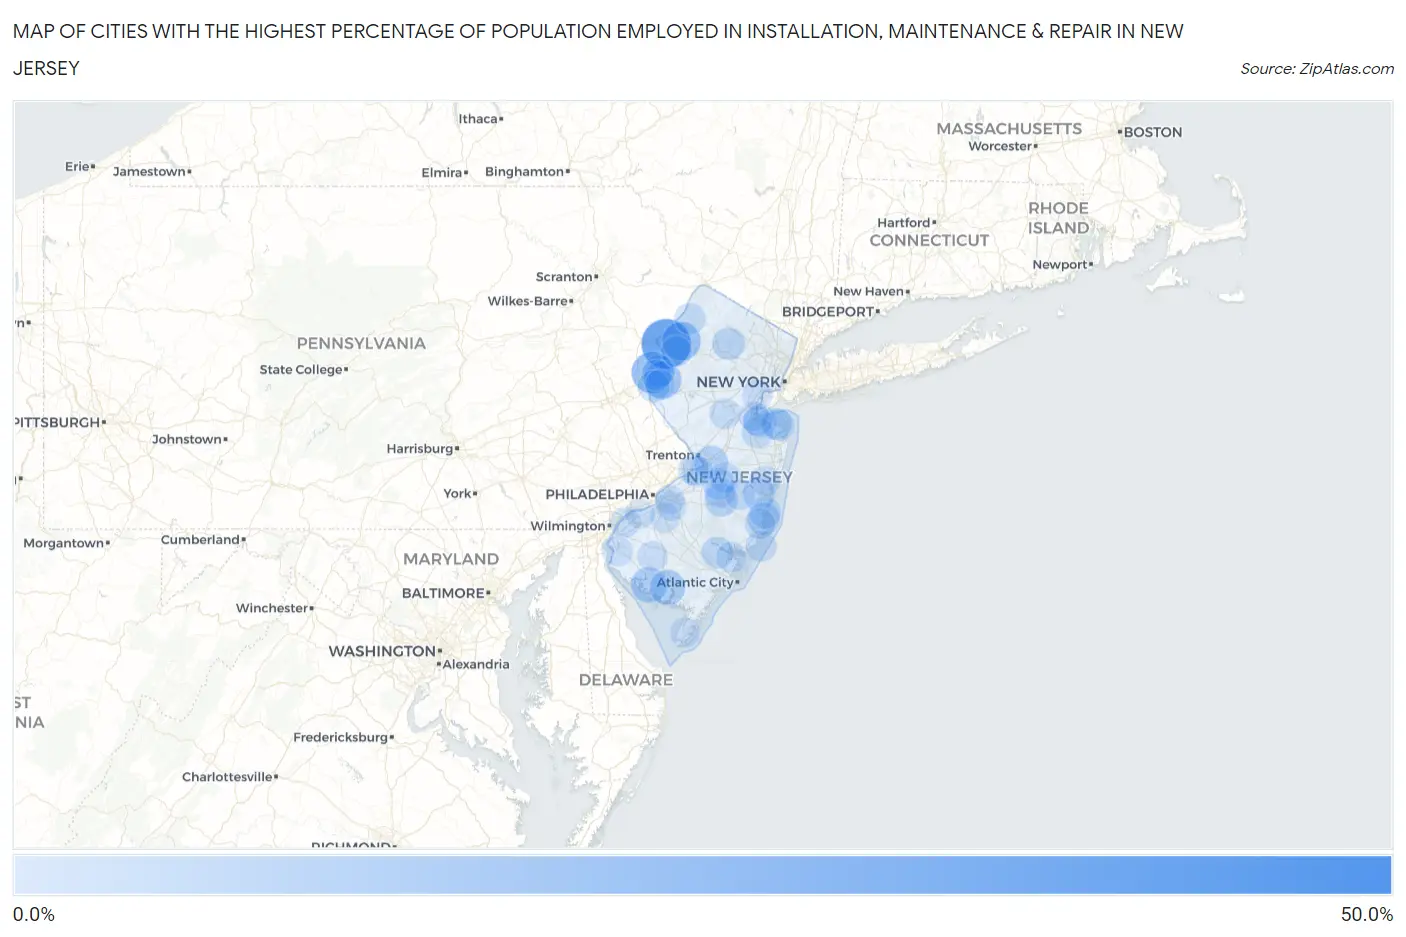
Map of Cities with the Highest Percentage of Population Employed in Installation, Maintenance & Repair in New Jersey
0.0%
50.0%
Cities with the Highest Percentage of Population Employed in Installation, Maintenance & Repair in New Jersey
| City | % Employed | vs State | vs National | |
| 1. | Gandys Beach | 41.7% | 2.5%(+39.1)#1 | 3.1%(+38.6)#130 |
| 2. | Hainesburg | 33.7% | 2.5%(+31.2)#2 | 3.1%(+30.6)#216 |
| 3. | Oceanville | 32.9% | 2.5%(+30.4)#3 | 3.1%(+29.9)#236 |
| 4. | Mizpah | 23.7% | 2.5%(+21.1)#4 | 3.1%(+20.6)#475 |
| 5. | Keasbey | 22.9% | 2.5%(+20.4)#5 | 3.1%(+19.8)#508 |
| 6. | Brainards | 22.0% | 2.5%(+19.5)#6 | 3.1%(+19.0)#542 |
| 7. | Cumberland-Hesstown | 18.5% | 2.5%(+16.0)#7 | 3.1%(+15.5)#768 |
| 8. | Three Bridges | 18.0% | 2.5%(+15.5)#8 | 3.1%(+14.9)#820 |
| 9. | Leesburg | 17.8% | 2.5%(+15.3)#9 | 3.1%(+14.7)#837 |
| 10. | Marksboro | 17.6% | 2.5%(+15.1)#10 | 3.1%(+14.6)#848 |
| 11. | Mauricetown | 16.2% | 2.5%(+13.7)#11 | 3.1%(+13.1)#993 |
| 12. | New Village | 16.1% | 2.5%(+13.6)#12 | 3.1%(+13.0)#1,013 |
| 13. | Sheppards Mill | 13.3% | 2.5%(+10.8)#13 | 3.1%(+10.3)#1,487 |
| 14. | Cedarville | 13.0% | 2.5%(+10.4)#14 | 3.1%(+9.90)#1,580 |
| 15. | Delmont | 12.7% | 2.5%(+10.2)#15 | 3.1%(+9.63)#1,646 |
| 16. | Laurel Lake | 12.7% | 2.5%(+10.1)#16 | 3.1%(+9.58)#1,657 |
| 17. | Branchville Borough | 12.4% | 2.5%(+9.90)#17 | 3.1%(+9.35)#1,723 |
| 18. | Carlls Corner | 12.3% | 2.5%(+9.81)#18 | 3.1%(+9.26)#1,738 |
| 19. | Newfoundland | 11.2% | 2.5%(+8.67)#19 | 3.1%(+8.12)#2,080 |
| 20. | Milmay | 10.8% | 2.5%(+8.29)#20 | 3.1%(+7.74)#2,210 |
| 21. | Groveville | 10.5% | 2.5%(+8.01)#21 | 3.1%(+7.46)#2,309 |
| 22. | Crosswicks | 9.9% | 2.5%(+7.42)#22 | 3.1%(+6.87)#2,592 |
| 23. | Marlboro | 9.7% | 2.5%(+7.16)#23 | 3.1%(+6.61)#2,753 |
| 24. | Presidential Lakes Estates | 9.6% | 2.5%(+7.11)#24 | 3.1%(+6.55)#2,779 |
| 25. | Sewell | 9.1% | 2.5%(+6.58)#25 | 3.1%(+6.03)#3,045 |
| 26. | Ringoes | 9.0% | 2.5%(+6.50)#26 | 3.1%(+5.95)#3,113 |
| 27. | Silver Ridge | 9.0% | 2.5%(+6.44)#27 | 3.1%(+5.89)#3,145 |
| 28. | Malaga | 9.0% | 2.5%(+6.44)#28 | 3.1%(+5.89)#3,147 |
| 29. | Sweetwater | 8.7% | 2.5%(+6.22)#29 | 3.1%(+5.67)#3,310 |
| 30. | Lake Telemark | 8.7% | 2.5%(+6.20)#30 | 3.1%(+5.64)#3,331 |
| 31. | Centre Grove | 8.7% | 2.5%(+6.14)#31 | 3.1%(+5.59)#3,383 |
| 32. | Lincoln Park Borough | 8.5% | 2.5%(+6.03)#32 | 3.1%(+5.48)#3,468 |
| 33. | Cliffwood Beach | 8.5% | 2.5%(+5.98)#33 | 3.1%(+5.43)#3,510 |
| 34. | Port Morris | 8.4% | 2.5%(+5.92)#34 | 3.1%(+5.37)#3,557 |
| 35. | Waretown | 8.3% | 2.5%(+5.80)#35 | 3.1%(+5.25)#3,661 |
| 36. | Haledon Borough | 8.2% | 2.5%(+5.70)#36 | 3.1%(+5.15)#3,742 |
| 37. | Hutchinson | 8.2% | 2.5%(+5.70)#37 | 3.1%(+5.15)#3,748 |
| 38. | Gouldtown | 8.0% | 2.5%(+5.52)#38 | 3.1%(+4.97)#3,904 |
| 39. | Hi Nella Borough | 7.8% | 2.5%(+5.27)#39 | 3.1%(+4.72)#4,112 |
| 40. | Egg Harbor City | 7.8% | 2.5%(+5.25)#40 | 3.1%(+4.70)#4,136 |
| 41. | Elmer Borough | 7.7% | 2.5%(+5.18)#41 | 3.1%(+4.62)#4,191 |
| 42. | Upper Pohatcong | 7.6% | 2.5%(+5.10)#42 | 3.1%(+4.55)#4,296 |
| 43. | Mcguire Afb | 7.6% | 2.5%(+5.05)#43 | 3.1%(+4.50)#4,359 |
| 44. | Leonardo | 7.5% | 2.5%(+4.99)#44 | 3.1%(+4.44)#4,421 |
| 45. | Clayton Borough | 7.5% | 2.5%(+4.95)#45 | 3.1%(+4.40)#4,470 |
| 46. | Forked River | 7.4% | 2.5%(+4.89)#46 | 3.1%(+4.34)#4,527 |
| 47. | Morganville | 7.3% | 2.5%(+4.81)#47 | 3.1%(+4.26)#4,610 |
| 48. | Silver Lake Cdp Warren County | 7.3% | 2.5%(+4.76)#48 | 3.1%(+4.21)#4,676 |
| 49. | South Toms River Borough | 7.1% | 2.5%(+4.58)#49 | 3.1%(+4.03)#4,899 |
| 50. | Belford | 7.1% | 2.5%(+4.54)#50 | 3.1%(+3.99)#4,938 |
| 51. | Roadstown | 7.0% | 2.5%(+4.53)#51 | 3.1%(+3.97)#4,961 |
| 52. | Arrowhead Lake | 7.0% | 2.5%(+4.50)#52 | 3.1%(+3.95)#4,988 |
| 53. | Hampton Borough | 7.0% | 2.5%(+4.46)#53 | 3.1%(+3.90)#5,034 |
| 54. | Dennisville | 6.9% | 2.5%(+4.40)#54 | 3.1%(+3.85)#5,084 |
| 55. | Crandon Lakes | 6.8% | 2.5%(+4.33)#55 | 3.1%(+3.78)#5,185 |
| 56. | Lebanon Borough | 6.8% | 2.5%(+4.32)#56 | 3.1%(+3.77)#5,200 |
| 57. | Hewitt | 6.6% | 2.5%(+4.08)#57 | 3.1%(+3.53)#5,544 |
| 58. | New Egypt | 6.6% | 2.5%(+4.06)#58 | 3.1%(+3.51)#5,581 |
| 59. | Roebling | 6.5% | 2.5%(+4.00)#59 | 3.1%(+3.45)#5,669 |
| 60. | Lakehurst Borough | 6.5% | 2.5%(+3.99)#60 | 3.1%(+3.43)#5,695 |
| 61. | Wharton Borough | 6.4% | 2.5%(+3.93)#61 | 3.1%(+3.38)#5,777 |
| 62. | North Beach Haven | 6.4% | 2.5%(+3.86)#62 | 3.1%(+3.31)#5,853 |
| 63. | Browns Mills | 6.3% | 2.5%(+3.82)#63 | 3.1%(+3.27)#5,915 |
| 64. | Shiloh Borough | 6.2% | 2.5%(+3.69)#64 | 3.1%(+3.14)#6,133 |
| 65. | Hope | 6.1% | 2.5%(+3.62)#65 | 3.1%(+3.07)#6,247 |
| 66. | Middlebush | 6.1% | 2.5%(+3.60)#66 | 3.1%(+3.04)#6,279 |
| 67. | Port Republic | 6.1% | 2.5%(+3.59)#67 | 3.1%(+3.04)#6,286 |
| 68. | Bloomsbury Borough | 6.1% | 2.5%(+3.57)#68 | 3.1%(+3.02)#6,321 |
| 69. | Pedricktown | 6.1% | 2.5%(+3.54)#69 | 3.1%(+2.99)#6,366 |
| 70. | Barnegat | 6.0% | 2.5%(+3.52)#70 | 3.1%(+2.97)#6,398 |
| 71. | Pemberton Borough | 6.0% | 2.5%(+3.45)#71 | 3.1%(+2.90)#6,501 |
| 72. | Sussex Borough | 5.9% | 2.5%(+3.42)#72 | 3.1%(+2.87)#6,559 |
| 73. | Florence | 5.9% | 2.5%(+3.38)#73 | 3.1%(+2.83)#6,622 |
| 74. | Glen Gardner Borough | 5.9% | 2.5%(+3.35)#74 | 3.1%(+2.80)#6,703 |
| 75. | Olivet | 5.8% | 2.5%(+3.25)#75 | 3.1%(+2.70)#6,854 |
| 76. | Ogdensburg Borough | 5.8% | 2.5%(+3.24)#76 | 3.1%(+2.68)#6,906 |
| 77. | Leisure Village | 5.7% | 2.5%(+3.23)#77 | 3.1%(+2.68)#6,915 |
| 78. | Woodland Park Borough | 5.6% | 2.5%(+3.08)#78 | 3.1%(+2.53)#7,197 |
| 79. | Cedar Glen Lakes | 5.6% | 2.5%(+3.08)#79 | 3.1%(+2.53)#7,198 |
| 80. | Harmony | 5.6% | 2.5%(+3.07)#80 | 3.1%(+2.52)#7,211 |
| 81. | Vincentown | 5.6% | 2.5%(+3.06)#81 | 3.1%(+2.51)#7,240 |
| 82. | Frenchtown Borough | 5.6% | 2.5%(+3.05)#82 | 3.1%(+2.50)#7,252 |
| 83. | Linden | 5.6% | 2.5%(+3.04)#83 | 3.1%(+2.49)#7,268 |
| 84. | Salem | 5.5% | 2.5%(+3.01)#84 | 3.1%(+2.46)#7,347 |
| 85. | Bloomingdale Borough | 5.5% | 2.5%(+2.96)#85 | 3.1%(+2.41)#7,454 |
| 86. | Runnemede Borough | 5.4% | 2.5%(+2.87)#86 | 3.1%(+2.32)#7,628 |
| 87. | Rio Grande | 5.3% | 2.5%(+2.82)#87 | 3.1%(+2.27)#7,735 |
| 88. | Beachwood Borough | 5.2% | 2.5%(+2.70)#88 | 3.1%(+2.15)#7,966 |
| 89. | Blackwood | 5.2% | 2.5%(+2.69)#89 | 3.1%(+2.14)#7,999 |
| 90. | Farmingdale Borough | 5.2% | 2.5%(+2.67)#90 | 3.1%(+2.12)#8,043 |
| 91. | Stewartsville | 5.2% | 2.5%(+2.66)#91 | 3.1%(+2.10)#8,066 |
| 92. | Absecon Highlands | 5.2% | 2.5%(+2.65)#92 | 3.1%(+2.10)#8,076 |
| 93. | Deal Borough | 5.1% | 2.5%(+2.63)#93 | 3.1%(+2.08)#8,122 |
| 94. | Fieldsboro Borough | 5.1% | 2.5%(+2.62)#94 | 3.1%(+2.07)#8,148 |
| 95. | Layton | 5.0% | 2.5%(+2.53)#95 | 3.1%(+1.97)#8,360 |
| 96. | Ashland | 5.0% | 2.5%(+2.48)#96 | 3.1%(+1.92)#8,487 |
| 97. | South Amboy | 5.0% | 2.5%(+2.47)#97 | 3.1%(+1.92)#8,493 |
| 98. | Laurence Harbor | 5.0% | 2.5%(+2.44)#98 | 3.1%(+1.89)#8,557 |
| 99. | Gibbstown | 4.9% | 2.5%(+2.41)#99 | 3.1%(+1.86)#8,639 |
| 100. | Ellisburg | 4.9% | 2.5%(+2.39)#100 | 3.1%(+1.84)#8,679 |
Common Questions
What are the Top 10 Cities with the Highest Percentage of Population Employed in Installation, Maintenance & Repair in New Jersey?
Top 10 Cities with the Highest Percentage of Population Employed in Installation, Maintenance & Repair in New Jersey are:
#1
33.7%
#2
22.0%
#3
17.6%
#4
16.1%
#5
13.0%
#6
12.7%
#7
10.5%
#8
9.6%
#9
9.0%
#10
8.7%
What city has the Highest Percentage of Population Employed in Installation, Maintenance & Repair in New Jersey?
Hainesburg has the Highest Percentage of Population Employed in Installation, Maintenance & Repair in New Jersey with 33.7%.
What is the Percentage of Population Employed in Installation, Maintenance & Repair in the State of New Jersey?
Percentage of Population Employed in Installation, Maintenance & Repair in New Jersey is 2.5%.
What is the Percentage of Population Employed in Installation, Maintenance & Repair in the United States?
Percentage of Population Employed in Installation, Maintenance & Repair in the United States is 3.1%.