Cities with the Highest Percentage of Blackfeet Population in California
RELATED REPORTS & OPTIONS
Blackfeet
California
Compare Cities
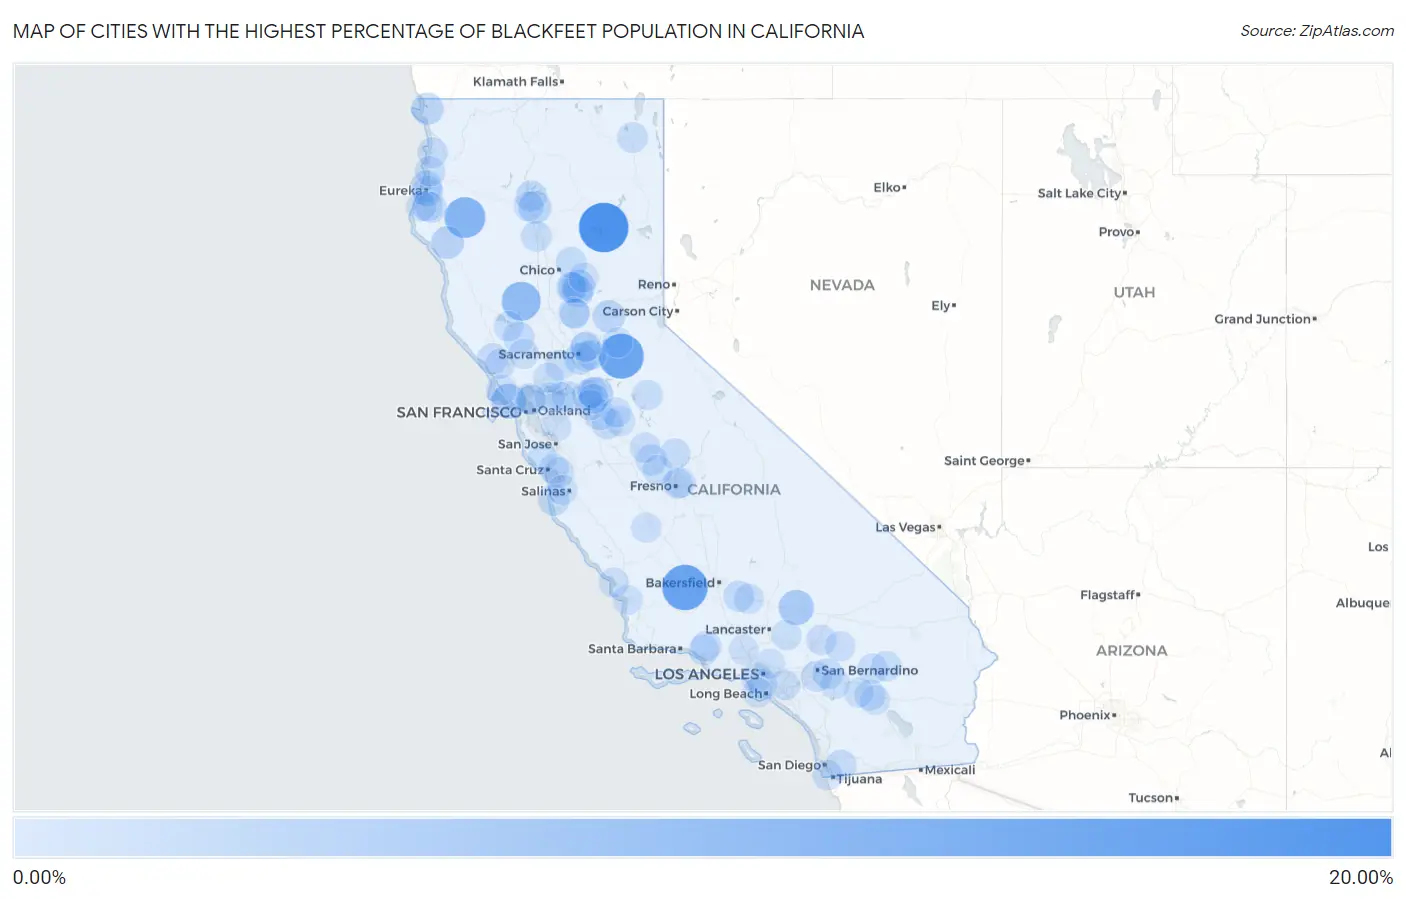
Map of Cities with the Highest Percentage of Blackfeet Population in California
0.00%
20.00%
Cities with the Highest Percentage of Blackfeet Population in California
| City | Blackfeet | vs State | vs National | |
| 1. | Clear Creek | 16.61% | 0.068%(+16.5)#1 | 0.062%(+16.6)#24 |
| 2. | Mckittrick | 12.90% | 0.068%(+12.8)#2 | 0.062%(+12.8)#31 |
| 3. | River Pines | 12.53% | 0.068%(+12.5)#3 | 0.062%(+12.5)#33 |
| 4. | Mad River | 9.01% | 0.068%(+8.94)#4 | 0.062%(+8.94)#44 |
| 5. | Lodoga | 7.46% | 0.068%(+7.39)#5 | 0.062%(+7.40)#56 |
| 6. | Boron | 4.29% | 0.068%(+4.23)#6 | 0.062%(+4.23)#103 |
| 7. | Bolinas | 4.22% | 0.068%(+4.15)#7 | 0.062%(+4.16)#105 |
| 8. | Waterloo | 2.98% | 0.068%(+2.91)#8 | 0.062%(+2.91)#148 |
| 9. | Oroville East | 2.38% | 0.068%(+2.31)#9 | 0.062%(+2.32)#178 |
| 10. | Garberville | 2.37% | 0.068%(+2.30)#10 | 0.062%(+2.31)#180 |
| 11. | Palo Cedro | 2.18% | 0.068%(+2.11)#11 | 0.062%(+2.12)#201 |
| 12. | Colfax | 1.97% | 0.068%(+1.91)#12 | 0.062%(+1.91)#229 |
| 13. | Fort Dick | 1.93% | 0.068%(+1.86)#13 | 0.062%(+1.87)#236 |
| 14. | Lemon Hill | 1.56% | 0.068%(+1.49)#14 | 0.062%(+1.50)#310 |
| 15. | Manila | 1.51% | 0.068%(+1.44)#15 | 0.062%(+1.45)#327 |
| 16. | Hidden Valley Lake | 1.44% | 0.068%(+1.37)#16 | 0.062%(+1.37)#345 |
| 17. | Palermo | 1.43% | 0.068%(+1.36)#17 | 0.062%(+1.37)#347 |
| 18. | Carmel By The Sea | 1.39% | 0.068%(+1.32)#18 | 0.062%(+1.33)#359 |
| 19. | Mountain Gate | 1.22% | 0.068%(+1.15)#19 | 0.062%(+1.16)#412 |
| 20. | Green Valley Cdp Los Angeles County | 1.20% | 0.068%(+1.13)#20 | 0.062%(+1.14)#418 |
| 21. | Bystrom | 1.12% | 0.068%(+1.05)#21 | 0.062%(+1.05)#440 |
| 22. | Chowchilla | 0.99% | 0.068%(+0.923)#22 | 0.062%(+0.929)#493 |
| 23. | Bear Valley Springs | 0.95% | 0.068%(+0.879)#23 | 0.062%(+0.885)#511 |
| 24. | Oroville | 0.93% | 0.068%(+0.864)#24 | 0.062%(+0.870)#523 |
| 25. | Magalia | 0.93% | 0.068%(+0.862)#25 | 0.062%(+0.869)#524 |
| 26. | San Pablo | 0.87% | 0.068%(+0.803)#26 | 0.062%(+0.810)#574 |
| 27. | Guerneville | 0.84% | 0.068%(+0.772)#27 | 0.062%(+0.778)#592 |
| 28. | Highgrove | 0.79% | 0.068%(+0.724)#28 | 0.062%(+0.731)#624 |
| 29. | Mentone | 0.77% | 0.068%(+0.705)#29 | 0.062%(+0.711)#642 |
| 30. | Hydesville | 0.75% | 0.068%(+0.687)#30 | 0.062%(+0.693)#654 |
| 31. | Camp Pendleton Mainside | 0.75% | 0.068%(+0.682)#31 | 0.062%(+0.689)#660 |
| 32. | Yosemite Lakes | 0.75% | 0.068%(+0.677)#32 | 0.062%(+0.684)#665 |
| 33. | Bakersfield Country Club | 0.73% | 0.068%(+0.665)#33 | 0.062%(+0.671)#678 |
| 34. | Tarpey Village | 0.72% | 0.068%(+0.653)#34 | 0.062%(+0.659)#691 |
| 35. | Jamul | 0.71% | 0.068%(+0.646)#35 | 0.062%(+0.653)#695 |
| 36. | Ripon | 0.71% | 0.068%(+0.640)#36 | 0.062%(+0.647)#700 |
| 37. | Thermalito | 0.71% | 0.068%(+0.639)#37 | 0.062%(+0.645)#702 |
| 38. | Eureka | 0.69% | 0.068%(+0.618)#38 | 0.062%(+0.625)#715 |
| 39. | Alturas | 0.67% | 0.068%(+0.603)#39 | 0.062%(+0.609)#735 |
| 40. | Marysville | 0.67% | 0.068%(+0.602)#40 | 0.062%(+0.609)#737 |
| 41. | Oakley | 0.66% | 0.068%(+0.596)#41 | 0.062%(+0.602)#744 |
| 42. | Red Bluff | 0.66% | 0.068%(+0.591)#42 | 0.062%(+0.597)#748 |
| 43. | Orick | 0.65% | 0.068%(+0.581)#43 | 0.062%(+0.588)#756 |
| 44. | Oak View | 0.62% | 0.068%(+0.550)#44 | 0.062%(+0.557)#791 |
| 45. | Inverness | 0.61% | 0.068%(+0.545)#45 | 0.062%(+0.551)#796 |
| 46. | Planada | 0.60% | 0.068%(+0.533)#46 | 0.062%(+0.539)#811 |
| 47. | Lincoln Village | 0.60% | 0.068%(+0.531)#47 | 0.062%(+0.537)#813 |
| 48. | Palm Desert | 0.60% | 0.068%(+0.529)#48 | 0.062%(+0.535)#818 |
| 49. | French Camp | 0.60% | 0.068%(+0.528)#49 | 0.062%(+0.534)#819 |
| 50. | Ojai | 0.59% | 0.068%(+0.523)#50 | 0.062%(+0.530)#827 |
| 51. | Morada | 0.54% | 0.068%(+0.472)#51 | 0.062%(+0.478)#887 |
| 52. | Joshua Tree | 0.52% | 0.068%(+0.450)#52 | 0.062%(+0.457)#924 |
| 53. | Rosemont | 0.51% | 0.068%(+0.444)#53 | 0.062%(+0.450)#931 |
| 54. | Mono Vista | 0.50% | 0.068%(+0.429)#54 | 0.062%(+0.436)#960 |
| 55. | Imperial Beach | 0.49% | 0.068%(+0.421)#55 | 0.062%(+0.428)#978 |
| 56. | Graton | 0.48% | 0.068%(+0.411)#56 | 0.062%(+0.417)#995 |
| 57. | Golden Hills | 0.47% | 0.068%(+0.397)#57 | 0.062%(+0.403)#1,012 |
| 58. | Ladera Heights | 0.46% | 0.068%(+0.394)#58 | 0.062%(+0.400)#1,017 |
| 59. | Apple Valley | 0.44% | 0.068%(+0.376)#59 | 0.062%(+0.383)#1,045 |
| 60. | La Selva Beach | 0.43% | 0.068%(+0.363)#60 | 0.062%(+0.369)#1,075 |
| 61. | Fortuna | 0.42% | 0.068%(+0.355)#61 | 0.062%(+0.362)#1,090 |
| 62. | Lake Los Angeles | 0.41% | 0.068%(+0.344)#62 | 0.062%(+0.351)#1,116 |
| 63. | Seacliff | 0.39% | 0.068%(+0.326)#63 | 0.062%(+0.333)#1,145 |
| 64. | Lucerne Valley | 0.39% | 0.068%(+0.318)#64 | 0.062%(+0.325)#1,164 |
| 65. | Westhaven Moonstone | 0.39% | 0.068%(+0.317)#65 | 0.062%(+0.324)#1,167 |
| 66. | Ferndale | 0.38% | 0.068%(+0.314)#66 | 0.062%(+0.321)#1,175 |
| 67. | Placentia | 0.38% | 0.068%(+0.308)#67 | 0.062%(+0.315)#1,193 |
| 68. | Twentynine Palms | 0.37% | 0.068%(+0.300)#68 | 0.062%(+0.306)#1,212 |
| 69. | La Quinta | 0.34% | 0.068%(+0.269)#69 | 0.062%(+0.276)#1,306 |
| 70. | Rancho Cordova | 0.34% | 0.068%(+0.268)#70 | 0.062%(+0.275)#1,313 |
| 71. | Antioch | 0.33% | 0.068%(+0.262)#71 | 0.062%(+0.269)#1,329 |
| 72. | Dixon | 0.33% | 0.068%(+0.262)#72 | 0.062%(+0.269)#1,330 |
| 73. | Sunol | 0.33% | 0.068%(+0.258)#73 | 0.062%(+0.265)#1,340 |
| 74. | Foothill Farms | 0.32% | 0.068%(+0.256)#74 | 0.062%(+0.263)#1,349 |
| 75. | Mayfair | 0.32% | 0.068%(+0.256)#75 | 0.062%(+0.263)#1,350 |
| 76. | Concord | 0.32% | 0.068%(+0.249)#76 | 0.062%(+0.255)#1,371 |
| 77. | Placerville | 0.32% | 0.068%(+0.248)#77 | 0.062%(+0.255)#1,373 |
| 78. | West Rancho Dominguez | 0.31% | 0.068%(+0.244)#78 | 0.062%(+0.250)#1,388 |
| 79. | North Highlands | 0.31% | 0.068%(+0.238)#79 | 0.062%(+0.244)#1,418 |
| 80. | Waterford | 0.31% | 0.068%(+0.237)#80 | 0.062%(+0.244)#1,420 |
| 81. | Madera | 0.30% | 0.068%(+0.234)#81 | 0.062%(+0.241)#1,433 |
| 82. | Berry Creek | 0.30% | 0.068%(+0.230)#82 | 0.062%(+0.237)#1,443 |
| 83. | Palm Springs | 0.29% | 0.068%(+0.226)#83 | 0.062%(+0.232)#1,461 |
| 84. | Angwin | 0.29% | 0.068%(+0.225)#84 | 0.062%(+0.231)#1,463 |
| 85. | Grover Beach | 0.29% | 0.068%(+0.222)#85 | 0.062%(+0.228)#1,478 |
| 86. | Oakdale | 0.29% | 0.068%(+0.217)#86 | 0.062%(+0.224)#1,487 |
| 87. | Linda | 0.28% | 0.068%(+0.207)#87 | 0.062%(+0.214)#1,515 |
| 88. | Suisun City | 0.27% | 0.068%(+0.201)#88 | 0.062%(+0.208)#1,533 |
| 89. | Marina | 0.26% | 0.068%(+0.188)#89 | 0.062%(+0.195)#1,585 |
| 90. | Coalinga | 0.25% | 0.068%(+0.184)#90 | 0.062%(+0.190)#1,606 |
| 91. | Clearlake Riviera | 0.25% | 0.068%(+0.179)#91 | 0.062%(+0.185)#1,637 |
| 92. | Beaumont | 0.24% | 0.068%(+0.177)#92 | 0.062%(+0.183)#1,641 |
| 93. | Redding | 0.24% | 0.068%(+0.176)#93 | 0.062%(+0.183)#1,645 |
| 94. | East Richmond Heights | 0.24% | 0.068%(+0.175)#94 | 0.062%(+0.182)#1,646 |
| 95. | Boulder Creek | 0.24% | 0.068%(+0.169)#95 | 0.062%(+0.175)#1,668 |
| 96. | Stevenson Ranch | 0.23% | 0.068%(+0.166)#96 | 0.062%(+0.173)#1,673 |
| 97. | Rolling Hills Estates | 0.23% | 0.068%(+0.163)#97 | 0.062%(+0.170)#1,687 |
| 98. | Altadena | 0.23% | 0.068%(+0.161)#98 | 0.062%(+0.168)#1,697 |
| 99. | Garden Acres | 0.23% | 0.068%(+0.159)#99 | 0.062%(+0.166)#1,704 |
| 100. | Morro Bay | 0.22% | 0.068%(+0.155)#100 | 0.062%(+0.161)#1,724 |
Common Questions
What are the Top 10 Cities with the Highest Percentage of Blackfeet Population in California?
Top 10 Cities with the Highest Percentage of Blackfeet Population in California are:
#1
16.61%
#2
12.90%
#3
12.53%
#4
9.01%
#5
7.46%
#6
4.29%
#7
4.22%
#8
2.98%
#9
2.38%
#10
2.37%
What city has the Highest Percentage of Blackfeet Population in California?
Clear Creek has the Highest Percentage of Blackfeet Population in California with 16.61%.
What is the Percentage of Blackfeet Population in the State of California?
Percentage of Blackfeet Population in California is 0.068%.
What is the Percentage of Blackfeet Population in the United States?
Percentage of Blackfeet Population in the United States is 0.062%.