Delaware Map & Demographics
Delaware Map
Delaware Overview
Dec 7, 1787
INCORPORATED
2,489
TOTAL AREA [ SQ MI ]
1,949
LAND AREA [ SQ MI ]
539
WATER AREA [ SQ MI ]
60
ELEVATION AVG [ FT ]
450
ELEVATION HIGH [ FT ]
Sea Level
ELEVATION LOW [ FT ]
509.8
POP DENSITY [ PPL / SQ MI ]
$42,180
PER CAPITA INCOME
$97,743
AVG FAMILY INCOME
$79,325
AVG HOUSEHOLD INCOME
24.3%
WAGE / INCOME GAP [ % ]
75.7¢/ $1
WAGE / INCOME GAP [ $ ]
$10,747
FAMILY INCOME DEFICIT
0.45
INEQUALITY / GINI INDEX
19720
LARGEST ZIP CODE
Wilmington
LARGEST CITY
New Castle County
LARGEST COUNTY
993,635
TOTAL POPULATION
482,909
MALE POPULATION
510,726
FEMALE POPULATION
94.55
MALES / 100 FEMALES
105.76
FEMALES / 100 MALES
41.4
MEDIAN AGE
3.1
AVG FAMILY SIZE
2.5
AVG HOUSEHOLD SIZE
505,419
LABOR FORCE [ PEOPLE ]
62.3%
PERCENT IN LABOR FORCE
5.4%
UNEMPLOYMENT RATE
Delaware Area Codes
Income in Delaware
Income Overview in Delaware
Per Capita Income in Delaware is $42,180, while median incomes of families and households are $97,743 and $79,325 respectively.
| Characteristic | Number | Measure |
| Per Capita Income | 993,635 | $42,180 |
| Median Family Income | 252,505 | $97,743 |
| Mean Family Income | 252,505 | $122,353 |
| Median Household Income | 389,000 | $79,325 |
| Mean Household Income | 389,000 | $104,600 |
| Income Deficit | 252,505 | $10,747 |
| Wage / Income Gap (%) | 993,635 | 24.32% |
| Wage / Income Gap ($) | 993,635 | 75.68¢ per $1 |
| Gini / Inequality Index | 993,635 | 0.45 |
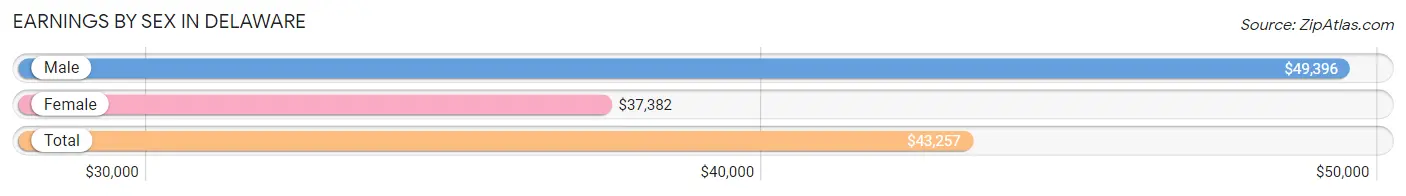
Earnings by Sex in Delaware
Average Earnings in Delaware are $43,257, $49,396 for men and $37,382 for women, a difference of 24.3%.
| Sex | Number | Average Earnings |
| Male | 269,519 (50.9%) | $49,396 |
| Female | 259,848 (49.1%) | $37,382 |
| Total | 529,367 (100.0%) | $43,257 |
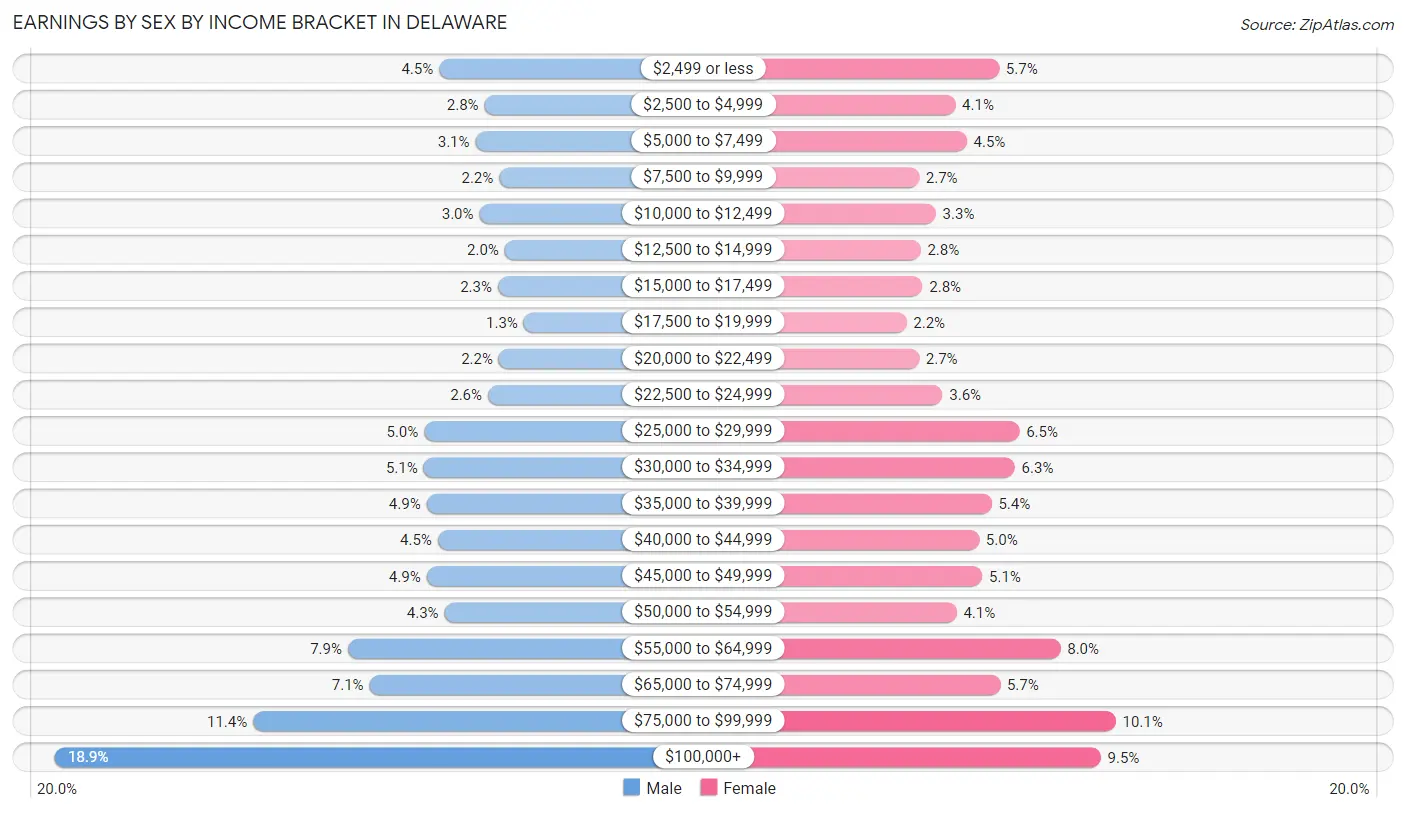
Earnings by Sex by Income Bracket in Delaware
The most common earnings brackets in Delaware are $100,000+ for men (50,825 | 18.9%) and $75,000 to $99,999 for women (26,169 | 10.1%).
| Income | Male | Female |
| $2,499 or less | 12,046 (4.5%) | 14,814 (5.7%) |
| $2,500 to $4,999 | 7,468 (2.8%) | 10,540 (4.1%) |
| $5,000 to $7,499 | 8,382 (3.1%) | 11,680 (4.5%) |
| $7,500 to $9,999 | 5,992 (2.2%) | 7,024 (2.7%) |
| $10,000 to $12,499 | 7,980 (3.0%) | 8,655 (3.3%) |
| $12,500 to $14,999 | 5,416 (2.0%) | 7,170 (2.8%) |
| $15,000 to $17,499 | 6,127 (2.3%) | 7,347 (2.8%) |
| $17,500 to $19,999 | 3,498 (1.3%) | 5,797 (2.2%) |
| $20,000 to $22,499 | 6,006 (2.2%) | 7,028 (2.7%) |
| $22,500 to $24,999 | 7,103 (2.6%) | 9,291 (3.6%) |
| $25,000 to $29,999 | 13,550 (5.0%) | 16,775 (6.5%) |
| $30,000 to $34,999 | 13,604 (5.1%) | 16,354 (6.3%) |
| $35,000 to $39,999 | 13,316 (4.9%) | 14,073 (5.4%) |
| $40,000 to $44,999 | 12,192 (4.5%) | 12,870 (5.0%) |
| $45,000 to $49,999 | 13,322 (4.9%) | 13,170 (5.1%) |
| $50,000 to $54,999 | 11,517 (4.3%) | 10,686 (4.1%) |
| $55,000 to $64,999 | 21,266 (7.9%) | 20,788 (8.0%) |
| $65,000 to $74,999 | 19,071 (7.1%) | 14,909 (5.7%) |
| $75,000 to $99,999 | 30,838 (11.4%) | 26,169 (10.1%) |
| $100,000+ | 50,825 (18.9%) | 24,708 (9.5%) |
| Total | 269,519 (100.0%) | 259,848 (100.0%) |
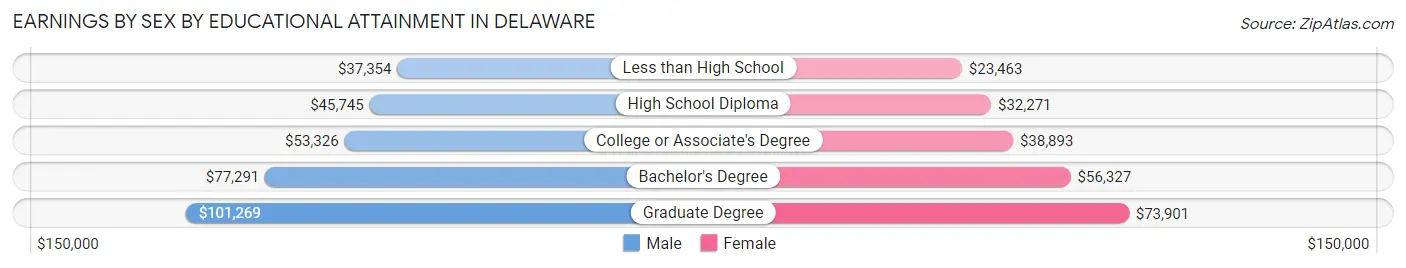
Earnings by Sex by Educational Attainment in Delaware
Average earnings in Delaware are $56,439 for men and $44,305 for women, a difference of 21.5%. Men with an educational attainment of graduate degree enjoy the highest average annual earnings of $101,269, while those with less than high school education earn the least with $37,354. Women with an educational attainment of graduate degree earn the most with the average annual earnings of $73,901, while those with less than high school education have the smallest earnings of $23,463.
| Educational Attainment | Male Income | Female Income |
| Less than High School | $37,354 | $23,463 |
| High School Diploma | $45,745 | $32,271 |
| College or Associate's Degree | $53,326 | $38,893 |
| Bachelor's Degree | $77,291 | $56,327 |
| Graduate Degree | $101,269 | $73,901 |
| Total | $56,439 | $44,305 |
Family Income in Delaware
Family Income Brackets in Delaware
According to the Delaware family income data, there are 55,804 families falling into the $100,000 to $149,999 income range, which is the most common income bracket and makes up 22.1% of all families. Conversely, the $10,000 to $14,999 income bracket is the least frequent group with only 4,293 families (1.7%) belonging to this category.
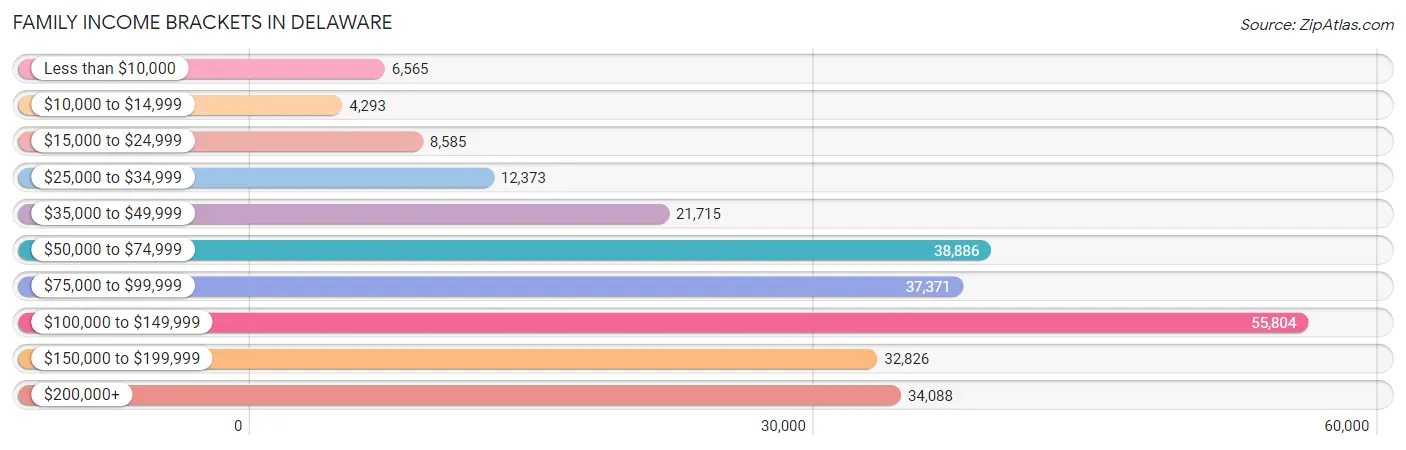
| Income Bracket | # Families | % Families |
| Less than $10,000 | 6,565 | 2.6% |
| $10,000 to $14,999 | 4,293 | 1.7% |
| $15,000 to $24,999 | 8,585 | 3.4% |
| $25,000 to $34,999 | 12,373 | 4.9% |
| $35,000 to $49,999 | 21,715 | 8.6% |
| $50,000 to $74,999 | 38,886 | 15.4% |
| $75,000 to $99,999 | 37,371 | 14.8% |
| $100,000 to $149,999 | 55,804 | 22.1% |
| $150,000 to $199,999 | 32,826 | 13.0% |
| $200,000+ | 34,088 | 13.5% |
Family Income by Famaliy Size in Delaware
4-person families (42,570 | 16.9%) account for the highest median family income in Delaware with $120,963 per family, while 2-person families (127,500 | 50.5%) have the highest median income of $44,324 per family member.
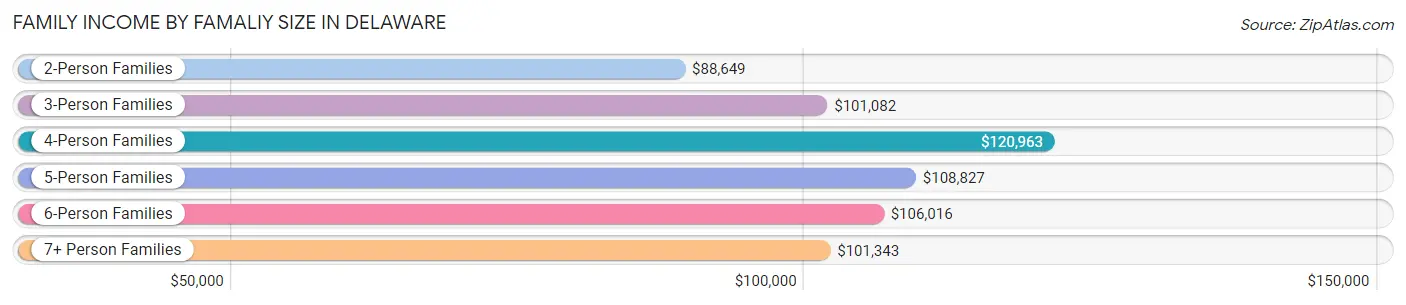
| Income Bracket | # Families | Median Income |
| 2-Person Families | 127,500 (50.5%) | $88,649 |
| 3-Person Families | 57,414 (22.7%) | $101,082 |
| 4-Person Families | 42,570 (16.9%) | $120,963 |
| 5-Person Families | 15,878 (6.3%) | $108,827 |
| 6-Person Families | 5,877 (2.3%) | $106,016 |
| 7+ Person Families | 3,266 (1.3%) | $101,343 |
| Total | 252,505 (100.0%) | $97,743 |
Family Income by Number of Earners in Delaware
The median family income in Delaware is $97,743, with families comprising 3+ earners (30,216) having the highest median family income of $148,983, while families with no earners (44,012) have the lowest median family income of $65,399, accounting for 12.0% and 17.4% of families, respectively.
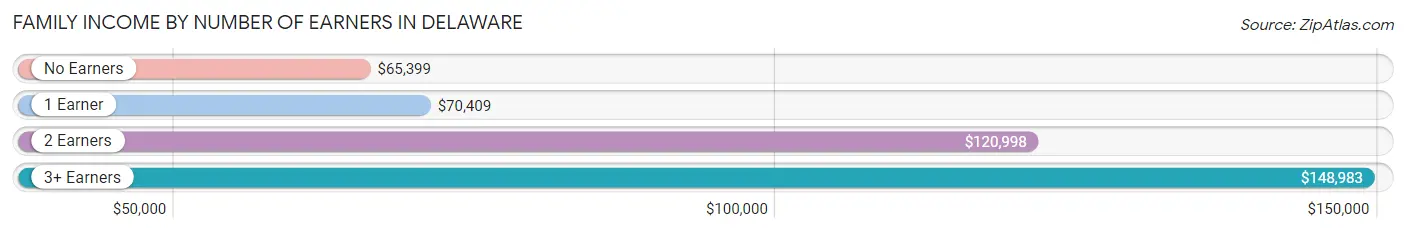
| Number of Earners | # Families | Median Income |
| No Earners | 44,012 (17.4%) | $65,399 |
| 1 Earner | 79,020 (31.3%) | $70,409 |
| 2 Earners | 99,257 (39.3%) | $120,998 |
| 3+ Earners | 30,216 (12.0%) | $148,983 |
| Total | 252,505 (100.0%) | $97,743 |
Household Income in Delaware
Household Income Brackets in Delaware
With 71,187 households falling in the category, the $100,000 to $149,999 income range is the most frequent in Delaware, accounting for 18.3% of all households. In contrast, only 12,059 households (3.1%) fall into the $10,000 to $14,999 income bracket, making it the least populous group.
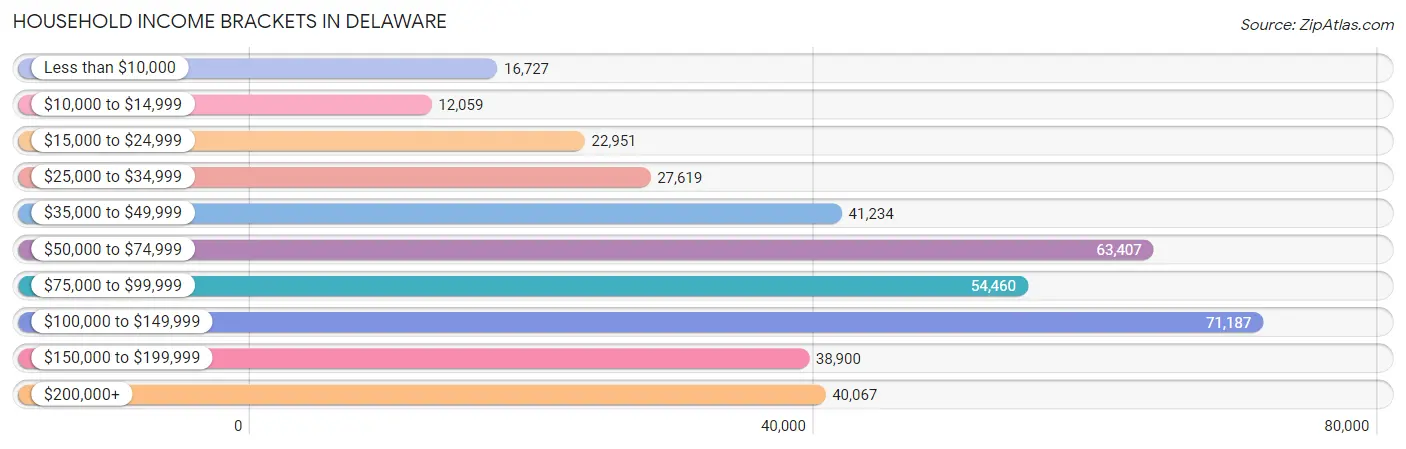
| Income Bracket | # Households | % Households |
| Less than $10,000 | 16,727 | 4.3% |
| $10,000 to $14,999 | 12,059 | 3.1% |
| $15,000 to $24,999 | 22,951 | 5.9% |
| $25,000 to $34,999 | 27,619 | 7.1% |
| $35,000 to $49,999 | 41,234 | 10.6% |
| $50,000 to $74,999 | 63,407 | 16.3% |
| $75,000 to $99,999 | 54,460 | 14.0% |
| $100,000 to $149,999 | 71,187 | 18.3% |
| $150,000 to $199,999 | 38,900 | 10.0% |
| $200,000+ | 40,067 | 10.3% |
Household Income by Householder Age in Delaware
The median household income in Delaware is $79,325, with the highest median household income of $93,881 found in the 45 to 64 years age bracket for the primary householder. A total of 145,280 households (37.3%) fall into this category. Meanwhile, the 15 to 24 years age bracket for the primary householder has the lowest median household income of $39,968, with 9,917 households (2.5%) in this group.
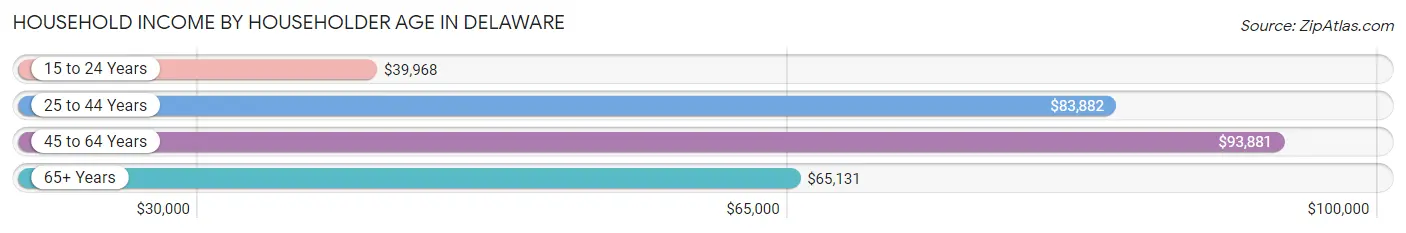
| Income Bracket | # Households | Median Income |
| 15 to 24 Years | 9,917 (2.5%) | $39,968 |
| 25 to 44 Years | 113,377 (29.1%) | $83,882 |
| 45 to 64 Years | 145,280 (37.3%) | $93,881 |
| 65+ Years | 120,426 (31.0%) | $65,131 |
| Total | 389,000 (100.0%) | $79,325 |
Poverty in Delaware
Income Below Poverty by Sex and Age in Delaware
With 10.0% poverty level for males and 12.2% for females among the residents of Delaware, 5 year old males and 18 to 24 year old females are the most vulnerable to poverty, with 1,271 males (22.1%) and 7,054 females (19.4%) in their respective age groups living below the poverty level.
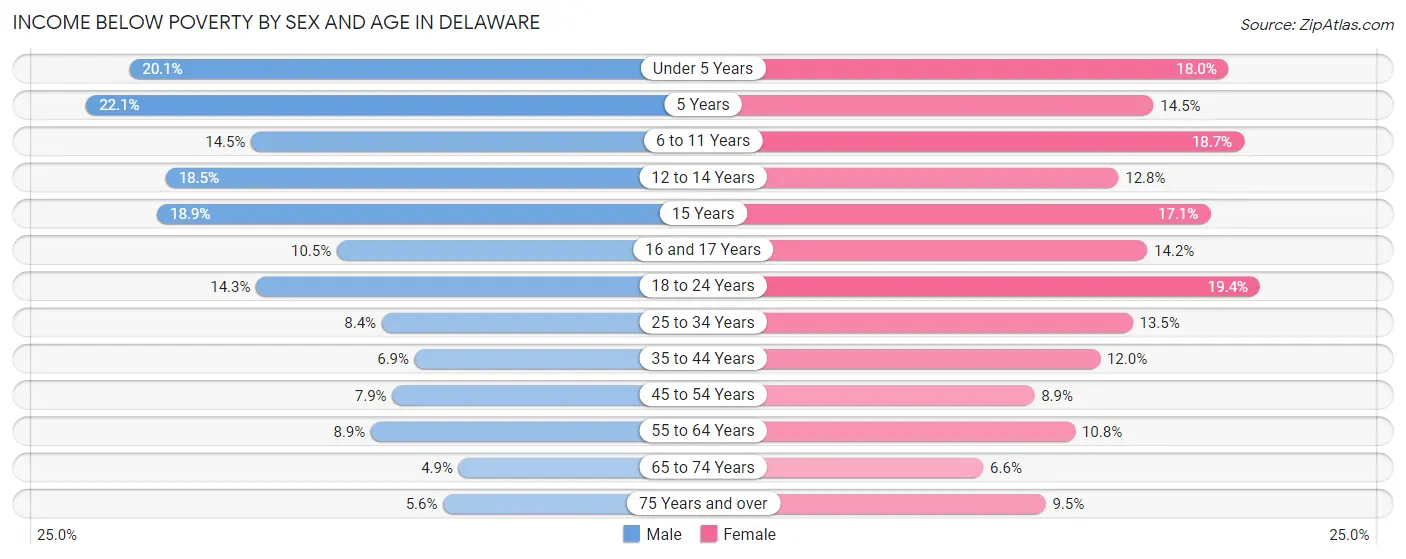
| Age Bracket | Male | Female |
| Under 5 Years | 5,396 (20.1%) | 4,644 (17.9%) |
| 5 Years | 1,271 (22.1%) | 693 (14.5%) |
| 6 to 11 Years | 4,800 (14.5%) | 6,313 (18.7%) |
| 12 to 14 Years | 3,534 (18.4%) | 2,234 (12.8%) |
| 15 Years | 1,142 (18.9%) | 998 (17.1%) |
| 16 and 17 Years | 1,273 (10.5%) | 1,698 (14.2%) |
| 18 to 24 Years | 5,512 (14.2%) | 7,054 (19.4%) |
| 25 to 34 Years | 5,252 (8.4%) | 8,581 (13.5%) |
| 35 to 44 Years | 3,934 (6.9%) | 7,135 (12.0%) |
| 45 to 54 Years | 4,510 (7.9%) | 5,457 (8.9%) |
| 55 to 64 Years | 5,887 (8.9%) | 7,958 (10.8%) |
| 65 to 74 Years | 2,622 (4.9%) | 4,099 (6.6%) |
| 75 Years and over | 1,799 (5.6%) | 3,994 (9.5%) |
| Total | 46,932 (10.0%) | 60,858 (12.2%) |
Income Above Poverty by Sex and Age in Delaware
According to the poverty statistics in Delaware, males aged 65 to 74 years and females aged 65 to 74 years are the age groups that are most secure financially, with 95.2% of males and 93.4% of females in these age groups living above the poverty line.
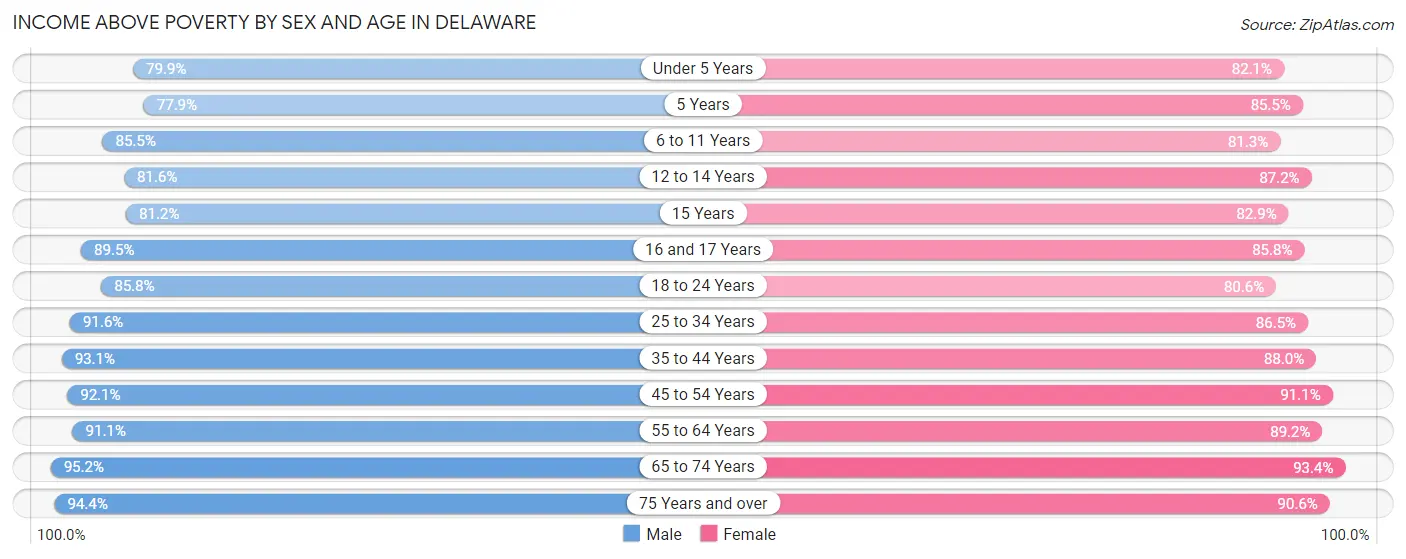
| Age Bracket | Male | Female |
| Under 5 Years | 21,400 (79.9%) | 21,227 (82.1%) |
| 5 Years | 4,469 (77.9%) | 4,099 (85.5%) |
| 6 to 11 Years | 28,349 (85.5%) | 27,526 (81.3%) |
| 12 to 14 Years | 15,624 (81.6%) | 15,185 (87.2%) |
| 15 Years | 4,916 (81.1%) | 4,840 (82.9%) |
| 16 and 17 Years | 10,855 (89.5%) | 10,287 (85.8%) |
| 18 to 24 Years | 33,174 (85.8%) | 29,306 (80.6%) |
| 25 to 34 Years | 57,115 (91.6%) | 55,028 (86.5%) |
| 35 to 44 Years | 53,137 (93.1%) | 52,438 (88.0%) |
| 45 to 54 Years | 52,373 (92.1%) | 55,651 (91.1%) |
| 55 to 64 Years | 60,145 (91.1%) | 65,574 (89.2%) |
| 65 to 74 Years | 51,411 (95.2%) | 58,384 (93.4%) |
| 75 Years and over | 30,505 (94.4%) | 38,267 (90.5%) |
| Total | 423,473 (90.0%) | 437,812 (87.8%) |
Income Below Poverty Among Married-Couple Families in Delaware
The poverty statistics for married-couple families in Delaware show that 3.7% or 6,827 of the total 184,317 families live below the poverty line. Families with 5 or more children have the highest poverty rate of 17.7%, comprising of 148 families. On the other hand, families with no children have the lowest poverty rate of 2.8%, which includes 3,364 families.
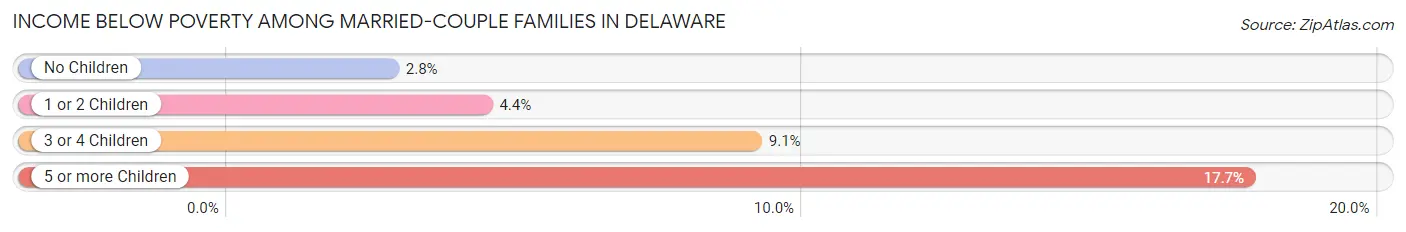
| Children | Above Poverty | Below Poverty |
| No Children | 116,901 (97.2%) | 3,364 (2.8%) |
| 1 or 2 Children | 49,913 (95.6%) | 2,313 (4.4%) |
| 3 or 4 Children | 9,989 (90.9%) | 1,002 (9.1%) |
| 5 or more Children | 687 (82.3%) | 148 (17.7%) |
| Total | 177,490 (96.3%) | 6,827 (3.7%) |
Income Below Poverty Among Single-Parent Households in Delaware
According to the poverty data in Delaware, 10.2% or 2,004 single-father households and 20.9% or 10,119 single-mother households are living below the poverty line. Among single-father households, those with 3 or 4 children have the highest poverty rate, with 326 households (35.5%) experiencing poverty. Likewise, among single-mother households, those with 5 or more children have the highest poverty rate, with 244 households (63.7%) falling below the poverty line.
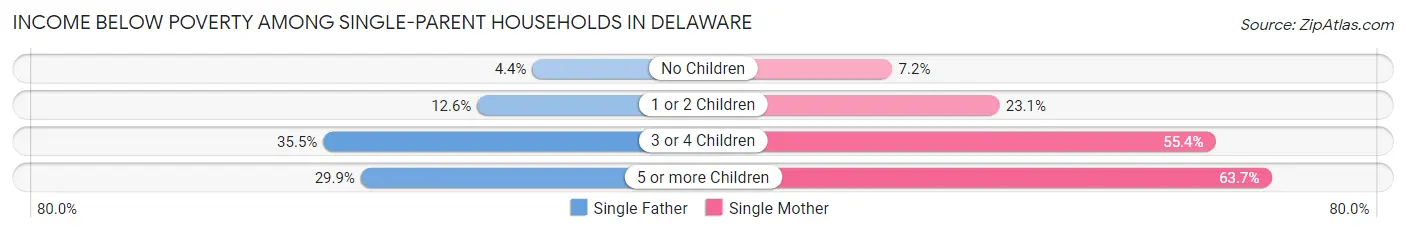
| Children | Single Father | Single Mother |
| No Children | 376 (4.3%) | 1,297 (7.1%) |
| 1 or 2 Children | 1,264 (12.6%) | 5,719 (23.1%) |
| 3 or 4 Children | 326 (35.5%) | 2,859 (55.4%) |
| 5 or more Children | 38 (29.9%) | 244 (63.7%) |
| Total | 2,004 (10.2%) | 10,119 (20.9%) |
Income Below Poverty Among Married-Couple vs Single-Parent Households in Delaware
The poverty data for Delaware shows that 6,827 of the married-couple family households (3.7%) and 12,123 of the single-parent households (17.8%) are living below the poverty level. Within the married-couple family households, those with 5 or more children have the highest poverty rate, with 148 households (17.7%) falling below the poverty line. Among the single-parent households, those with 5 or more children have the highest poverty rate, with 282 household (55.3%) living below poverty.
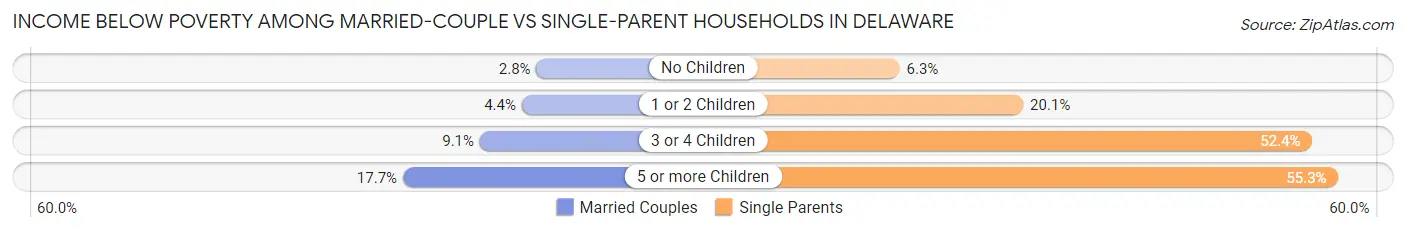
| Children | Married-Couple Families | Single-Parent Households |
| No Children | 3,364 (2.8%) | 1,673 (6.2%) |
| 1 or 2 Children | 2,313 (4.4%) | 6,983 (20.1%) |
| 3 or 4 Children | 1,002 (9.1%) | 3,185 (52.4%) |
| 5 or more Children | 148 (17.7%) | 282 (55.3%) |
| Total | 6,827 (3.7%) | 12,123 (17.8%) |
Largest Zip Codes by Population in Delaware
The largest zip codes in Delaware by population are 19720 (60,514), 19702 (56,571), 19711 (49,746), 19709 (48,954), and 19701 (44,553).
1.19720
60,514 (6.09%)
2.19702
56,571 (5.69%)
3.19711
49,746 (5.01%)
4.19709
48,954 (4.93%)
5.19701
44,553 (4.48%)
6.19805
39,610 (3.99%)
7.19901
39,097 (3.93%)
8.19808
38,107 (3.84%)
9.19904
37,387 (3.76%)
10.19966
32,513 (3.27%)
11.19713
29,952 (3.01%)
12.19958
28,761 (2.89%)
13.19977
26,204 (2.64%)
14.19973
26,070 (2.62%)
15.19802
26,065 (2.62%)
16.19810
25,569 (2.57%)
17.19803
21,437 (2.16%)
18.19963
21,394 (2.15%)
19.19947
19,513 (1.96%)
20.19804
17,986 (1.81%)
21.19707
17,011 (1.71%)
22.19801
16,545 (1.67%)
23.19703
16,376 (1.65%)
24.19956
15,822 (1.59%)
25.19809
15,529 (1.56%)
26.19968
15,125 (1.52%)
27.19971
15,043 (1.51%)
28.19934
14,566 (1.47%)
29.19734
14,026 (1.41%)
30.19943
12,600 (1.27%)
Largest Cities by Population in Delaware
The largest cities in Delaware by population are Wilmington (71,034), Dover (38,879), Newark (30,655), Middletown (23,573), and Bear (23,070).
71,034 (7.15%)
2.Dover
38,879 (3.91%)
3.Newark
30,655 (3.09%)
23,573 (2.37%)
5.Bear
23,070 (2.32%)
6.Glasgow
15,405 (1.55%)
14,331 (1.44%)
13,878 (1.40%)
9.Smyrna
12,870 (1.30%)
10.Milford
11,714 (1.18%)
11,452 (1.15%)
12.Claymont
10,191 (1.03%)
13.North Star
8,370 (0.84%)
8,260 (0.83%)
15.Seaford
8,055 (0.81%)
16.Georgetown
7,247 (0.73%)
17.Pike Creek
6,975 (0.70%)
18.Millsboro
6,876 (0.69%)
19.Edgemoor
6,485 (0.65%)
20.Elsmere
6,194 (0.62%)
21.New Castle
5,523 (0.56%)
4,060 (0.41%)
23.Clayton
3,978 (0.40%)
24.Laurel
3,954 (0.40%)
25.Camden
3,914 (0.39%)
3,892 (0.39%)
27.Harrington
3,770 (0.38%)
28.Milton
3,349 (0.34%)
29.Lewes
3,339 (0.34%)
3,262 (0.33%)
Largest Counties by Population in Delaware
The largest counties in Delaware by population are New Castle County (570,567), Sussex County (240,668), and Kent County (182,400).
182,400 (18.36%)
Race in Delaware
The most populous races in Delaware are White / Caucasian (634,244 | 63.8%), Black / African American (218,266 | 22.0%), and Hispanic or Latino (98,696 | 9.9%).
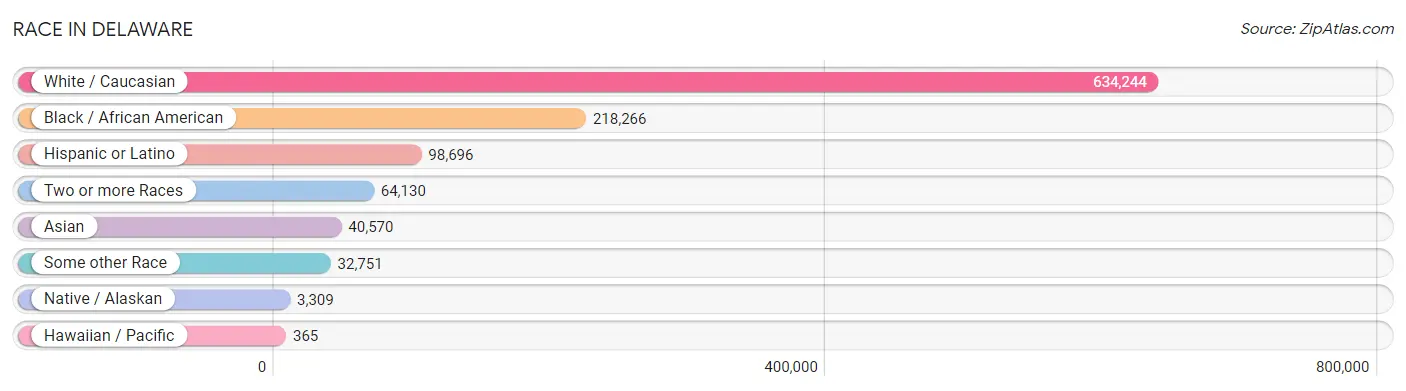
| Race | # Population | % Population |
| Asian | 40,570 | 4.1% |
| Black / African American | 218,266 | 22.0% |
| Hawaiian / Pacific | 365 | 0.0% |
| Hispanic or Latino | 98,696 | 9.9% |
| Native / Alaskan | 3,309 | 0.3% |
| White / Caucasian | 634,244 | 63.8% |
| Two or more Races | 64,130 | 6.5% |
| Some other Race | 32,751 | 3.3% |
| Total | 993,635 | 100.0% |
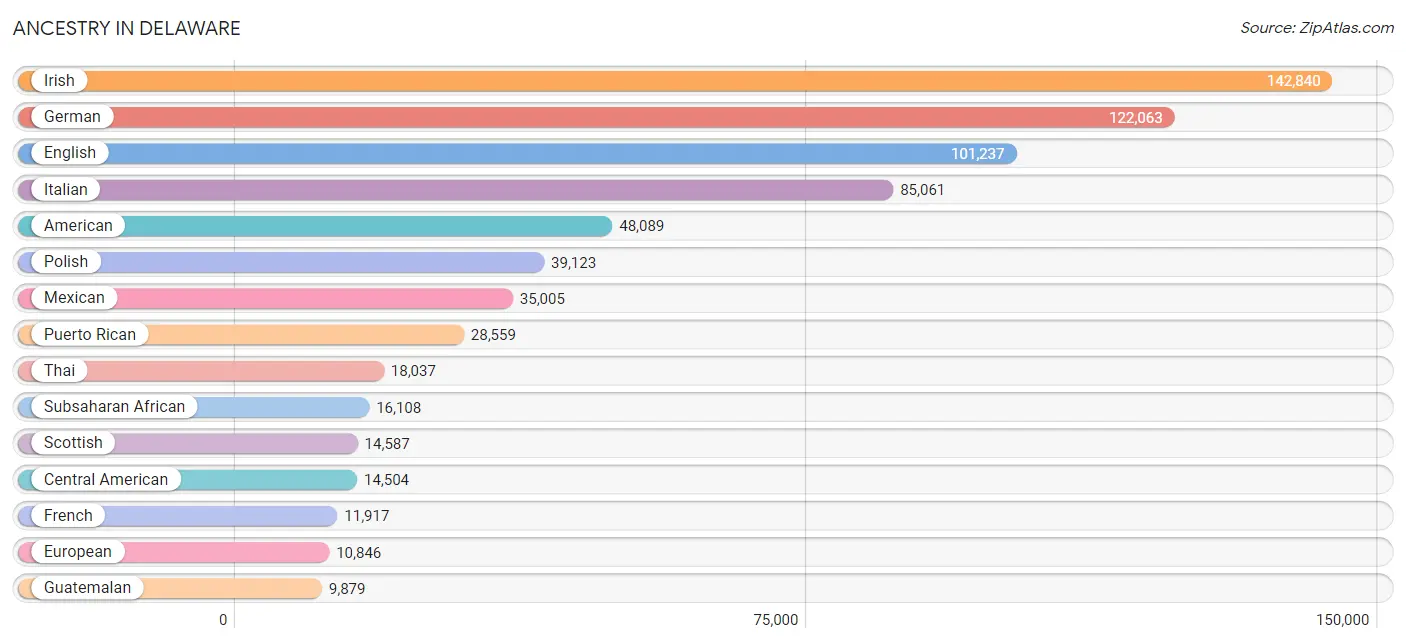
Ancestry in Delaware
The most populous ancestries reported in Delaware are Irish (142,840 | 14.4%), German (122,063 | 12.3%), English (101,237 | 10.2%), Italian (85,061 | 8.6%), and American (48,089 | 4.8%), together accounting for 50.2% of all Delaware residents.
| Ancestry | # Population | % Population |
| Afghan | 237 | 0.0% |
| African | 7,613 | 0.8% |
| Albanian | 159 | 0.0% |
| Aleut | 3 | 0.0% |
| Alsatian | 22 | 0.0% |
| American | 48,089 | 4.8% |
| Apache | 151 | 0.0% |
| Arab | 3,898 | 0.4% |
| Argentinean | 1,111 | 0.1% |
| Armenian | 268 | 0.0% |
| Assyrian / Chaldean / Syriac | 44 | 0.0% |
| Australian | 146 | 0.0% |
| Austrian | 2,147 | 0.2% |
| Bangladeshi | 60 | 0.0% |
| Barbadian | 146 | 0.0% |
| Belgian | 403 | 0.0% |
| Belizean | 22 | 0.0% |
| Bermudan | 204 | 0.0% |
| Bhutanese | 1,766 | 0.2% |
| Blackfeet | 712 | 0.1% |
| Bolivian | 156 | 0.0% |
| Brazilian | 304 | 0.0% |
| British | 5,196 | 0.5% |
| British West Indian | 385 | 0.0% |
| Bulgarian | 516 | 0.1% |
| Burmese | 2,878 | 0.3% |
| Cajun | 75 | 0.0% |
| Cambodian | 37 | 0.0% |
| Canadian | 1,416 | 0.1% |
| Cape Verdean | 27 | 0.0% |
| Carpatho Rusyn | 28 | 0.0% |
| Celtic | 114 | 0.0% |
| Central American | 14,504 | 1.5% |
| Central American Indian | 770 | 0.1% |
| Cherokee | 2,193 | 0.2% |
| Chickasaw | 113 | 0.0% |
| Chilean | 965 | 0.1% |
| Chippewa | 70 | 0.0% |
| Choctaw | 209 | 0.0% |
| Colombian | 2,307 | 0.2% |
| Colville | 1 | 0.0% |
| Costa Rican | 486 | 0.1% |
| Creek | 68 | 0.0% |
| Croatian | 446 | 0.0% |
| Crow | 13 | 0.0% |
| Cuban | 1,539 | 0.2% |
| Cypriot | 2 | 0.0% |
| Czech | 1,681 | 0.2% |
| Czechoslovakian | 496 | 0.1% |
| Danish | 1,235 | 0.1% |
| Delaware | 985 | 0.1% |
| Dominican | 5,880 | 0.6% |
| Dutch | 8,327 | 0.8% |
| Dutch West Indian | 33 | 0.0% |
| Eastern European | 2,984 | 0.3% |
| Ecuadorian | 1,409 | 0.1% |
| Egyptian | 574 | 0.1% |
| English | 101,237 | 10.2% |
| Estonian | 261 | 0.0% |
| Ethiopian | 566 | 0.1% |
| European | 10,846 | 1.1% |
| Filipino | 557 | 0.1% |
| Finnish | 523 | 0.1% |
| French | 11,917 | 1.2% |
| French American Indian | 9 | 0.0% |
| French Canadian | 3,115 | 0.3% |
| German | 122,063 | 12.3% |
| German Russian | 90 | 0.0% |
| Ghanaian | 1,121 | 0.1% |
| Greek | 4,653 | 0.5% |
| Guamanian / Chamorro | 139 | 0.0% |
| Guatemalan | 9,879 | 1.0% |
| Guyanese | 392 | 0.0% |
| Haitian | 5,023 | 0.5% |
| Honduran | 1,201 | 0.1% |
| Hungarian | 3,928 | 0.4% |
| Icelander | 28 | 0.0% |
| Indian (Asian) | 9,683 | 1.0% |
| Indonesian | 39 | 0.0% |
| Inupiat | 75 | 0.0% |
| Iranian | 470 | 0.1% |
| Iraqi | 6 | 0.0% |
| Irish | 142,840 | 14.4% |
| Iroquois | 223 | 0.0% |
| Israeli | 88 | 0.0% |
| Italian | 85,061 | 8.6% |
| Jamaican | 5,594 | 0.6% |
| Japanese | 125 | 0.0% |
| Jordanian | 64 | 0.0% |
| Kenyan | 997 | 0.1% |
| Korean | 6,868 | 0.7% |
| Laotian | 291 | 0.0% |
| Latvian | 282 | 0.0% |
| Lebanese | 799 | 0.1% |
| Liberian | 1,009 | 0.1% |
| Lithuanian | 2,761 | 0.3% |
| Lumbee | 23 | 0.0% |
| Luxembourger | 61 | 0.0% |
| Macedonian | 57 | 0.0% |
| Malaysian | 238 | 0.0% |
| Maltese | 53 | 0.0% |
| Mexican | 35,005 | 3.5% |
| Mexican American Indian | 339 | 0.0% |
| Mongolian | 65 | 0.0% |
| Moroccan | 356 | 0.0% |
| Native Hawaiian | 449 | 0.1% |
| Navajo | 263 | 0.0% |
| New Zealander | 7 | 0.0% |
| Nicaraguan | 310 | 0.0% |
| Nigerian | 3,253 | 0.3% |
| Northern European | 1,012 | 0.1% |
| Norwegian | 4,465 | 0.4% |
| Osage | 31 | 0.0% |
| Ottawa | 7 | 0.0% |
| Paiute | 3 | 0.0% |
| Pakistani | 470 | 0.1% |
| Palestinian | 72 | 0.0% |
| Panamanian | 883 | 0.1% |
| Paraguayan | 44 | 0.0% |
| Pennsylvania German | 2,088 | 0.2% |
| Peruvian | 1,006 | 0.1% |
| Polish | 39,123 | 3.9% |
| Portuguese | 1,538 | 0.2% |
| Potawatomi | 38 | 0.0% |
| Puerto Rican | 28,559 | 2.9% |
| Romanian | 681 | 0.1% |
| Russian | 6,625 | 0.7% |
| Salvadoran | 1,733 | 0.2% |
| Samoan | 135 | 0.0% |
| Scandinavian | 1,321 | 0.1% |
| Scotch-Irish | 5,777 | 0.6% |
| Scottish | 14,587 | 1.5% |
| Seminole | 96 | 0.0% |
| Serbian | 209 | 0.0% |
| Shoshone | 2 | 0.0% |
| Sierra Leonean | 251 | 0.0% |
| Sioux | 147 | 0.0% |
| Slavic | 385 | 0.0% |
| Slovak | 1,874 | 0.2% |
| Slovene | 230 | 0.0% |
| South African | 402 | 0.0% |
| South American | 7,474 | 0.7% |
| South American Indian | 331 | 0.0% |
| Soviet Union | 9 | 0.0% |
| Spaniard | 1,807 | 0.2% |
| Spanish | 1,498 | 0.2% |
| Spanish American | 53 | 0.0% |
| Spanish American Indian | 96 | 0.0% |
| Sri Lankan | 2,824 | 0.3% |
| Subsaharan African | 16,108 | 1.6% |
| Sudanese | 55 | 0.0% |
| Swedish | 6,084 | 0.6% |
| Swiss | 2,077 | 0.2% |
| Syrian | 156 | 0.0% |
| Thai | 18,037 | 1.8% |
| Tongan | 25 | 0.0% |
| Trinidadian and Tobagonian | 1,137 | 0.1% |
| Turkish | 1,759 | 0.2% |
| U.S. Virgin Islander | 55 | 0.0% |
| Ugandan | 51 | 0.0% |
| Ukrainian | 4,533 | 0.5% |
| Uruguayan | 40 | 0.0% |
| Venezuelan | 423 | 0.0% |
| Vietnamese | 1,091 | 0.1% |
| Welsh | 7,201 | 0.7% |
| West Indian | 1,060 | 0.1% |
| Yugoslavian | 354 | 0.0% | View All 167 Rows |
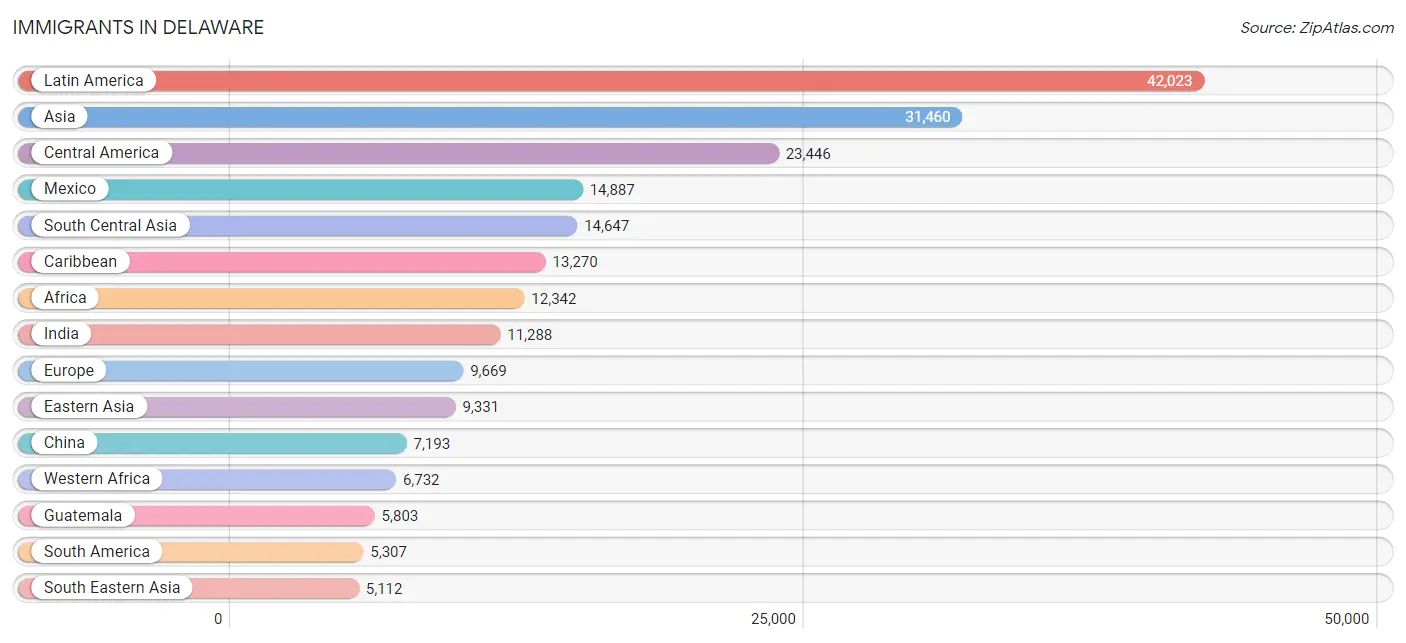
Immigrants in Delaware
The most numerous immigrant groups reported in Delaware came from Latin America (42,023 | 4.2%), Asia (31,460 | 3.2%), Central America (23,446 | 2.4%), Mexico (14,887 | 1.5%), and South Central Asia (14,647 | 1.5%), together accounting for 12.7% of all Delaware residents.
| Immigration Origin | # Population | % Population |
| Afghanistan | 174 | 0.0% |
| Africa | 12,342 | 1.2% |
| Albania | 48 | 0.0% |
| Argentina | 638 | 0.1% |
| Armenia | 5 | 0.0% |
| Asia | 31,460 | 3.2% |
| Australia | 143 | 0.0% |
| Austria | 80 | 0.0% |
| Azores | 4 | 0.0% |
| Bahamas | 10 | 0.0% |
| Bangladesh | 768 | 0.1% |
| Barbados | 218 | 0.0% |
| Belarus | 47 | 0.0% |
| Belgium | 6 | 0.0% |
| Belize | 10 | 0.0% |
| Bolivia | 100 | 0.0% |
| Brazil | 533 | 0.1% |
| Bulgaria | 374 | 0.0% |
| Cambodia | 13 | 0.0% |
| Cameroon | 713 | 0.1% |
| Canada | 1,345 | 0.1% |
| Caribbean | 13,270 | 1.3% |
| Central America | 23,446 | 2.4% |
| Chile | 553 | 0.1% |
| China | 7,193 | 0.7% |
| Colombia | 1,286 | 0.1% |
| Costa Rica | 282 | 0.0% |
| Croatia | 16 | 0.0% |
| Cuba | 545 | 0.1% |
| Czechoslovakia | 105 | 0.0% |
| Denmark | 13 | 0.0% |
| Dominica | 159 | 0.0% |
| Dominican Republic | 2,996 | 0.3% |
| Eastern Africa | 2,440 | 0.3% |
| Eastern Asia | 9,331 | 0.9% |
| Eastern Europe | 3,267 | 0.3% |
| Ecuador | 417 | 0.0% |
| Egypt | 322 | 0.0% |
| El Salvador | 1,038 | 0.1% |
| England | 1,297 | 0.1% |
| Eritrea | 130 | 0.0% |
| Ethiopia | 269 | 0.0% |
| Europe | 9,669 | 1.0% |
| France | 194 | 0.0% |
| Germany | 1,552 | 0.2% |
| Ghana | 1,557 | 0.2% |
| Greece | 451 | 0.1% |
| Grenada | 139 | 0.0% |
| Guatemala | 5,803 | 0.6% |
| Guyana | 659 | 0.1% |
| Haiti | 3,686 | 0.4% |
| Honduras | 950 | 0.1% |
| Hong Kong | 776 | 0.1% |
| Hungary | 269 | 0.0% |
| India | 11,288 | 1.1% |
| Indonesia | 40 | 0.0% |
| Iran | 302 | 0.0% |
| Iraq | 6 | 0.0% |
| Ireland | 211 | 0.0% |
| Israel | 107 | 0.0% |
| Italy | 846 | 0.1% |
| Jamaica | 3,727 | 0.4% |
| Japan | 503 | 0.1% |
| Jordan | 78 | 0.0% |
| Kazakhstan | 43 | 0.0% |
| Kenya | 1,717 | 0.2% |
| Korea | 1,635 | 0.2% |
| Kuwait | 26 | 0.0% |
| Laos | 144 | 0.0% |
| Latin America | 42,023 | 4.2% |
| Latvia | 155 | 0.0% |
| Lebanon | 255 | 0.0% |
| Liberia | 1,373 | 0.1% |
| Lithuania | 48 | 0.0% |
| Malaysia | 162 | 0.0% |
| Mexico | 14,887 | 1.5% |
| Middle Africa | 955 | 0.1% |
| Moldova | 70 | 0.0% |
| Morocco | 329 | 0.0% |
| Nepal | 180 | 0.0% |
| Netherlands | 434 | 0.0% |
| Nicaragua | 40 | 0.0% |
| Nigeria | 2,919 | 0.3% |
| North Macedonia | 8 | 0.0% |
| Northern Africa | 776 | 0.1% |
| Northern Europe | 2,337 | 0.2% |
| Norway | 25 | 0.0% |
| Oceania | 157 | 0.0% |
| Pakistan | 1,518 | 0.2% |
| Panama | 436 | 0.0% |
| Peru | 577 | 0.1% |
| Philippines | 3,065 | 0.3% |
| Poland | 591 | 0.1% |
| Portugal | 145 | 0.0% |
| Romania | 182 | 0.0% |
| Russia | 911 | 0.1% |
| Saudi Arabia | 88 | 0.0% |
| Scotland | 201 | 0.0% |
| Serbia | 100 | 0.0% |
| Sierra Leone | 399 | 0.0% |
| Singapore | 30 | 0.0% |
| South Africa | 355 | 0.0% |
| South America | 5,307 | 0.5% |
| South Central Asia | 14,647 | 1.5% |
| South Eastern Asia | 5,112 | 0.5% |
| Southern Europe | 1,740 | 0.2% |
| Spain | 294 | 0.0% |
| Sri Lanka | 174 | 0.0% |
| St. Vincent and the Grenadines | 101 | 0.0% |
| Sudan | 63 | 0.0% |
| Sweden | 22 | 0.0% |
| Switzerland | 59 | 0.0% |
| Syria | 34 | 0.0% |
| Taiwan | 834 | 0.1% |
| Thailand | 247 | 0.0% |
| Trinidad and Tobago | 1,386 | 0.1% |
| Turkey | 1,064 | 0.1% |
| Uganda | 53 | 0.0% |
| Ukraine | 199 | 0.0% |
| Uruguay | 18 | 0.0% |
| Uzbekistan | 19 | 0.0% |
| Venezuela | 445 | 0.0% |
| Vietnam | 1,388 | 0.1% |
| West Indies | 40 | 0.0% |
| Western Africa | 6,732 | 0.7% |
| Western Asia | 2,353 | 0.2% |
| Western Europe | 2,325 | 0.2% |
| Yemen | 420 | 0.0% |
| Zaire | 170 | 0.0% |
| Zimbabwe | 102 | 0.0% | View All 130 Rows |
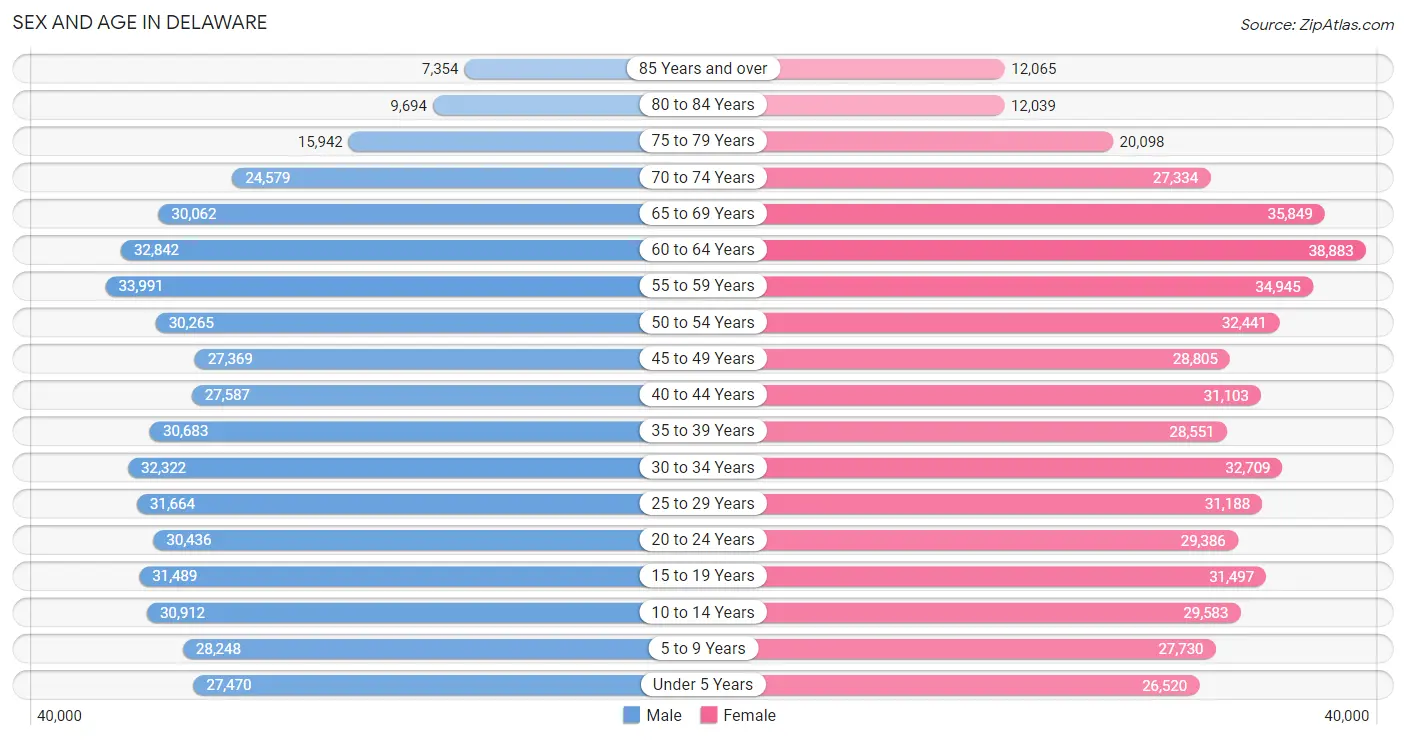
Sex and Age in Delaware
Sex and Age in Delaware
The most populous age groups in Delaware are 55 to 59 Years (33,991 | 7.0%) for men and 60 to 64 Years (38,883 | 7.6%) for women.
| Age Bracket | Male | Female |
| Under 5 Years | 27,470 (5.7%) | 26,520 (5.2%) |
| 5 to 9 Years | 28,248 (5.9%) | 27,730 (5.4%) |
| 10 to 14 Years | 30,912 (6.4%) | 29,583 (5.8%) |
| 15 to 19 Years | 31,489 (6.5%) | 31,497 (6.2%) |
| 20 to 24 Years | 30,436 (6.3%) | 29,386 (5.8%) |
| 25 to 29 Years | 31,664 (6.6%) | 31,188 (6.1%) |
| 30 to 34 Years | 32,322 (6.7%) | 32,709 (6.4%) |
| 35 to 39 Years | 30,683 (6.4%) | 28,551 (5.6%) |
| 40 to 44 Years | 27,587 (5.7%) | 31,103 (6.1%) |
| 45 to 49 Years | 27,369 (5.7%) | 28,805 (5.6%) |
| 50 to 54 Years | 30,265 (6.3%) | 32,441 (6.4%) |
| 55 to 59 Years | 33,991 (7.0%) | 34,945 (6.8%) |
| 60 to 64 Years | 32,842 (6.8%) | 38,883 (7.6%) |
| 65 to 69 Years | 30,062 (6.2%) | 35,849 (7.0%) |
| 70 to 74 Years | 24,579 (5.1%) | 27,334 (5.3%) |
| 75 to 79 Years | 15,942 (3.3%) | 20,098 (3.9%) |
| 80 to 84 Years | 9,694 (2.0%) | 12,039 (2.4%) |
| 85 Years and over | 7,354 (1.5%) | 12,065 (2.4%) |
| Total | 482,909 (100.0%) | 510,726 (100.0%) |
Families and Households in Delaware
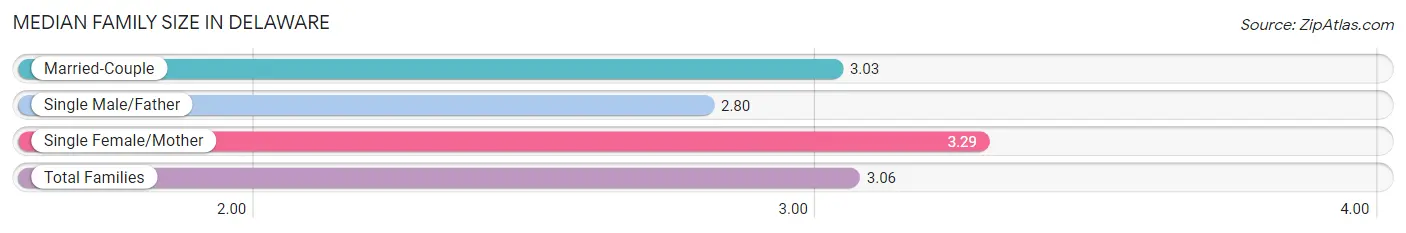
Median Family Size in Delaware
The median family size in Delaware is 3.06 persons per family, with single female/mother families (48,439 | 19.2%) accounting for the largest median family size of 3.29 persons per family. On the other hand, single male/father families (19,749 | 7.8%) represent the smallest median family size with 2.80 persons per family.
| Family Type | # Families | Family Size |
| Married-Couple | 184,317 (73.0%) | 3.03 |
| Single Male/Father | 19,749 (7.8%) | 2.80 |
| Single Female/Mother | 48,439 (19.2%) | 3.29 |
| Total Families | 252,505 (100.0%) | 3.06 |
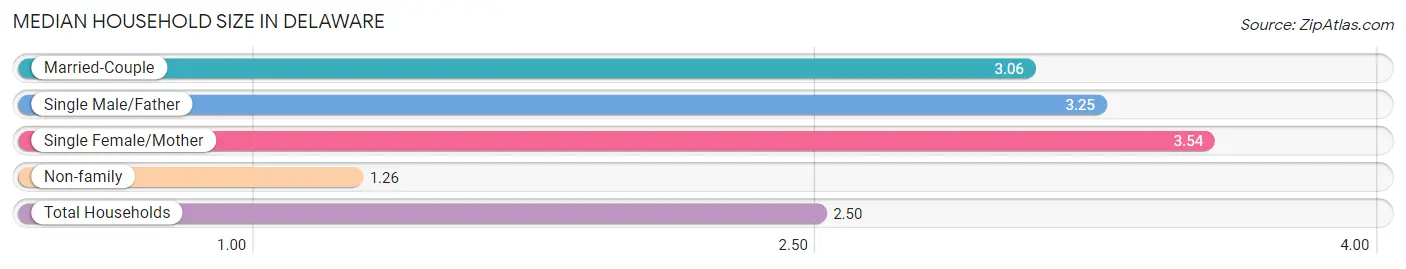
Median Household Size in Delaware
The median household size in Delaware is 2.50 persons per household, with single female/mother households (48,439 | 12.4%) accounting for the largest median household size of 3.54 persons per household. non-family households (136,495 | 35.1%) represent the smallest median household size with 1.26 persons per household.
| Household Type | # Households | Household Size |
| Married-Couple | 184,317 (47.4%) | 3.06 |
| Single Male/Father | 19,749 (5.1%) | 3.25 |
| Single Female/Mother | 48,439 (12.4%) | 3.54 |
| Non-family | 136,495 (35.1%) | 1.26 |
| Total Households | 389,000 (100.0%) | 2.50 |
Household Size by Marriage Status in Delaware
Out of a total of 389,000 households in Delaware, 252,505 (64.9%) are family households, while 136,495 (35.1%) are nonfamily households. The most numerous type of family households are 2-person households, comprising 119,379, and the most common type of nonfamily households are 1-person households, comprising 112,123.
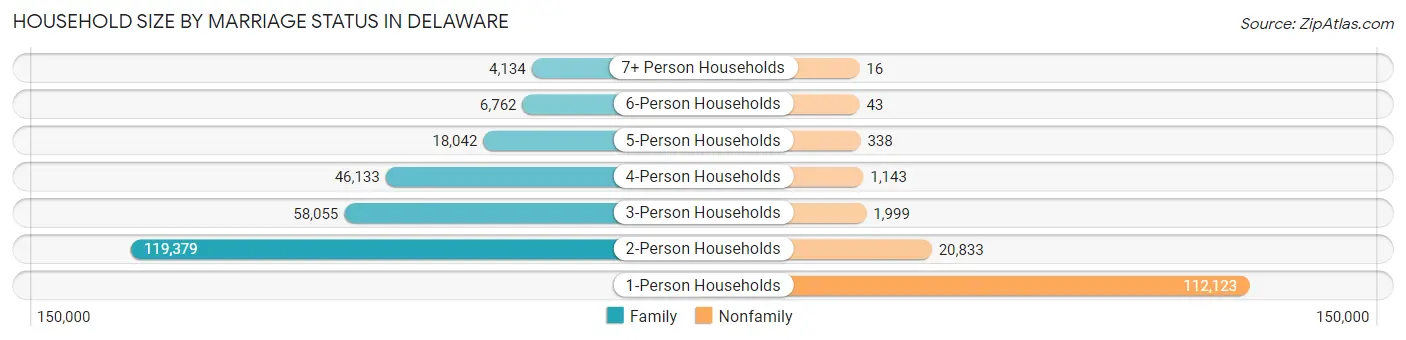
| Household Size | Family Households | Nonfamily Households |
| 1-Person Households | - | 112,123 (28.8%) |
| 2-Person Households | 119,379 (30.7%) | 20,833 (5.4%) |
| 3-Person Households | 58,055 (14.9%) | 1,999 (0.5%) |
| 4-Person Households | 46,133 (11.9%) | 1,143 (0.3%) |
| 5-Person Households | 18,042 (4.6%) | 338 (0.1%) |
| 6-Person Households | 6,762 (1.7%) | 43 (0.0%) |
| 7+ Person Households | 4,134 (1.1%) | 16 (0.0%) |
| Total | 252,505 (64.9%) | 136,495 (35.1%) |
Female Fertility in Delaware
Fertility by Age in Delaware
Average fertility rate in Delaware is 47.0 births per 1,000 women. Women in the age bracket of 20 to 34 years have the highest fertility rate with 77.0 births per 1,000 women. Women in the age bracket of 20 to 34 years acount for 70.5% of all women with births.
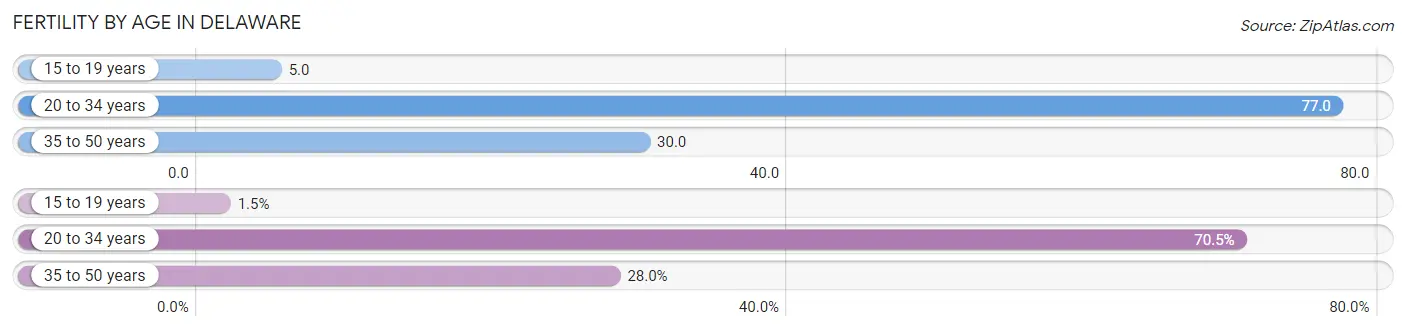
| Age Bracket | Women with Births | Births / 1,000 Women |
| 15 to 19 years | 158 (1.5%) | 5.0 |
| 20 to 34 years | 7,214 (70.5%) | 77.0 |
| 35 to 50 years | 2,865 (28.0%) | 30.0 |
| Total | 10,237 (100.0%) | 47.0 |
Fertility by Age by Marriage Status in Delaware
63.9% of women with births (10,237) in Delaware are married. The highest percentage of unmarried women with births falls into 15 to 19 years age bracket with 100.0% of them unmarried at the time of birth, while the lowest percentage of unmarried women with births belong to 35 to 50 years age bracket with 25.0% of them unmarried.
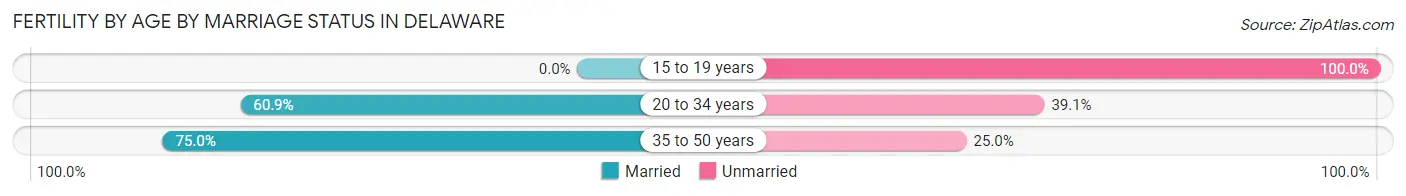
| Age Bracket | Married | Unmarried |
| 15 to 19 years | 0 (0.0%) | 158 (100.0%) |
| 20 to 34 years | 4,393 (60.9%) | 2,821 (39.1%) |
| 35 to 50 years | 2,149 (75.0%) | 716 (25.0%) |
| Total | 6,541 (63.9%) | 3,696 (36.1%) |
Fertility by Education in Delaware
Average fertility rate in Delaware is 47.0 births per 1,000 women. Women with the education attainment of graduate degree have the highest fertility rate of 57.0 births per 1,000 women, while women with the education attainment of less than high school have the lowest fertility at 34.0 births per 1,000 women. Women with the education attainment of college or associate's degree represent 32.7% of all women with births.
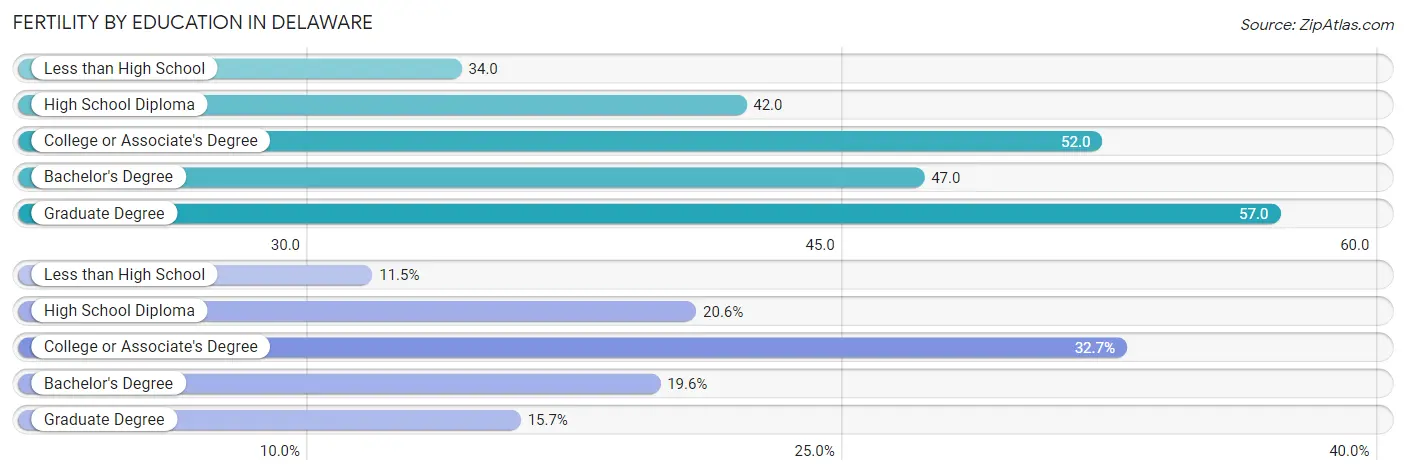
| Educational Attainment | Women with Births | Births / 1,000 Women |
| Less than High School | 1,176 (11.5%) | 34.0 |
| High School Diploma | 2,108 (20.6%) | 42.0 |
| College or Associate's Degree | 3,346 (32.7%) | 52.0 |
| Bachelor's Degree | 2,004 (19.6%) | 47.0 |
| Graduate Degree | 1,603 (15.7%) | 57.0 |
| Total | 10,237 (100.0%) | 47.0 |
Fertility by Education by Marriage Status in Delaware
36.1% of women with births in Delaware are unmarried. Women with the educational attainment of graduate degree are most likely to be married with 90.8% of them married at childbirth, while women with the educational attainment of high school diploma are least likely to be married with 51.9% of them unmarried at childbirth.
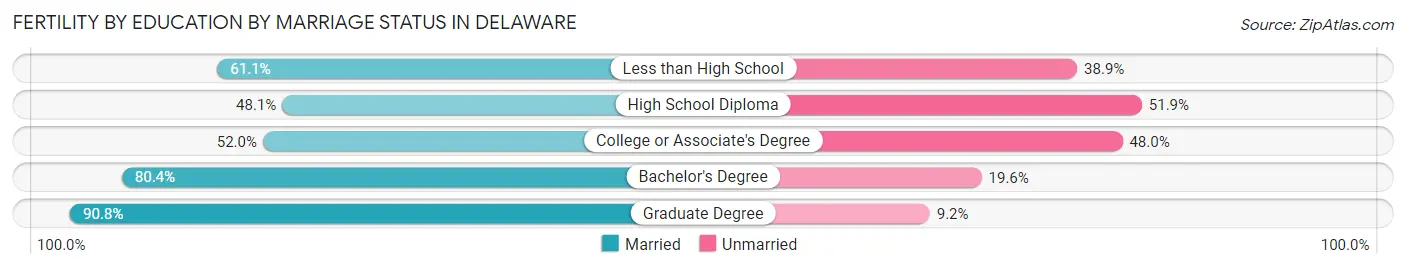
| Educational Attainment | Married | Unmarried |
| Less than High School | 719 (61.1%) | 457 (38.9%) |
| High School Diploma | 1,014 (48.1%) | 1,094 (51.9%) |
| College or Associate's Degree | 1,740 (52.0%) | 1,606 (48.0%) |
| Bachelor's Degree | 1,611 (80.4%) | 393 (19.6%) |
| Graduate Degree | 1,456 (90.8%) | 147 (9.2%) |
| Total | 6,541 (63.9%) | 3,696 (36.1%) |
Employment Characteristics in Delaware
Employment by Class of Employer in Delaware
Among the 468,881 employed individuals in Delaware, private company employees (309,451 | 66.0%), not-for-profit organizations (42,482 | 9.1%), and state government employees (39,841 | 8.5%) make up the most common classes of employment.
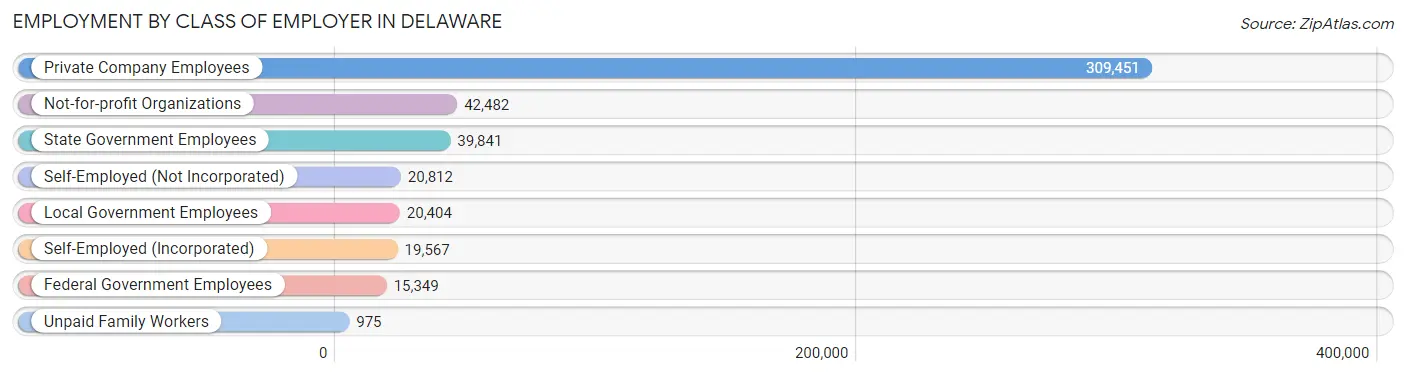
| Employer Class | # Employees | % Employees |
| Private Company Employees | 309,451 | 66.0% |
| Self-Employed (Incorporated) | 19,567 | 4.2% |
| Self-Employed (Not Incorporated) | 20,812 | 4.4% |
| Not-for-profit Organizations | 42,482 | 9.1% |
| Local Government Employees | 20,404 | 4.3% |
| State Government Employees | 39,841 | 8.5% |
| Federal Government Employees | 15,349 | 3.3% |
| Unpaid Family Workers | 975 | 0.2% |
| Total | 468,881 | 100.0% |
Employment Status by Age in Delaware
According to the labor force statistics for Delaware, out of the total population over 16 years of age (811,267), 62.3% or 505,419 individuals are in the labor force, with 5.4% or 27,293 of them unemployed. The age group with the highest labor force participation rate is 30 to 34 years, with 85.9% or 55,862 individuals in the labor force. Within the labor force, the 16 to 19 years age range has the highest percentage of unemployed individuals, with 13.4% or 3,019 of them being unemployed.
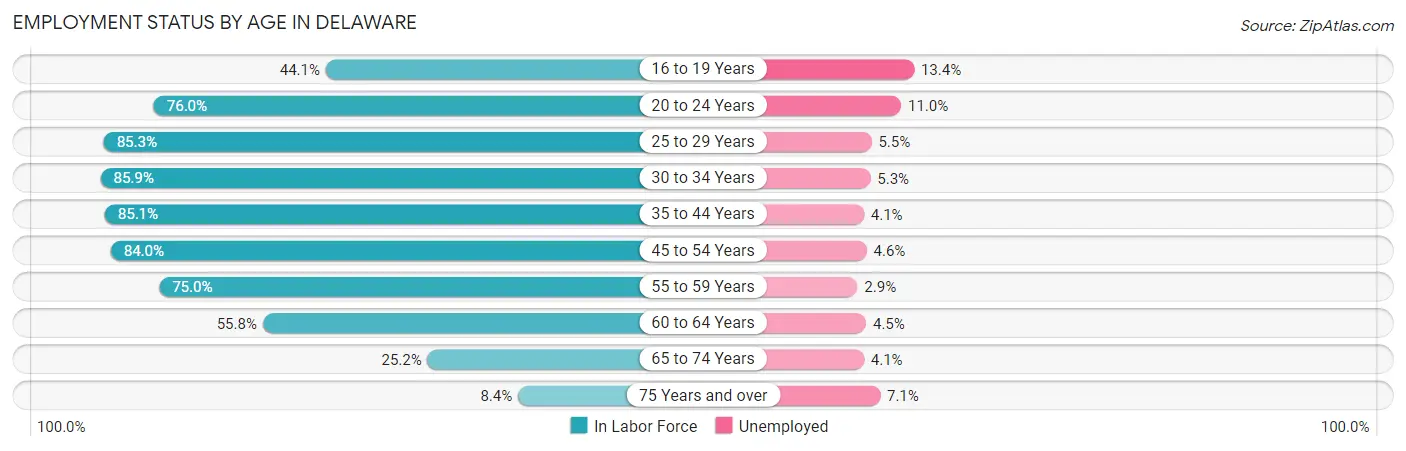
| Age Bracket | In Labor Force | Unemployed |
| 16 to 19 Years | 22,527 (44.1%) | 3,019 (13.4%) |
| 20 to 24 Years | 45,465 (76.0%) | 5,001 (11.0%) |
| 25 to 29 Years | 53,613 (85.3%) | 2,949 (5.5%) |
| 30 to 34 Years | 55,862 (85.9%) | 2,961 (5.3%) |
| 35 to 44 Years | 100,353 (85.1%) | 4,114 (4.1%) |
| 45 to 54 Years | 99,859 (84.0%) | 4,594 (4.6%) |
| 55 to 59 Years | 51,702 (75.0%) | 1,499 (2.9%) |
| 60 to 64 Years | 40,023 (55.8%) | 1,801 (4.5%) |
| 65 to 74 Years | 29,692 (25.2%) | 1,217 (4.1%) |
| 75 Years and over | 6,484 (8.4%) | 460 (7.1%) |
| Total | 505,419 (62.3%) | 27,293 (5.4%) |
Employment Status by Educational Attainment in Delaware
According to labor force statistics for Delaware, 79.5% of individuals (401,752) out of the total population between 25 and 64 years of age (505,348) are in the labor force, with 4.4% or 17,677 of them being unemployed. The group with the highest labor force participation rate are those with the educational attainment of bachelor's degree or higher, with 86.8% or 154,197 individuals in the labor force. Within the labor force, individuals with high school diploma education have the highest percentage of unemployment, with 6.5% or 6,987 of them being unemployed.
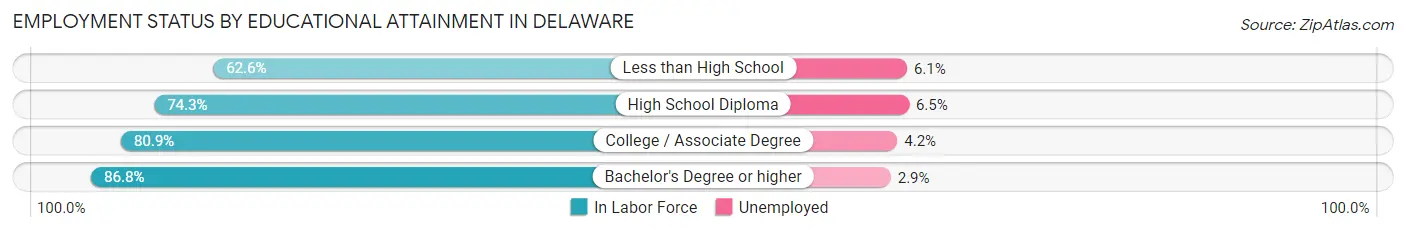
| Educational Attainment | In Labor Force | Unemployed |
| Less than High School | 28,285 (62.6%) | 2,756 (6.1%) |
| High School Diploma | 107,485 (74.3%) | 9,403 (6.5%) |
| College / Associate Degree | 111,526 (80.9%) | 5,790 (4.2%) |
| Bachelor's Degree or higher | 154,197 (86.8%) | 5,152 (2.9%) |
| Total | 401,752 (79.5%) | 22,235 (4.4%) |
Employment Occupations by Sex in Delaware
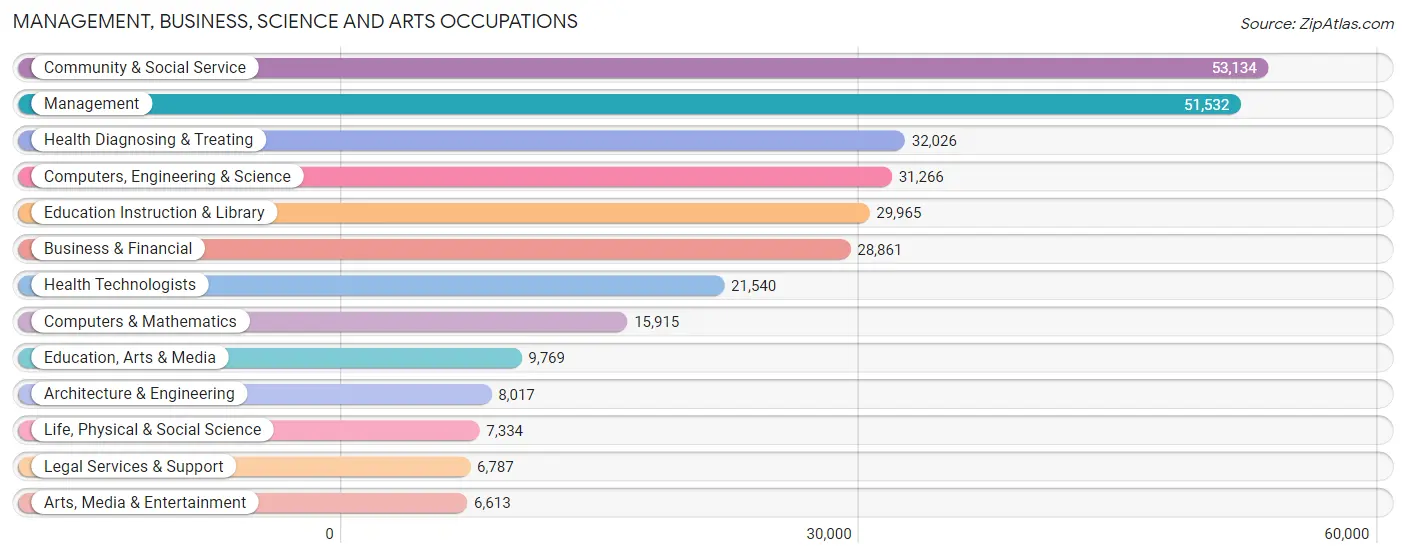
Management, Business, Science and Arts Occupations
The most common Management, Business, Science and Arts occupations in Delaware are Community & Social Service (53,134 | 11.2%), Management (51,532 | 10.9%), Health Diagnosing & Treating (32,026 | 6.8%), Computers, Engineering & Science (31,266 | 6.6%), and Education Instruction & Library (29,965 | 6.3%).
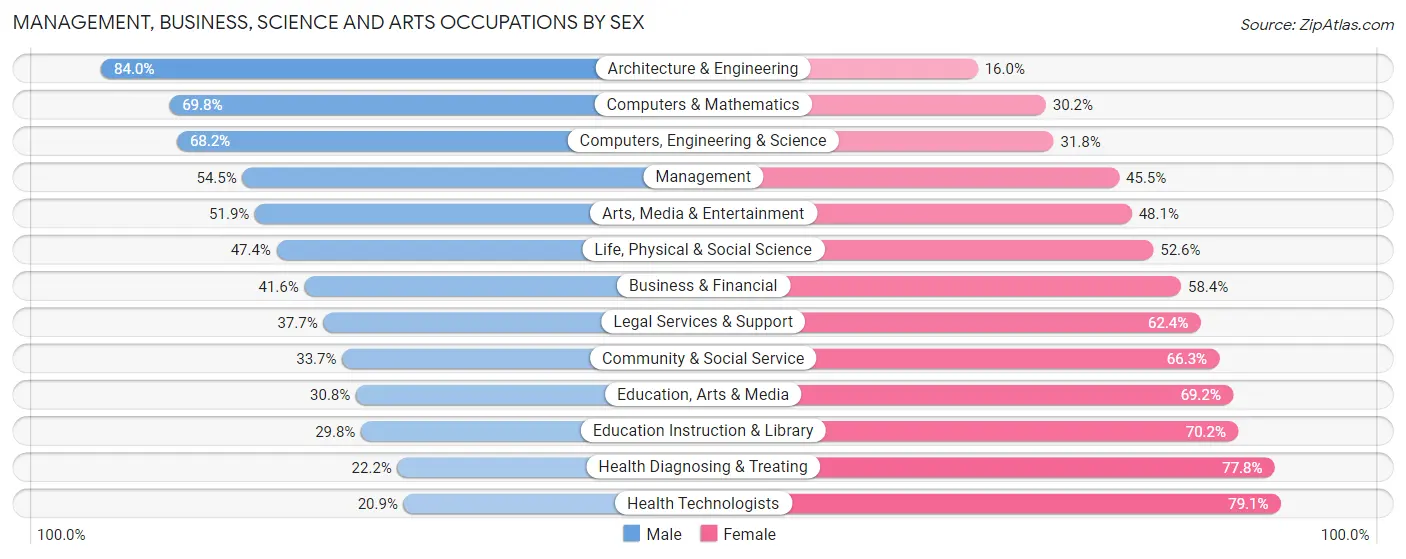
Management, Business, Science and Arts Occupations by Sex
Within the Management, Business, Science and Arts occupations in Delaware, the most male-oriented occupations are Architecture & Engineering (84.0%), Computers & Mathematics (69.8%), and Computers, Engineering & Science (68.2%), while the most female-oriented occupations are Health Technologists (79.1%), Health Diagnosing & Treating (77.8%), and Education Instruction & Library (70.2%).
| Occupation | Male | Female |
| Management | 28,104 (54.5%) | 23,428 (45.5%) |
| Business & Financial | 12,008 (41.6%) | 16,853 (58.4%) |
| Computers, Engineering & Science | 21,326 (68.2%) | 9,940 (31.8%) |
| Computers & Mathematics | 11,112 (69.8%) | 4,803 (30.2%) |
| Architecture & Engineering | 6,737 (84.0%) | 1,280 (16.0%) |
| Life, Physical & Social Science | 3,477 (47.4%) | 3,857 (52.6%) |
| Community & Social Service | 17,924 (33.7%) | 35,210 (66.3%) |
| Education, Arts & Media | 3,013 (30.8%) | 6,756 (69.2%) |
| Legal Services & Support | 2,555 (37.7%) | 4,232 (62.4%) |
| Education Instruction & Library | 8,924 (29.8%) | 21,041 (70.2%) |
| Arts, Media & Entertainment | 3,432 (51.9%) | 3,181 (48.1%) |
| Health Diagnosing & Treating | 7,104 (22.2%) | 24,922 (77.8%) |
| Health Technologists | 4,504 (20.9%) | 17,036 (79.1%) |
| Total (Category) | 86,466 (43.9%) | 110,353 (56.1%) |
| Total (Overall) | 242,306 (51.1%) | 232,149 (48.9%) |
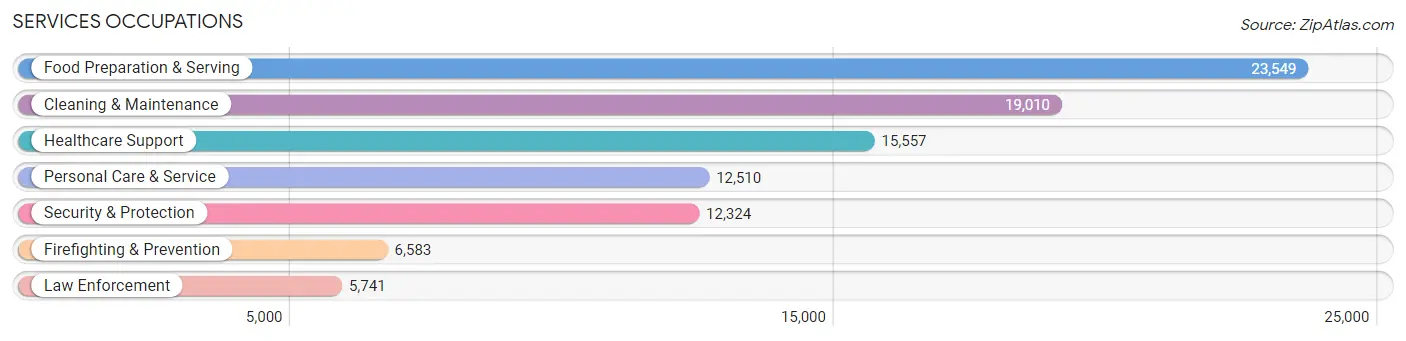
Services Occupations
The most common Services occupations in Delaware are Food Preparation & Serving (23,549 | 5.0%), Cleaning & Maintenance (19,010 | 4.0%), Healthcare Support (15,557 | 3.3%), Personal Care & Service (12,510 | 2.6%), and Security & Protection (12,324 | 2.6%).
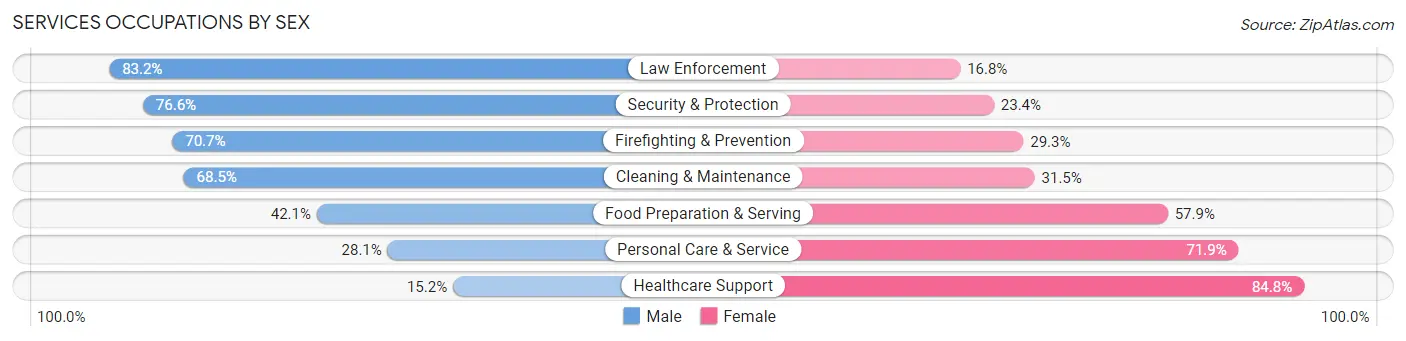
Services Occupations by Sex
Within the Services occupations in Delaware, the most male-oriented occupations are Law Enforcement (83.2%), Security & Protection (76.6%), and Firefighting & Prevention (70.7%), while the most female-oriented occupations are Healthcare Support (84.8%), Personal Care & Service (71.9%), and Food Preparation & Serving (57.9%).
| Occupation | Male | Female |
| Healthcare Support | 2,360 (15.2%) | 13,197 (84.8%) |
| Security & Protection | 9,436 (76.6%) | 2,888 (23.4%) |
| Firefighting & Prevention | 4,657 (70.7%) | 1,926 (29.3%) |
| Law Enforcement | 4,779 (83.2%) | 962 (16.8%) |
| Food Preparation & Serving | 9,924 (42.1%) | 13,625 (57.9%) |
| Cleaning & Maintenance | 13,021 (68.5%) | 5,989 (31.5%) |
| Personal Care & Service | 3,518 (28.1%) | 8,992 (71.9%) |
| Total (Category) | 38,259 (46.1%) | 44,691 (53.9%) |
| Total (Overall) | 242,306 (51.1%) | 232,149 (48.9%) |
Sales and Office Occupations
The most common Sales and Office occupations in Delaware are Office & Administration (54,000 | 11.4%), and Sales & Related (43,018 | 9.1%).

Sales and Office Occupations by Sex
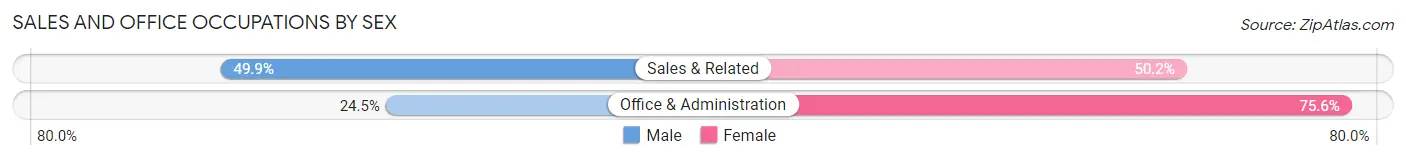
| Occupation | Male | Female |
| Sales & Related | 21,445 (49.8%) | 21,573 (50.1%) |
| Office & Administration | 13,204 (24.4%) | 40,796 (75.5%) |
| Total (Category) | 34,649 (35.7%) | 62,369 (64.3%) |
| Total (Overall) | 242,306 (51.1%) | 232,149 (48.9%) |
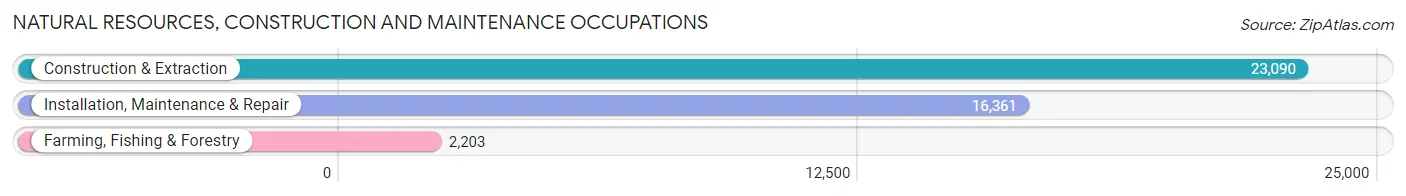
Natural Resources, Construction and Maintenance Occupations
The most common Natural Resources, Construction and Maintenance occupations in Delaware are Construction & Extraction (23,090 | 4.9%), Installation, Maintenance & Repair (16,361 | 3.5%), and Farming, Fishing & Forestry (2,203 | 0.5%).
Natural Resources, Construction and Maintenance Occupations by Sex
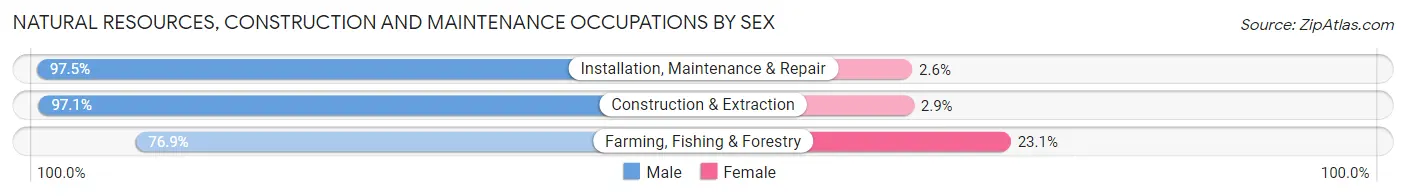
| Occupation | Male | Female |
| Farming, Fishing & Forestry | 1,695 (76.9%) | 508 (23.1%) |
| Construction & Extraction | 22,421 (97.1%) | 669 (2.9%) |
| Installation, Maintenance & Repair | 15,944 (97.5%) | 417 (2.5%) |
| Total (Category) | 40,060 (96.2%) | 1,594 (3.8%) |
| Total (Overall) | 242,306 (51.1%) | 232,149 (48.9%) |
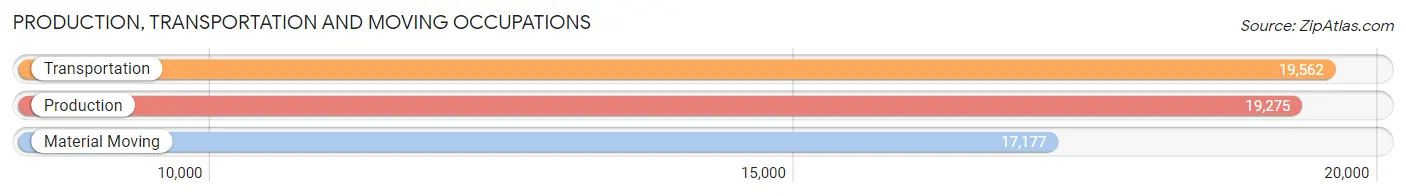
Production, Transportation and Moving Occupations
The most common Production, Transportation and Moving occupations in Delaware are Transportation (19,562 | 4.1%), Production (19,275 | 4.1%), and Material Moving (17,177 | 3.6%).
Production, Transportation and Moving Occupations by Sex
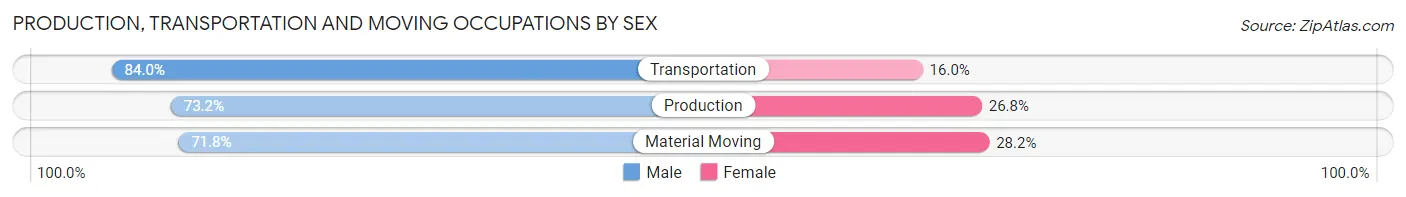
| Occupation | Male | Female |
| Production | 14,103 (73.2%) | 5,172 (26.8%) |
| Transportation | 16,436 (84.0%) | 3,126 (16.0%) |
| Material Moving | 12,333 (71.8%) | 4,844 (28.2%) |
| Total (Category) | 42,872 (76.5%) | 13,142 (23.5%) |
| Total (Overall) | 242,306 (51.1%) | 232,149 (48.9%) |
Employment Industries by Sex in Delaware
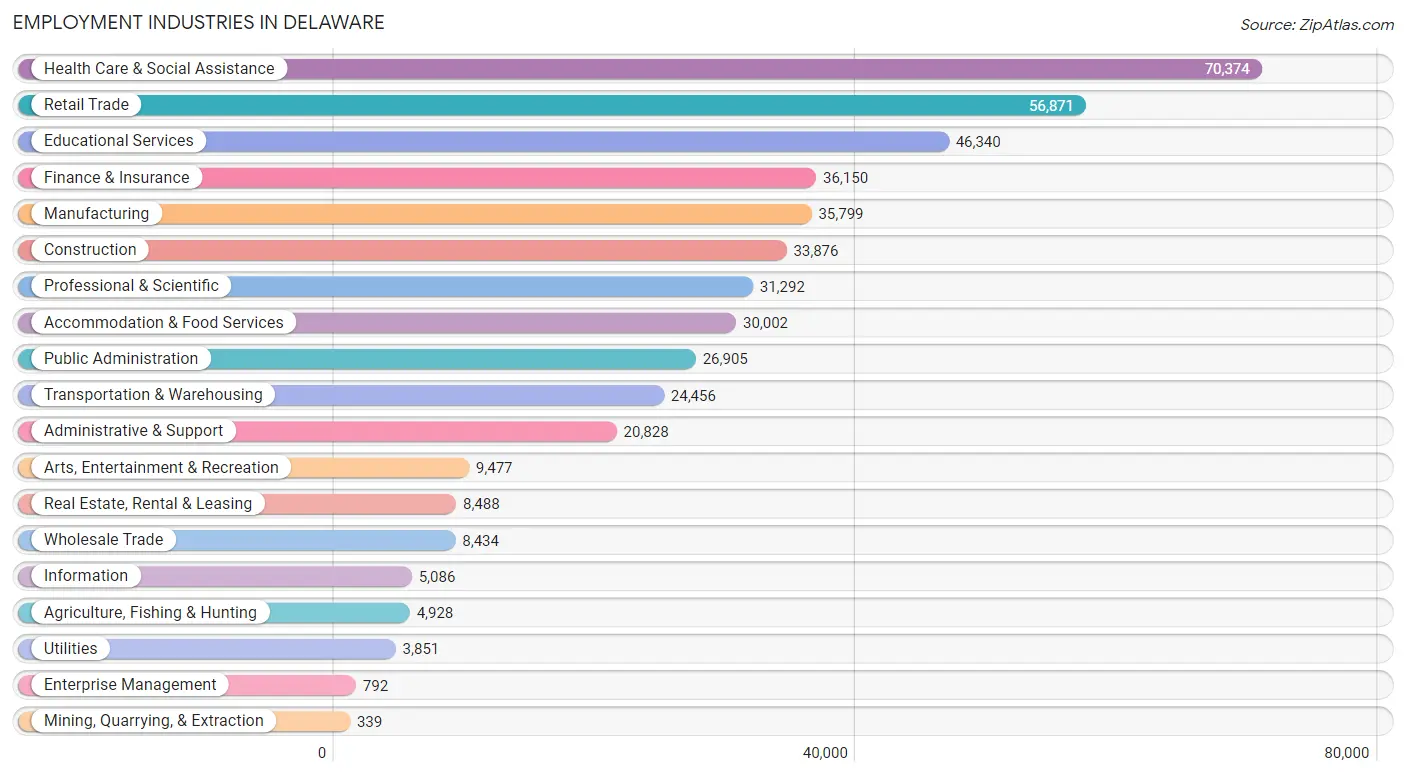
Employment Industries in Delaware
The major employment industries in Delaware include Health Care & Social Assistance (70,374 | 14.8%), Retail Trade (56,871 | 12.0%), Educational Services (46,340 | 9.8%), Finance & Insurance (36,150 | 7.6%), and Manufacturing (35,799 | 7.5%).
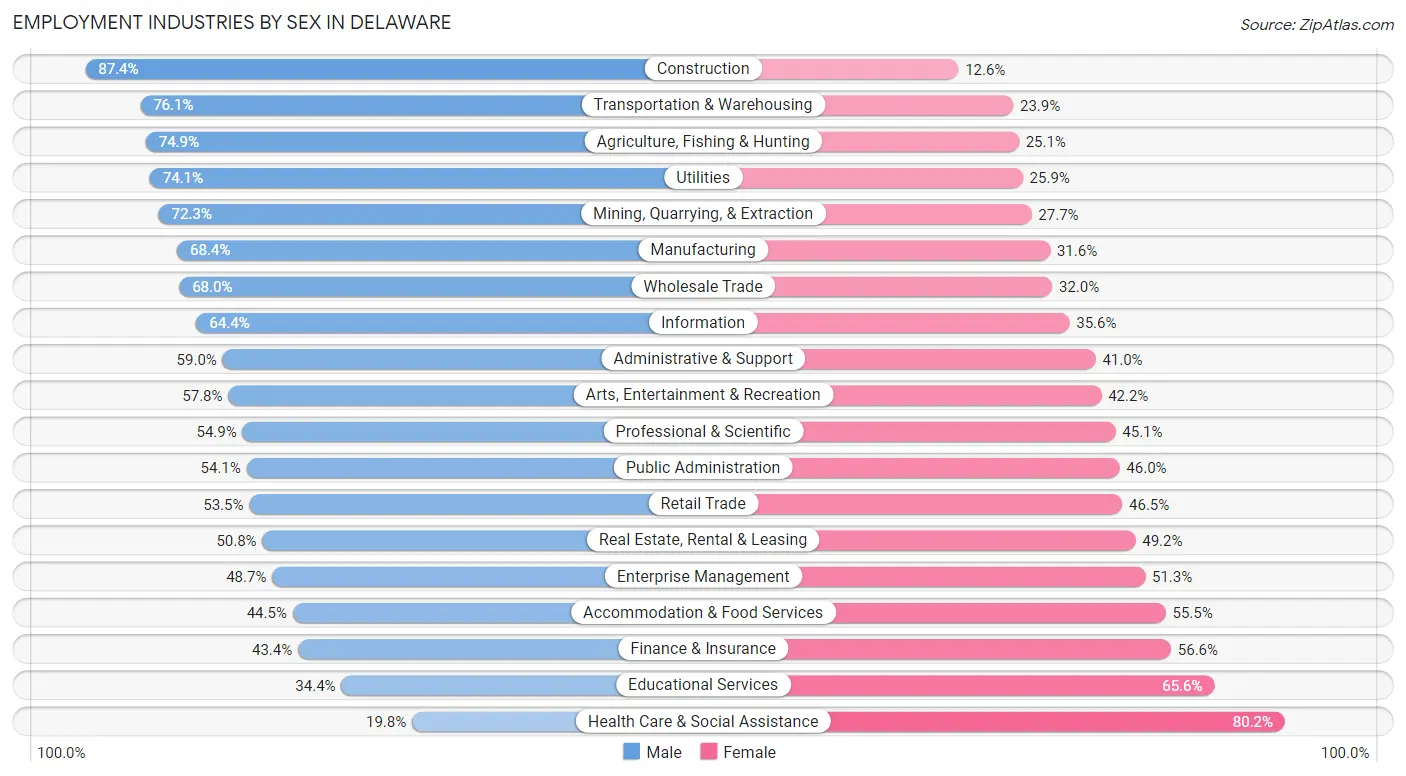
Employment Industries by Sex in Delaware
The Delaware industries that see more men than women are Construction (87.4%), Transportation & Warehousing (76.1%), and Agriculture, Fishing & Hunting (74.9%), whereas the industries that tend to have a higher number of women are Health Care & Social Assistance (80.2%), Educational Services (65.6%), and Finance & Insurance (56.6%).
| Industry | Male | Female |
| Agriculture, Fishing & Hunting | 3,691 (74.9%) | 1,237 (25.1%) |
| Mining, Quarrying, & Extraction | 245 (72.3%) | 94 (27.7%) |
| Construction | 29,613 (87.4%) | 4,263 (12.6%) |
| Manufacturing | 24,492 (68.4%) | 11,307 (31.6%) |
| Wholesale Trade | 5,734 (68.0%) | 2,700 (32.0%) |
| Retail Trade | 30,421 (53.5%) | 26,450 (46.5%) |
| Transportation & Warehousing | 18,604 (76.1%) | 5,852 (23.9%) |
| Utilities | 2,853 (74.1%) | 998 (25.9%) |
| Information | 3,277 (64.4%) | 1,809 (35.6%) |
| Finance & Insurance | 15,690 (43.4%) | 20,460 (56.6%) |
| Real Estate, Rental & Leasing | 4,309 (50.8%) | 4,179 (49.2%) |
| Professional & Scientific | 17,176 (54.9%) | 14,116 (45.1%) |
| Enterprise Management | 386 (48.7%) | 406 (51.3%) |
| Administrative & Support | 12,291 (59.0%) | 8,537 (41.0%) |
| Educational Services | 15,948 (34.4%) | 30,392 (65.6%) |
| Health Care & Social Assistance | 13,943 (19.8%) | 56,431 (80.2%) |
| Arts, Entertainment & Recreation | 5,480 (57.8%) | 3,997 (42.2%) |
| Accommodation & Food Services | 13,351 (44.5%) | 16,651 (55.5%) |
| Public Administration | 14,541 (54.0%) | 12,364 (46.0%) |
| Total | 242,306 (51.1%) | 232,149 (48.9%) |
Education in Delaware
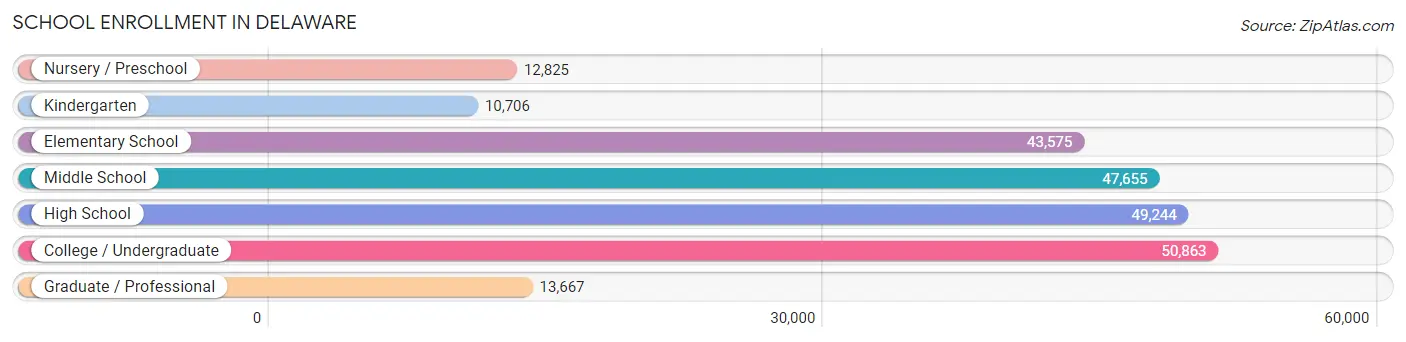
School Enrollment in Delaware
The most common levels of schooling among the 228,535 students in Delaware are college / undergraduate (50,863 | 22.3%), high school (49,244 | 21.5%), and middle school (47,655 | 20.8%).
| School Level | # Students | % Students |
| Nursery / Preschool | 12,825 | 5.6% |
| Kindergarten | 10,706 | 4.7% |
| Elementary School | 43,575 | 19.1% |
| Middle School | 47,655 | 20.8% |
| High School | 49,244 | 21.5% |
| College / Undergraduate | 50,863 | 22.3% |
| Graduate / Professional | 13,667 | 6.0% |
| Total | 228,535 | 100.0% |
School Enrollment by Age by Funding Source in Delaware
Out of a total of 228,535 students who are enrolled in schools in Delaware, 39,537 (17.3%) attend a private institution, while the remaining 188,998 (82.7%) are enrolled in public schools. The age group of 3 to 4 year olds has the highest likelihood of being enrolled in private schools, with 4,822 (47.2% in the age bracket) enrolled. Conversely, the age group of 18 to 19 year olds has the lowest likelihood of being enrolled in a private school, with 17,641 (87.8% in the age bracket) attending a public institution.
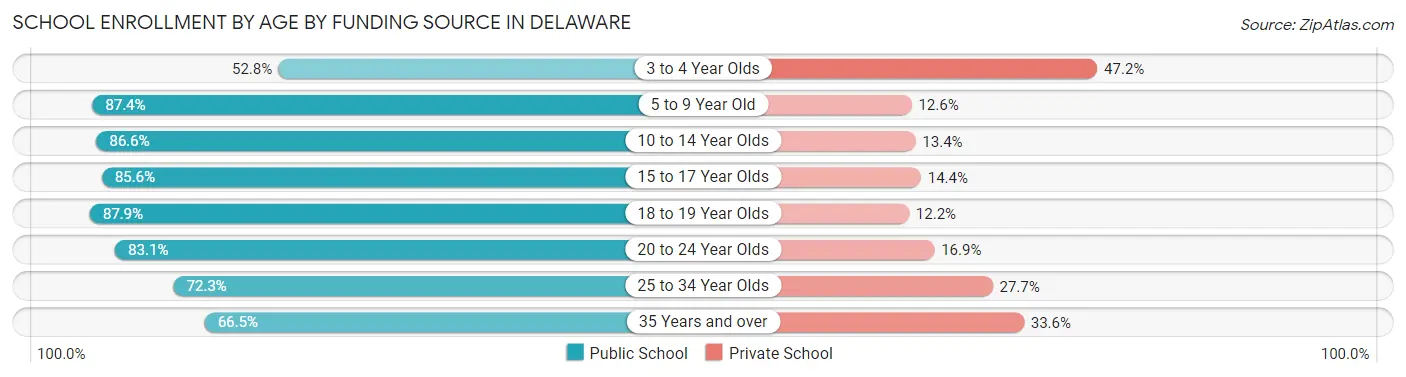
| Age Bracket | Public School | Private School |
| 3 to 4 Year Olds | 5,392 (52.8%) | 4,822 (47.2%) |
| 5 to 9 Year Old | 45,106 (87.4%) | 6,521 (12.6%) |
| 10 to 14 Year Olds | 50,474 (86.6%) | 7,780 (13.4%) |
| 15 to 17 Year Olds | 29,753 (85.6%) | 4,993 (14.4%) |
| 18 to 19 Year Olds | 17,641 (87.8%) | 2,439 (12.1%) |
| 20 to 24 Year Olds | 21,070 (83.1%) | 4,277 (16.9%) |
| 25 to 34 Year Olds | 10,219 (72.3%) | 3,921 (27.7%) |
| 35 Years and over | 9,388 (66.4%) | 4,739 (33.6%) |
| Total | 188,998 (82.7%) | 39,537 (17.3%) |
Educational Attainment by Field of Study in Delaware
Business (53,790 | 20.8%), education (32,149 | 12.4%), science & technology (25,498 | 9.8%), social sciences (19,223 | 7.4%), and engineering (17,677 | 6.8%) are the most common fields of study among 259,143 individuals in Delaware who have obtained a bachelor's degree or higher.
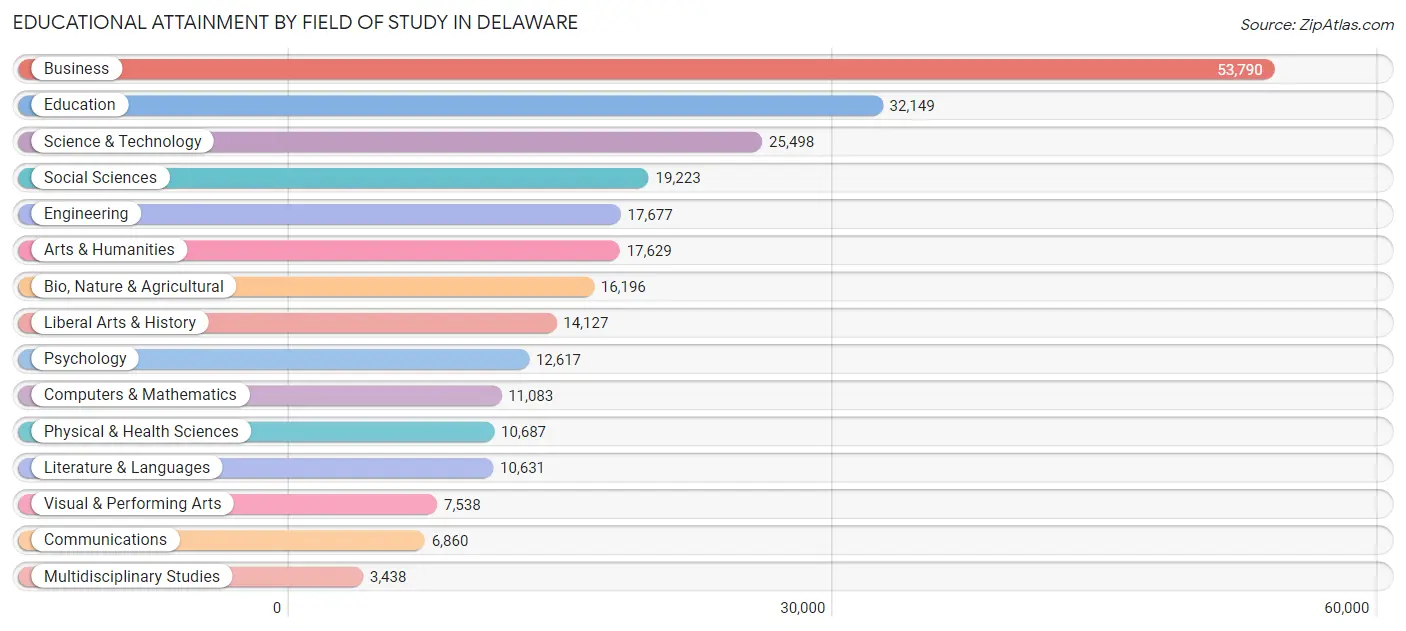
| Field of Study | # Graduates | % Graduates |
| Computers & Mathematics | 11,083 | 4.3% |
| Bio, Nature & Agricultural | 16,196 | 6.2% |
| Physical & Health Sciences | 10,687 | 4.1% |
| Psychology | 12,617 | 4.9% |
| Social Sciences | 19,223 | 7.4% |
| Engineering | 17,677 | 6.8% |
| Multidisciplinary Studies | 3,438 | 1.3% |
| Science & Technology | 25,498 | 9.8% |
| Business | 53,790 | 20.8% |
| Education | 32,149 | 12.4% |
| Literature & Languages | 10,631 | 4.1% |
| Liberal Arts & History | 14,127 | 5.4% |
| Visual & Performing Arts | 7,538 | 2.9% |
| Communications | 6,860 | 2.6% |
| Arts & Humanities | 17,629 | 6.8% |
| Total | 259,143 | 100.0% |
Transportation & Commute in Delaware
Vehicle Availability by Sex in Delaware
The most prevalent vehicle ownership categories in Delaware are males with 2 vehicles (105,998, accounting for 44.2%) and females with 2 vehicles (92,048, making up 47.2%).
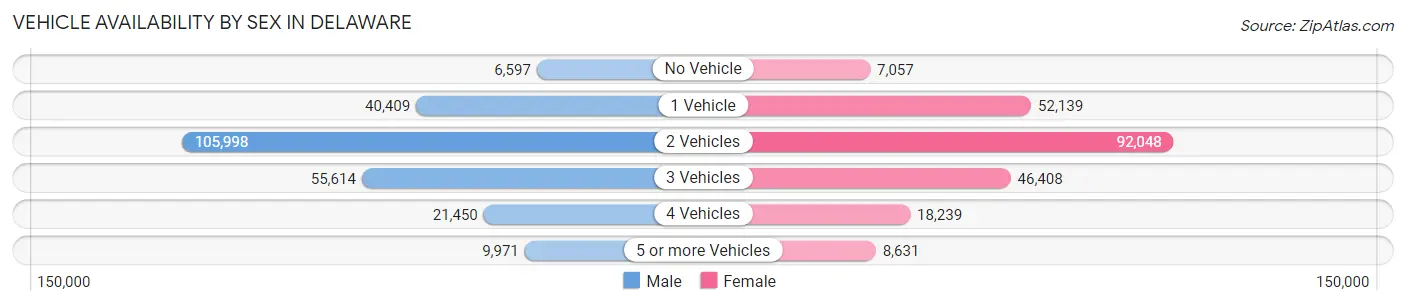
| Vehicles Available | Male | Female |
| No Vehicle | 6,597 (2.8%) | 7,057 (3.1%) |
| 1 Vehicle | 40,409 (16.8%) | 52,139 (23.2%) |
| 2 Vehicles | 105,998 (44.2%) | 92,048 (41.0%) |
| 3 Vehicles | 55,614 (23.2%) | 46,408 (20.7%) |
| 4 Vehicles | 21,450 (8.9%) | 18,239 (8.1%) |
| 5 or more Vehicles | 9,971 (4.2%) | 8,631 (3.8%) |
| Total | 240,039 (100.0%) | 224,522 (100.0%) |
Commute Time in Delaware
The most frequently occuring commute durations in Delaware are 15 to 19 minutes (70,091 commuters, 16.9%), 20 to 24 minutes (66,295 commuters, 16.0%), and 10 to 14 minutes (57,003 commuters, 13.8%).
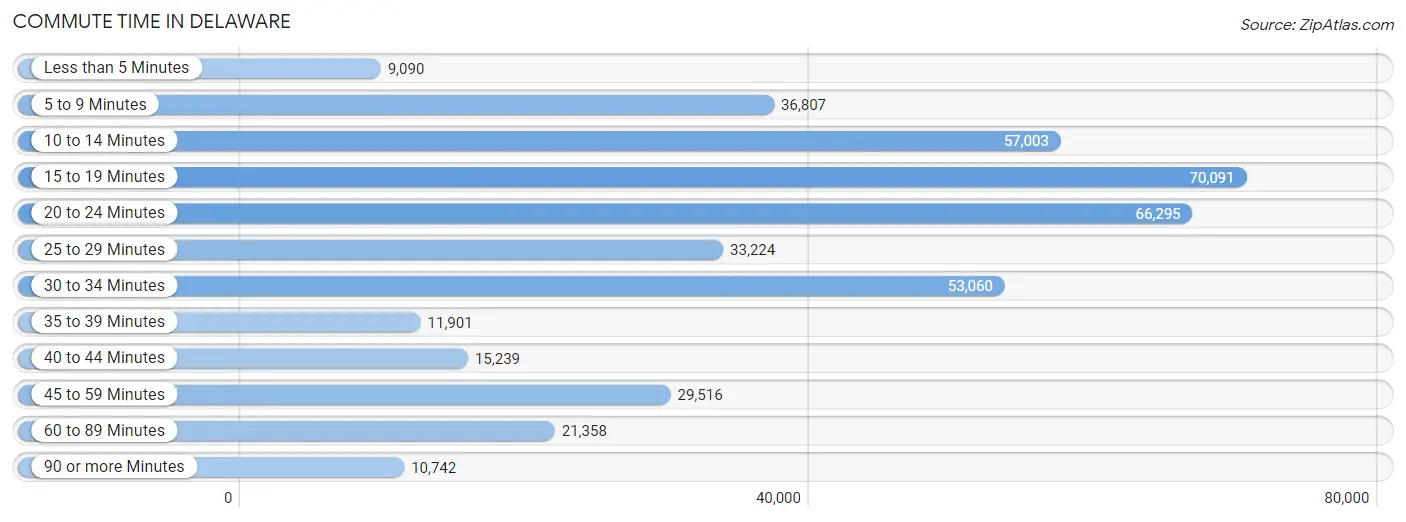
| Commute Time | # Commuters | % Commuters |
| Less than 5 Minutes | 9,090 | 2.2% |
| 5 to 9 Minutes | 36,807 | 8.9% |
| 10 to 14 Minutes | 57,003 | 13.8% |
| 15 to 19 Minutes | 70,091 | 16.9% |
| 20 to 24 Minutes | 66,295 | 16.0% |
| 25 to 29 Minutes | 33,224 | 8.0% |
| 30 to 34 Minutes | 53,060 | 12.8% |
| 35 to 39 Minutes | 11,901 | 2.9% |
| 40 to 44 Minutes | 15,239 | 3.7% |
| 45 to 59 Minutes | 29,516 | 7.1% |
| 60 to 89 Minutes | 21,358 | 5.1% |
| 90 or more Minutes | 10,742 | 2.6% |
Commute Time by Sex in Delaware
The most common commute times in Delaware are 15 to 19 minutes (35,258 commuters, 16.4%) for males and 15 to 19 minutes (34,833 commuters, 17.5%) for females.
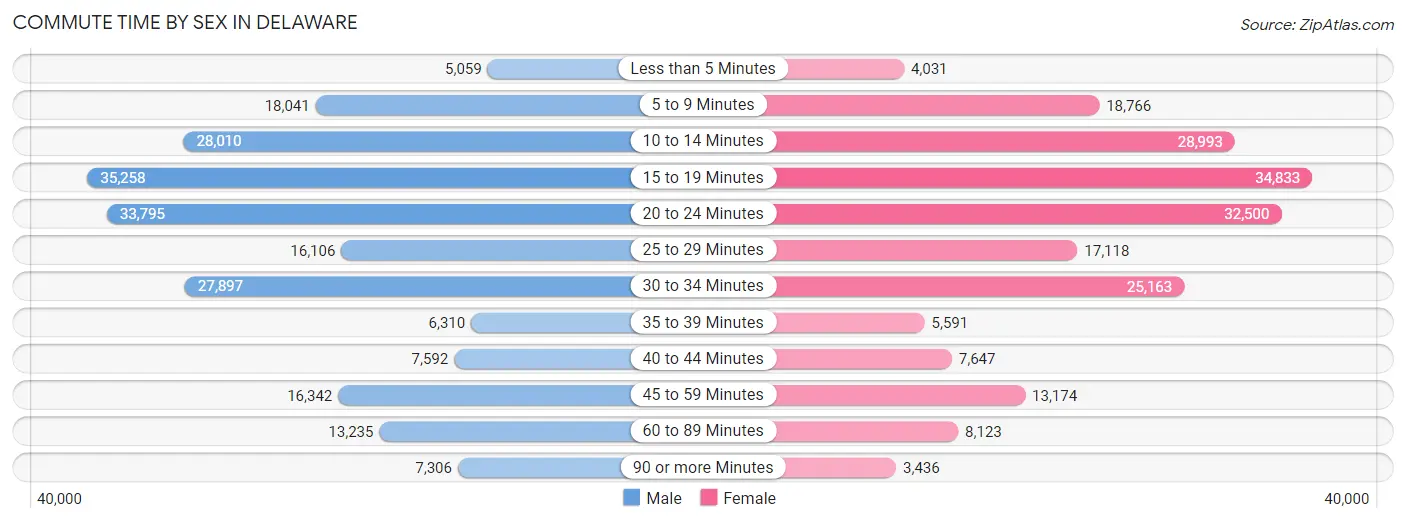
| Commute Time | Male | Female |
| Less than 5 Minutes | 5,059 (2.4%) | 4,031 (2.0%) |
| 5 to 9 Minutes | 18,041 (8.4%) | 18,766 (9.4%) |
| 10 to 14 Minutes | 28,010 (13.0%) | 28,993 (14.5%) |
| 15 to 19 Minutes | 35,258 (16.4%) | 34,833 (17.5%) |
| 20 to 24 Minutes | 33,795 (15.7%) | 32,500 (16.3%) |
| 25 to 29 Minutes | 16,106 (7.5%) | 17,118 (8.6%) |
| 30 to 34 Minutes | 27,897 (13.0%) | 25,163 (12.6%) |
| 35 to 39 Minutes | 6,310 (2.9%) | 5,591 (2.8%) |
| 40 to 44 Minutes | 7,592 (3.5%) | 7,647 (3.8%) |
| 45 to 59 Minutes | 16,342 (7.6%) | 13,174 (6.6%) |
| 60 to 89 Minutes | 13,235 (6.2%) | 8,123 (4.1%) |
| 90 or more Minutes | 7,306 (3.4%) | 3,436 (1.7%) |
Time of Departure to Work by Sex in Delaware
The most frequent times of departure to work in Delaware are 7:00 AM to 7:29 AM (32,356, 15.0%) for males and 7:00 AM to 7:29 AM (32,959, 16.5%) for females.
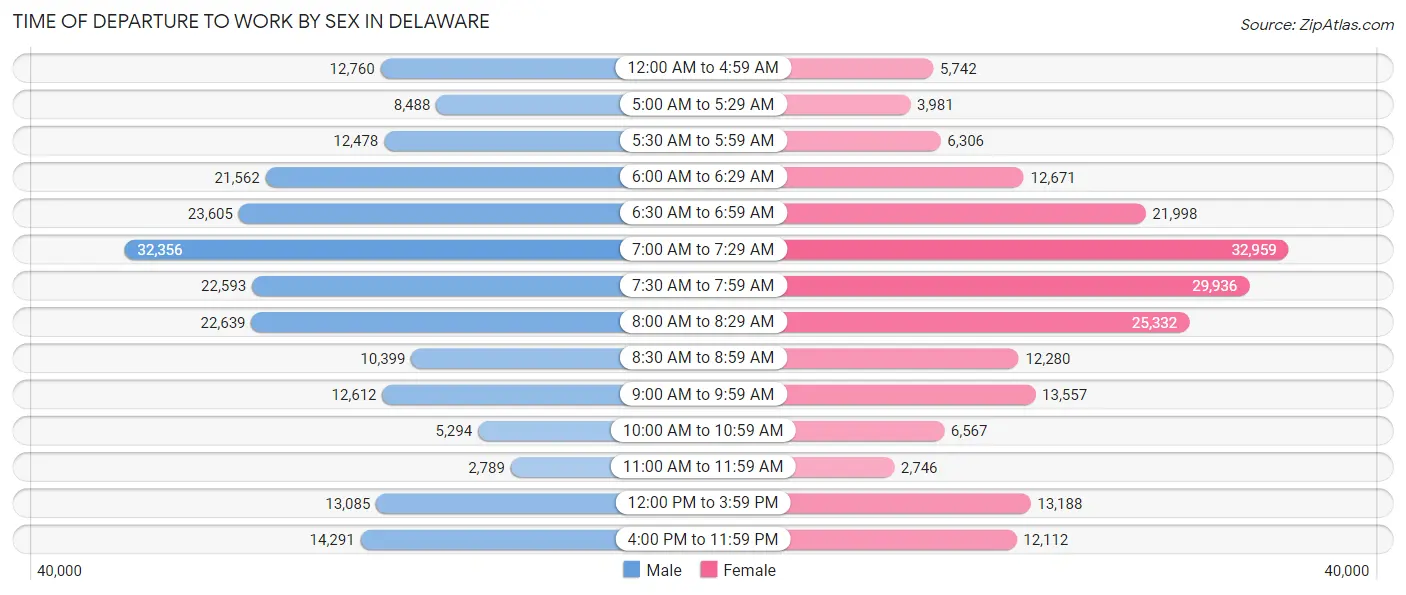
| Time of Departure | Male | Female |
| 12:00 AM to 4:59 AM | 12,760 (5.9%) | 5,742 (2.9%) |
| 5:00 AM to 5:29 AM | 8,488 (4.0%) | 3,981 (2.0%) |
| 5:30 AM to 5:59 AM | 12,478 (5.8%) | 6,306 (3.2%) |
| 6:00 AM to 6:29 AM | 21,562 (10.0%) | 12,671 (6.4%) |
| 6:30 AM to 6:59 AM | 23,605 (11.0%) | 21,998 (11.0%) |
| 7:00 AM to 7:29 AM | 32,356 (15.0%) | 32,959 (16.5%) |
| 7:30 AM to 7:59 AM | 22,593 (10.5%) | 29,936 (15.0%) |
| 8:00 AM to 8:29 AM | 22,639 (10.5%) | 25,332 (12.7%) |
| 8:30 AM to 8:59 AM | 10,399 (4.8%) | 12,280 (6.2%) |
| 9:00 AM to 9:59 AM | 12,612 (5.9%) | 13,557 (6.8%) |
| 10:00 AM to 10:59 AM | 5,294 (2.5%) | 6,567 (3.3%) |
| 11:00 AM to 11:59 AM | 2,789 (1.3%) | 2,746 (1.4%) |
| 12:00 PM to 3:59 PM | 13,085 (6.1%) | 13,188 (6.6%) |
| 4:00 PM to 11:59 PM | 14,291 (6.7%) | 12,112 (6.1%) |
| Total | 214,951 (100.0%) | 199,375 (100.0%) |
Housing Occupancy in Delaware
Occupancy by Ownership in Delaware
Of the total 389,000 dwellings in Delaware, owner-occupied units account for 279,923 (72.0%), while renter-occupied units make up 109,077 (28.0%).
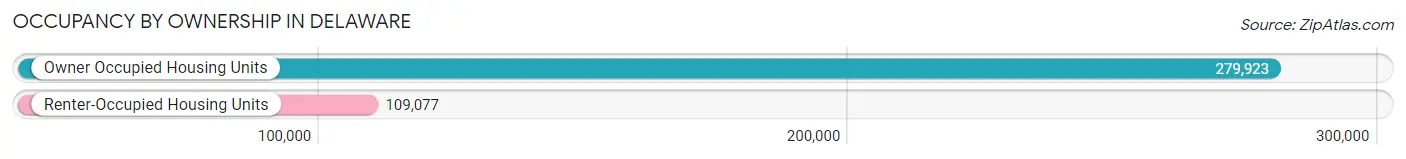
| Occupancy | # Housing Units | % Housing Units |
| Owner Occupied Housing Units | 279,923 | 72.0% |
| Renter-Occupied Housing Units | 109,077 | 28.0% |
| Total Occupied Housing Units | 389,000 | 100.0% |
Occupancy by Household Size in Delaware
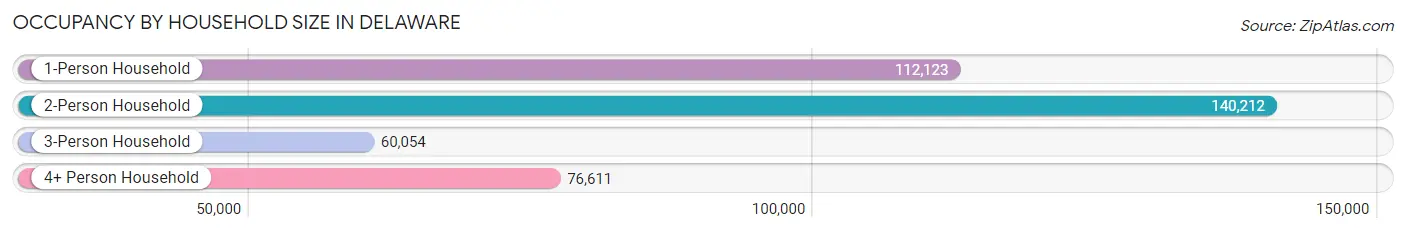
| Household Size | # Housing Units | % Housing Units |
| 1-Person Household | 112,123 | 28.8% |
| 2-Person Household | 140,212 | 36.0% |
| 3-Person Household | 60,054 | 15.4% |
| 4+ Person Household | 76,611 | 19.7% |
| Total Housing Units | 389,000 | 100.0% |
Occupancy by Ownership by Household Size in Delaware
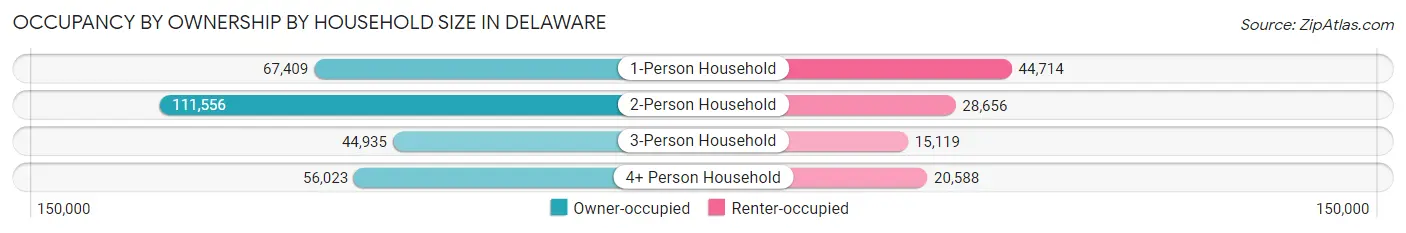
| Household Size | Owner-occupied | Renter-occupied |
| 1-Person Household | 67,409 (60.1%) | 44,714 (39.9%) |
| 2-Person Household | 111,556 (79.6%) | 28,656 (20.4%) |
| 3-Person Household | 44,935 (74.8%) | 15,119 (25.2%) |
| 4+ Person Household | 56,023 (73.1%) | 20,588 (26.9%) |
| Total Housing Units | 279,923 (72.0%) | 109,077 (28.0%) |
Occupancy by Educational Attainment in Delaware
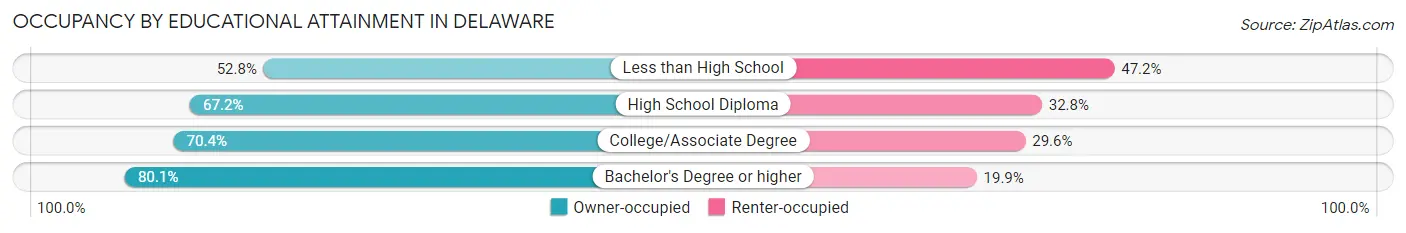
| Household Size | Owner-occupied | Renter-occupied |
| Less than High School | 14,591 (52.8%) | 13,047 (47.2%) |
| High School Diploma | 68,370 (67.2%) | 33,418 (32.8%) |
| College/Associate Degree | 79,874 (70.4%) | 33,513 (29.6%) |
| Bachelor's Degree or higher | 117,088 (80.1%) | 29,099 (19.9%) |
Occupancy by Age of Householder in Delaware
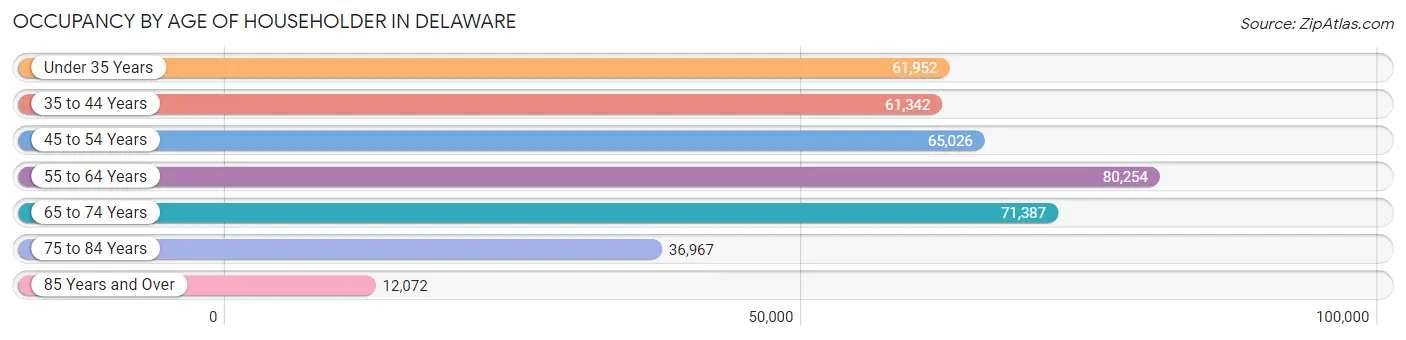
| Age Bracket | # Households | % Households |
| Under 35 Years | 61,952 | 15.9% |
| 35 to 44 Years | 61,342 | 15.8% |
| 45 to 54 Years | 65,026 | 16.7% |
| 55 to 64 Years | 80,254 | 20.6% |
| 65 to 74 Years | 71,387 | 18.3% |
| 75 to 84 Years | 36,967 | 9.5% |
| 85 Years and Over | 12,072 | 3.1% |
| Total | 389,000 | 100.0% |
Housing Finances in Delaware
Median Income by Occupancy in Delaware
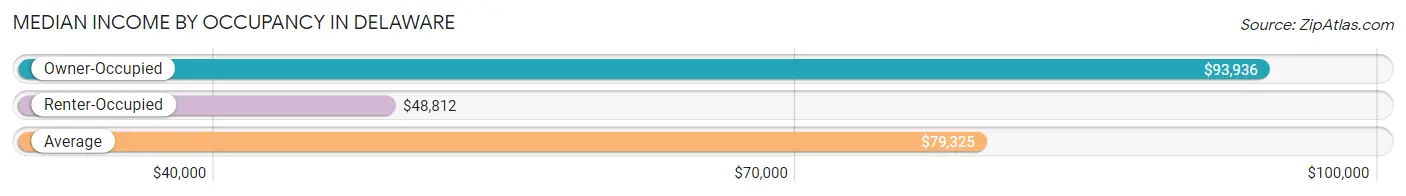
| Occupancy Type | # Households | Median Income |
| Owner-Occupied | 279,923 (72.0%) | $93,936 |
| Renter-Occupied | 109,077 (28.0%) | $48,812 |
| Average | 389,000 (100.0%) | $79,325 |
Occupancy by Householder Income Bracket in Delaware
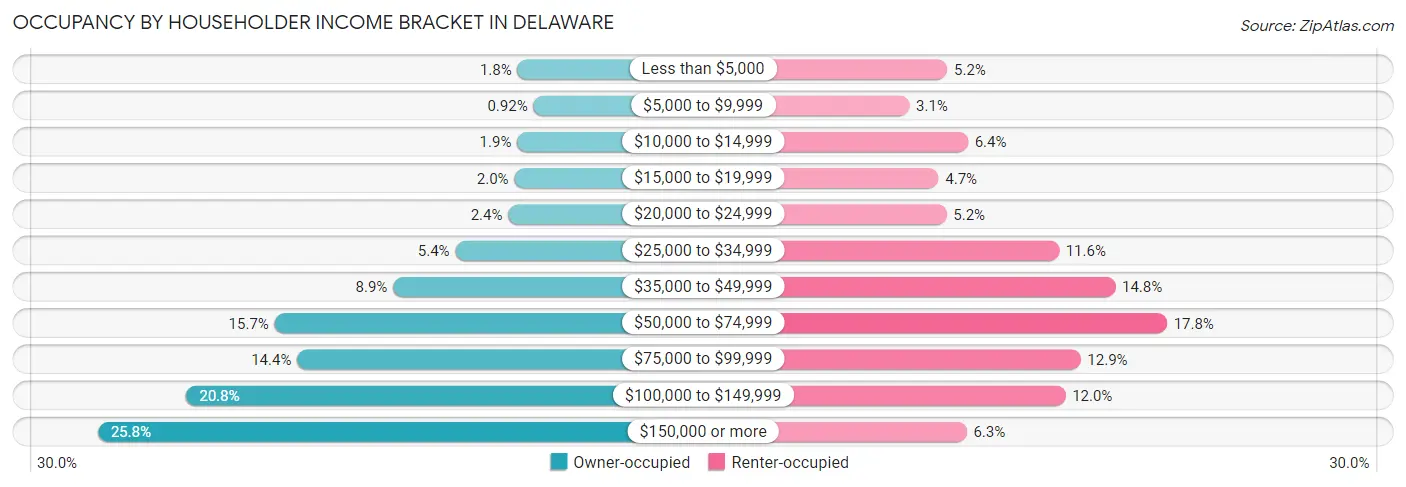
| Income Bracket | Owner-occupied | Renter-occupied |
| Less than $5,000 | 5,134 (1.8%) | 5,700 (5.2%) |
| $5,000 to $9,999 | 2,572 (0.9%) | 3,343 (3.1%) |
| $10,000 to $14,999 | 5,180 (1.8%) | 6,993 (6.4%) |
| $15,000 to $19,999 | 5,616 (2.0%) | 5,159 (4.7%) |
| $20,000 to $24,999 | 6,607 (2.4%) | 5,660 (5.2%) |
| $25,000 to $34,999 | 15,063 (5.4%) | 12,660 (11.6%) |
| $35,000 to $49,999 | 25,032 (8.9%) | 16,172 (14.8%) |
| $50,000 to $74,999 | 43,978 (15.7%) | 19,389 (17.8%) |
| $75,000 to $99,999 | 40,355 (14.4%) | 14,019 (12.9%) |
| $100,000 to $149,999 | 58,103 (20.8%) | 13,062 (12.0%) |
| $150,000 or more | 72,283 (25.8%) | 6,920 (6.3%) |
| Total | 279,923 (100.0%) | 109,077 (100.0%) |
Monthly Housing Cost Tiers in Delaware
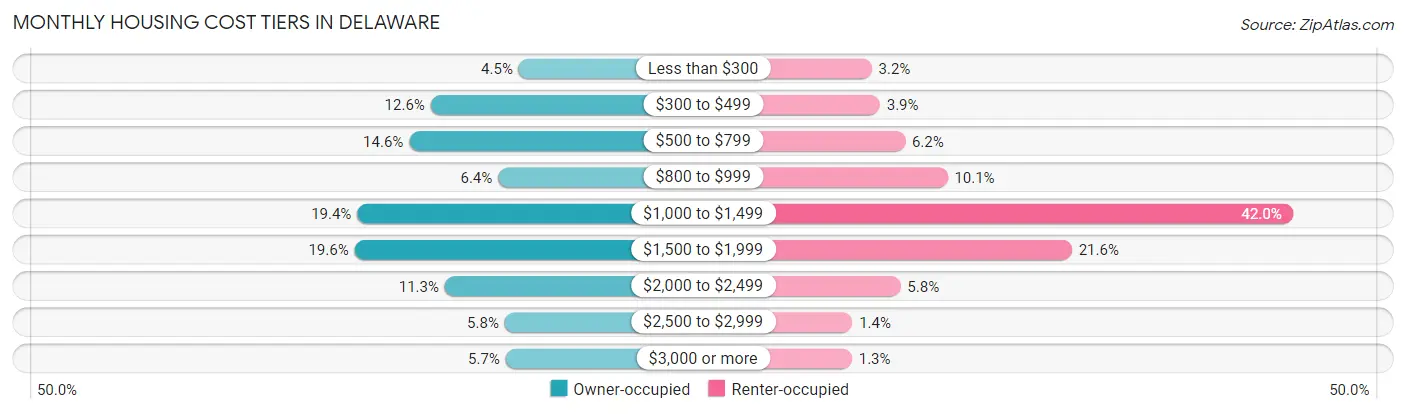
| Monthly Cost | Owner-occupied | Renter-occupied |
| Less than $300 | 12,636 (4.5%) | 3,432 (3.2%) |
| $300 to $499 | 35,328 (12.6%) | 4,258 (3.9%) |
| $500 to $799 | 40,880 (14.6%) | 6,788 (6.2%) |
| $800 to $999 | 17,953 (6.4%) | 11,050 (10.1%) |
| $1,000 to $1,499 | 54,257 (19.4%) | 45,812 (42.0%) |
| $1,500 to $1,999 | 54,949 (19.6%) | 23,533 (21.6%) |
| $2,000 to $2,499 | 31,690 (11.3%) | 6,331 (5.8%) |
| $2,500 to $2,999 | 16,240 (5.8%) | 1,488 (1.4%) |
| $3,000 or more | 15,990 (5.7%) | 1,445 (1.3%) |
| Total | 279,923 (100.0%) | 109,077 (100.0%) |
Physical Housing Characteristics in Delaware
Housing Structures in Delaware
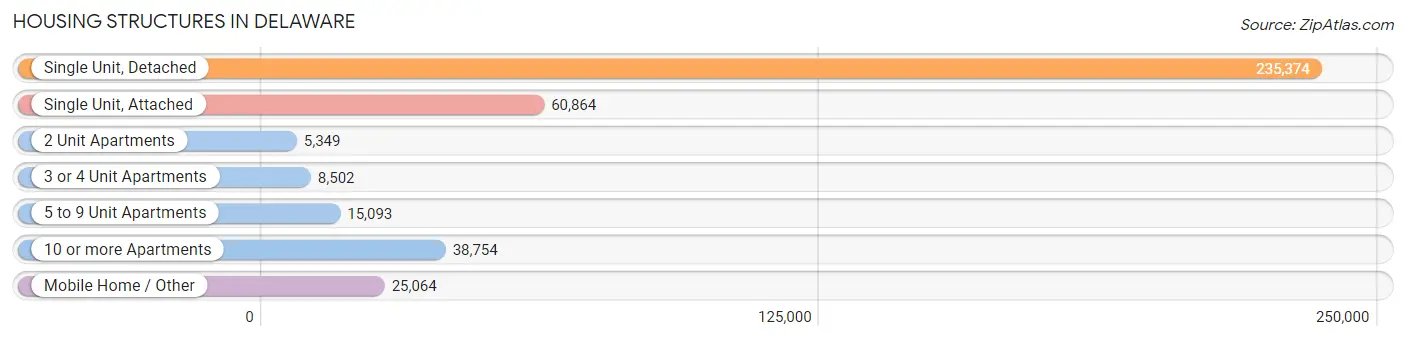
| Structure Type | # Housing Units | % Housing Units |
| Single Unit, Detached | 235,374 | 60.5% |
| Single Unit, Attached | 60,864 | 15.7% |
| 2 Unit Apartments | 5,349 | 1.4% |
| 3 or 4 Unit Apartments | 8,502 | 2.2% |
| 5 to 9 Unit Apartments | 15,093 | 3.9% |
| 10 or more Apartments | 38,754 | 10.0% |
| Mobile Home / Other | 25,064 | 6.4% |
| Total | 389,000 | 100.0% |
Housing Structures by Occupancy in Delaware
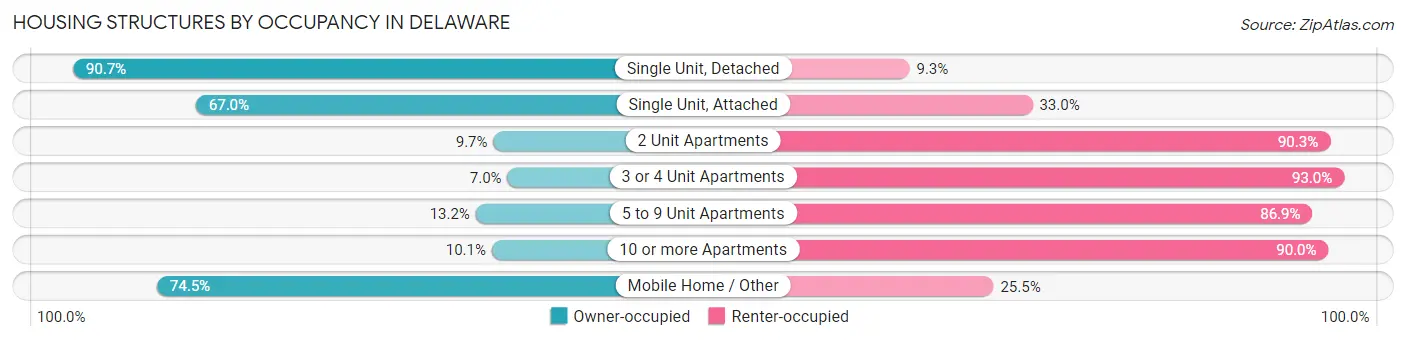
| Structure Type | Owner-occupied | Renter-occupied |
| Single Unit, Detached | 213,454 (90.7%) | 21,920 (9.3%) |
| Single Unit, Attached | 40,791 (67.0%) | 20,073 (33.0%) |
| 2 Unit Apartments | 521 (9.7%) | 4,828 (90.3%) |
| 3 or 4 Unit Apartments | 598 (7.0%) | 7,904 (93.0%) |
| 5 to 9 Unit Apartments | 1,985 (13.2%) | 13,108 (86.9%) |
| 10 or more Apartments | 3,896 (10.1%) | 34,858 (89.9%) |
| Mobile Home / Other | 18,678 (74.5%) | 6,386 (25.5%) |
| Total | 279,923 (72.0%) | 109,077 (28.0%) |
Housing Structures by Number of Rooms in Delaware
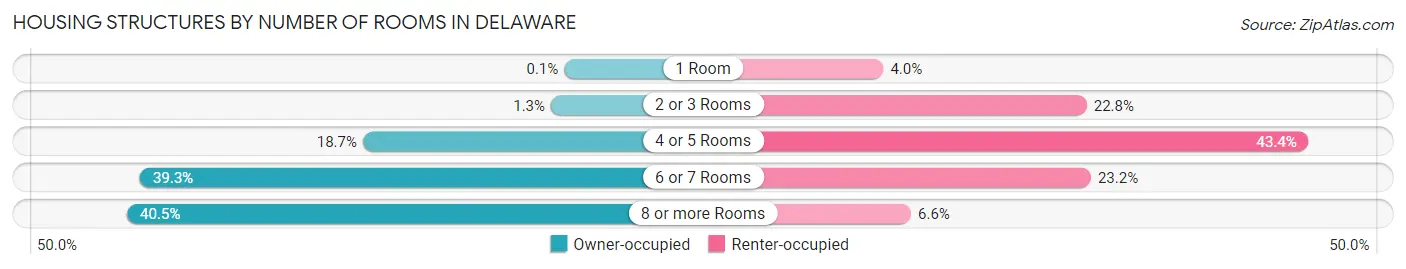
| Number of Rooms | Owner-occupied | Renter-occupied |
| 1 Room | 283 (0.1%) | 4,396 (4.0%) |
| 2 or 3 Rooms | 3,714 (1.3%) | 24,905 (22.8%) |
| 4 or 5 Rooms | 52,415 (18.7%) | 47,281 (43.3%) |
| 6 or 7 Rooms | 110,083 (39.3%) | 25,323 (23.2%) |
| 8 or more Rooms | 113,428 (40.5%) | 7,172 (6.6%) |
| Total | 279,923 (100.0%) | 109,077 (100.0%) |
Housing Structure by Heating Type in Delaware
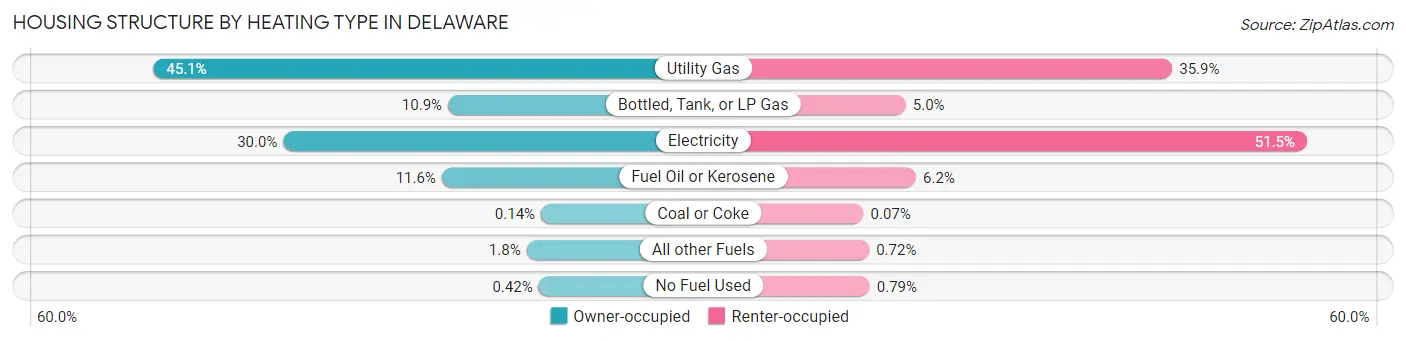
| Heating Type | Owner-occupied | Renter-occupied |
| Utility Gas | 126,145 (45.1%) | 39,114 (35.9%) |
| Bottled, Tank, or LP Gas | 30,557 (10.9%) | 5,414 (5.0%) |
| Electricity | 84,019 (30.0%) | 56,115 (51.4%) |
| Fuel Oil or Kerosene | 32,570 (11.6%) | 6,710 (6.1%) |
| Coal or Coke | 387 (0.1%) | 80 (0.1%) |
| All other Fuels | 5,061 (1.8%) | 784 (0.7%) |
| No Fuel Used | 1,184 (0.4%) | 860 (0.8%) |
| Total | 279,923 (100.0%) | 109,077 (100.0%) |
Household Vehicle Usage in Delaware
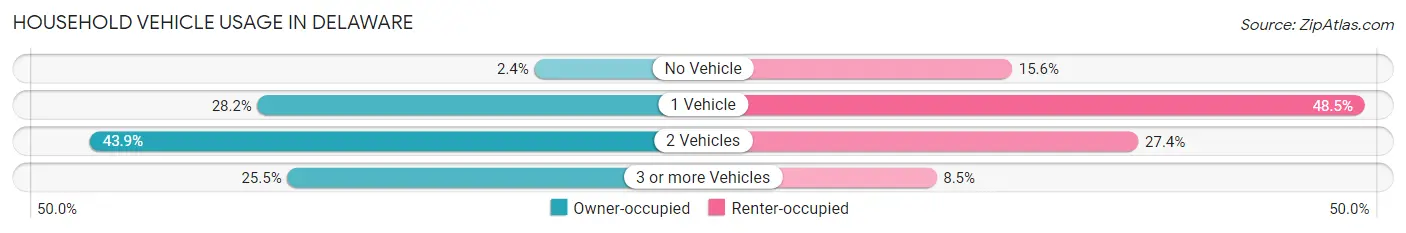
| Vehicles per Household | Owner-occupied | Renter-occupied |
| No Vehicle | 6,700 (2.4%) | 16,996 (15.6%) |
| 1 Vehicle | 79,045 (28.2%) | 52,921 (48.5%) |
| 2 Vehicles | 122,903 (43.9%) | 29,853 (27.4%) |
| 3 or more Vehicles | 71,275 (25.5%) | 9,307 (8.5%) |
| Total | 279,923 (100.0%) | 109,077 (100.0%) |
Real Estate & Mortgages in Delaware
Real Estate and Mortgage Overview in Delaware
| Characteristic | Without Mortgage | With Mortgage |
| Housing Units | 99,826 | 180,097 |
| Median Property Value | $287,300 | $314,100 |
| Median Household Income | $71,427 | $54,827 |
| Monthly Housing Costs | $523 | $15,813 |
| Real Estate Taxes | $1,409 | $5,008 |
Property Value by Mortgage Status in Delaware
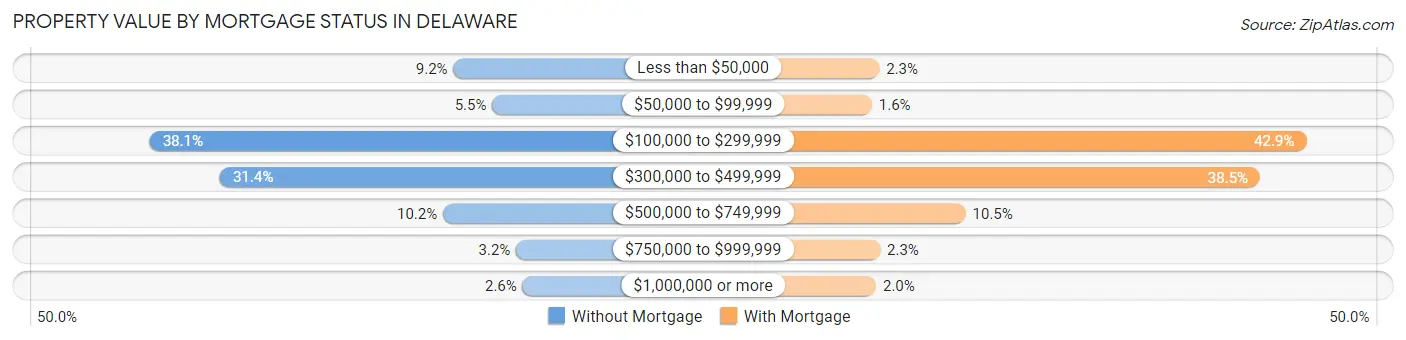
| Property Value | Without Mortgage | With Mortgage |
| Less than $50,000 | 9,147 (9.2%) | 4,070 (2.3%) |
| $50,000 to $99,999 | 5,453 (5.5%) | 2,796 (1.5%) |
| $100,000 to $299,999 | 38,017 (38.1%) | 77,298 (42.9%) |
| $300,000 to $499,999 | 31,333 (31.4%) | 69,351 (38.5%) |
| $500,000 to $749,999 | 10,135 (10.2%) | 18,867 (10.5%) |
| $750,000 to $999,999 | 3,176 (3.2%) | 4,209 (2.3%) |
| $1,000,000 or more | 2,565 (2.6%) | 3,506 (1.9%) |
| Total | 99,826 (100.0%) | 180,097 (100.0%) |
Household Income by Mortgage Status in Delaware
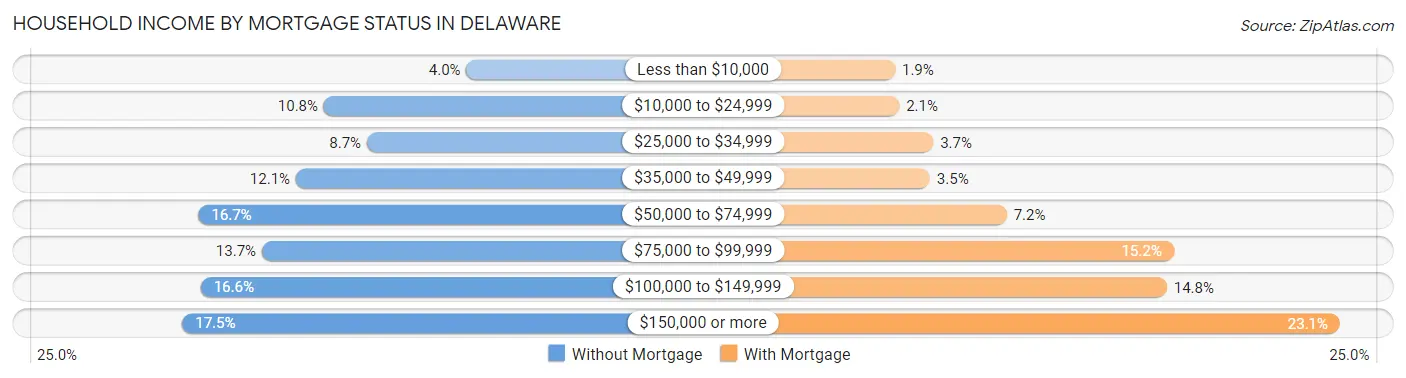
| Household Income | Without Mortgage | With Mortgage |
| Less than $10,000 | 3,955 (4.0%) | 3,385 (1.9%) |
| $10,000 to $24,999 | 10,734 (10.7%) | 3,751 (2.1%) |
| $25,000 to $34,999 | 8,681 (8.7%) | 6,669 (3.7%) |
| $35,000 to $49,999 | 12,061 (12.1%) | 6,382 (3.5%) |
| $50,000 to $74,999 | 16,690 (16.7%) | 12,971 (7.2%) |
| $75,000 to $99,999 | 13,672 (13.7%) | 27,288 (15.1%) |
| $100,000 to $149,999 | 16,577 (16.6%) | 26,683 (14.8%) |
| $150,000 or more | 17,456 (17.5%) | 41,526 (23.1%) |
| Total | 99,826 (100.0%) | 180,097 (100.0%) |
Property Value to Household Income Ratio in Delaware
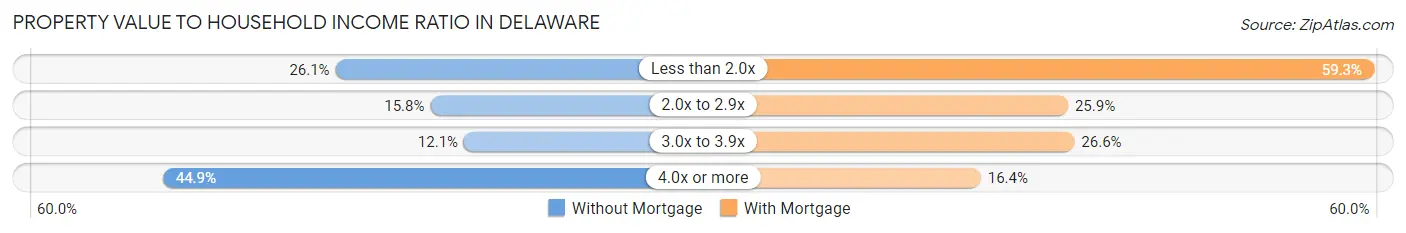
| Value-to-Income Ratio | Without Mortgage | With Mortgage |
| Less than 2.0x | 26,088 (26.1%) | 106,744 (59.3%) |
| 2.0x to 2.9x | 15,760 (15.8%) | 46,717 (25.9%) |
| 3.0x to 3.9x | 12,104 (12.1%) | 47,980 (26.6%) |
| 4.0x or more | 44,864 (44.9%) | 29,603 (16.4%) |
| Total | 99,826 (100.0%) | 180,097 (100.0%) |
Real Estate Taxes by Mortgage Status in Delaware
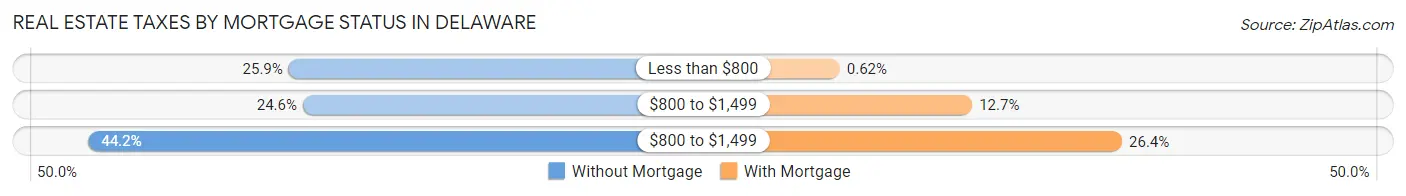
| Property Taxes | Without Mortgage | With Mortgage |
| Less than $800 | 25,842 (25.9%) | 1,113 (0.6%) |
| $800 to $1,499 | 24,545 (24.6%) | 22,882 (12.7%) |
| $800 to $1,499 | 44,102 (44.2%) | 47,552 (26.4%) |
| Total | 99,826 (100.0%) | 180,097 (100.0%) |
Health & Disability in Delaware
Health Insurance Coverage by Age in Delaware
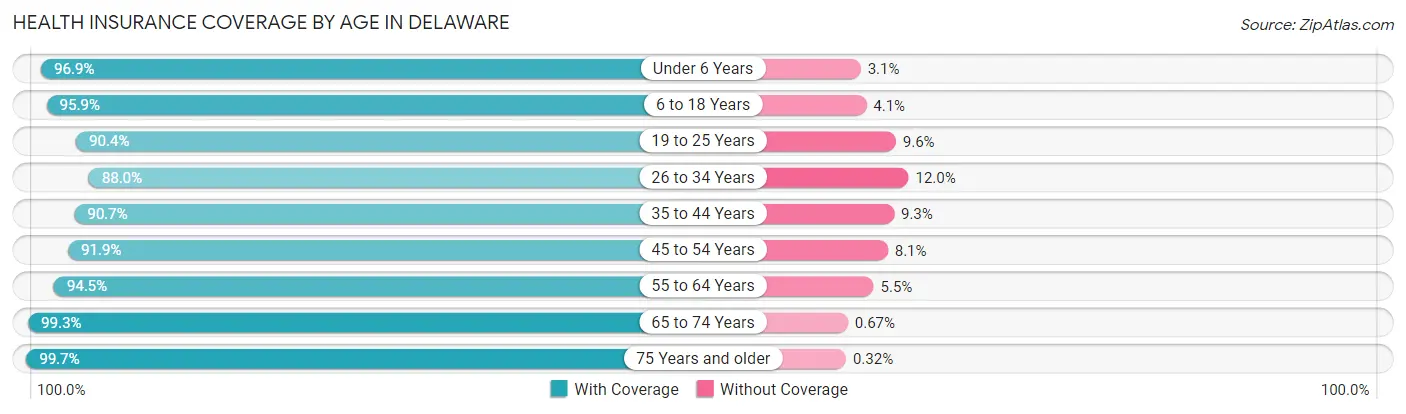
| Age Bracket | With Coverage | Without Coverage |
| Under 6 Years | 62,674 (96.9%) | 1,985 (3.1%) |
| 6 to 18 Years | 149,995 (95.9%) | 6,428 (4.1%) |
| 19 to 25 Years | 74,010 (90.4%) | 7,872 (9.6%) |
| 26 to 34 Years | 99,567 (88.0%) | 13,560 (12.0%) |
| 35 to 44 Years | 104,648 (90.7%) | 10,707 (9.3%) |
| 45 to 54 Years | 108,263 (91.9%) | 9,549 (8.1%) |
| 55 to 64 Years | 131,898 (94.5%) | 7,616 (5.5%) |
| 65 to 74 Years | 115,738 (99.3%) | 778 (0.7%) |
| 75 Years and older | 74,325 (99.7%) | 240 (0.3%) |
| Total | 921,118 (94.0%) | 58,735 (6.0%) |
Health Insurance Coverage by Citizenship Status in Delaware
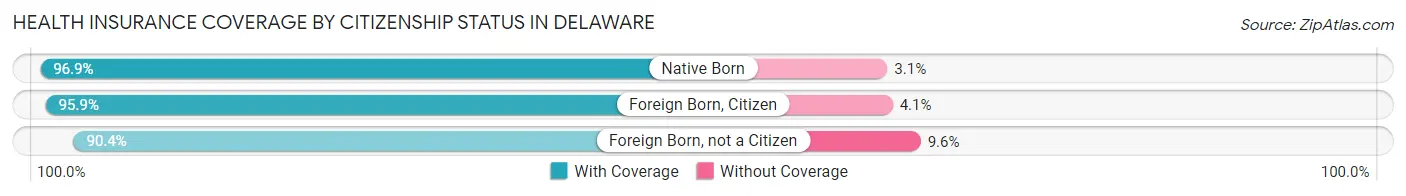
| Citizenship Status | With Coverage | Without Coverage |
| Native Born | 62,674 (96.9%) | 1,985 (3.1%) |
| Foreign Born, Citizen | 149,995 (95.9%) | 6,428 (4.1%) |
| Foreign Born, not a Citizen | 74,010 (90.4%) | 7,872 (9.6%) |
Health Insurance Coverage by Household Income in Delaware
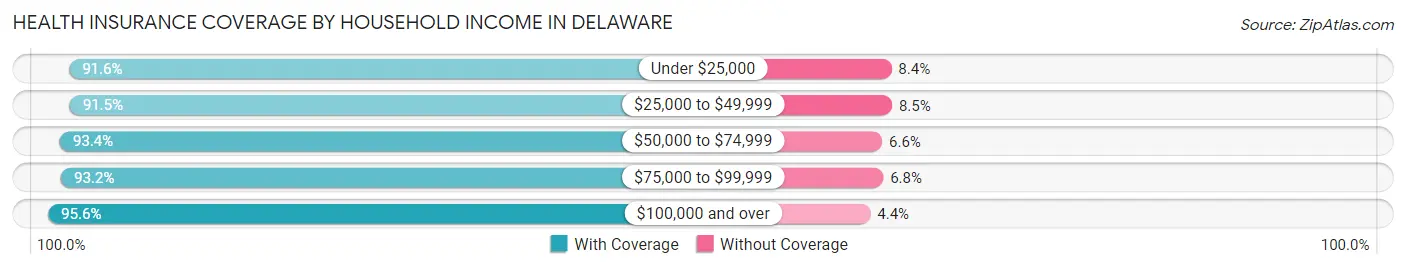
| Household Income | With Coverage | Without Coverage |
| Under $25,000 | 83,867 (91.6%) | 7,646 (8.4%) |
| $25,000 to $49,999 | 126,011 (91.5%) | 11,663 (8.5%) |
| $50,000 to $74,999 | 132,835 (93.4%) | 9,408 (6.6%) |
| $75,000 to $99,999 | 128,318 (93.2%) | 9,412 (6.8%) |
| $100,000 and over | 437,563 (95.6%) | 20,223 (4.4%) |
Public vs Private Health Insurance Coverage by Age in Delaware
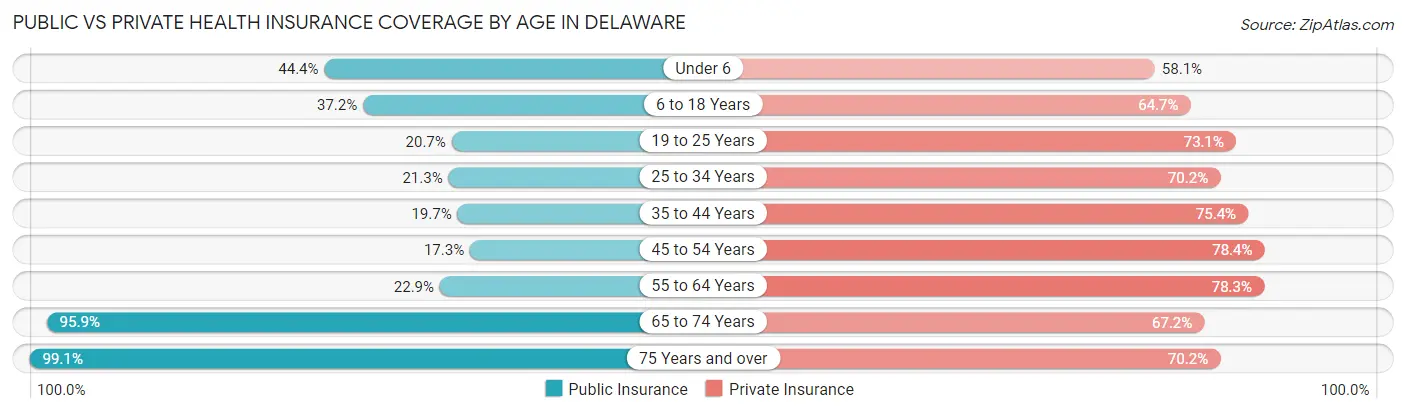
| Age Bracket | Public Insurance | Private Insurance |
| Under 6 | 28,683 (44.4%) | 37,579 (58.1%) |
| 6 to 18 Years | 58,164 (37.2%) | 101,193 (64.7%) |
| 19 to 25 Years | 16,982 (20.7%) | 59,880 (73.1%) |
| 25 to 34 Years | 24,121 (21.3%) | 79,409 (70.2%) |
| 35 to 44 Years | 22,673 (19.7%) | 86,956 (75.4%) |
| 45 to 54 Years | 20,411 (17.3%) | 92,380 (78.4%) |
| 55 to 64 Years | 31,972 (22.9%) | 109,270 (78.3%) |
| 65 to 74 Years | 111,743 (95.9%) | 78,343 (67.2%) |
| 75 Years and over | 73,884 (99.1%) | 52,351 (70.2%) |
| Total | 388,633 (39.7%) | 697,361 (71.2%) |
Disability Status by Sex by Age in Delaware
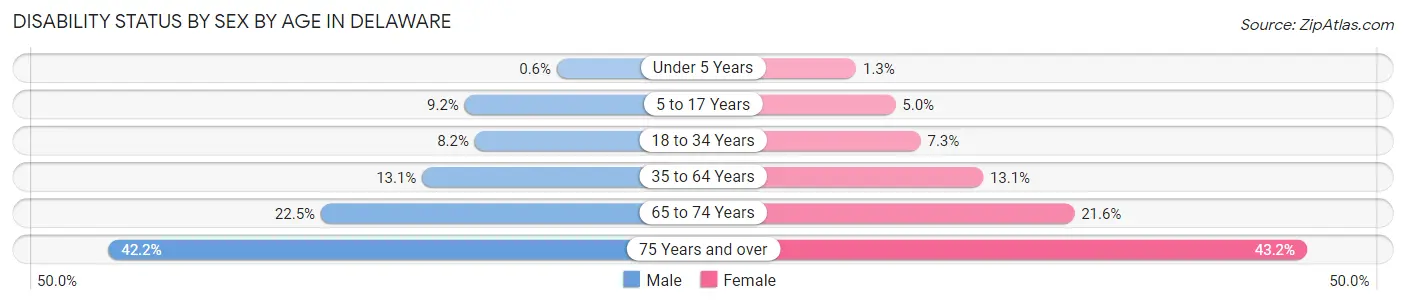
| Age Bracket | Male | Female |
| Under 5 Years | 164 (0.6%) | 350 (1.3%) |
| 5 to 17 Years | 7,086 (9.2%) | 3,741 (5.0%) |
| 18 to 34 Years | 8,489 (8.2%) | 7,768 (7.3%) |
| 35 to 64 Years | 23,402 (13.1%) | 25,408 (13.1%) |
| 65 to 74 Years | 12,160 (22.5%) | 13,477 (21.6%) |
| 75 Years and over | 13,641 (42.2%) | 18,238 (43.2%) |
Disability Class by Sex by Age in Delaware
Disability Class: Hearing Difficulty
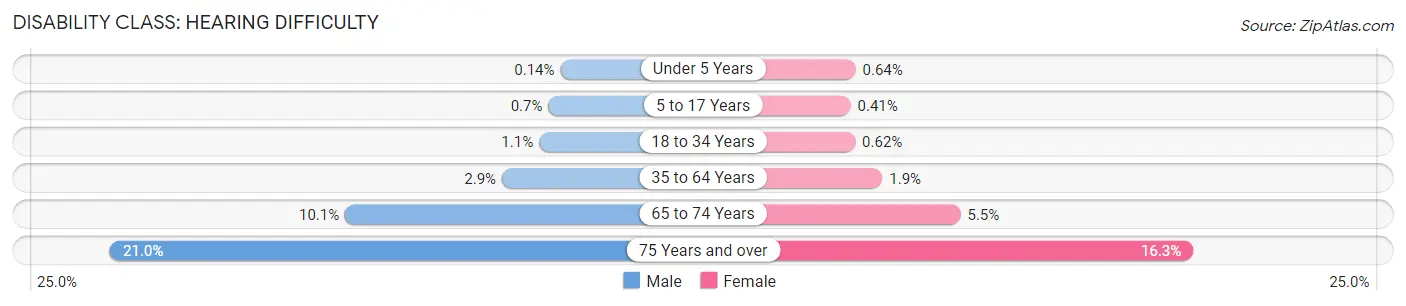
| Age Bracket | Male | Female |
| Under 5 Years | 39 (0.1%) | 171 (0.6%) |
| 5 to 17 Years | 542 (0.7%) | 306 (0.4%) |
| 18 to 34 Years | 1,166 (1.1%) | 658 (0.6%) |
| 35 to 64 Years | 5,085 (2.9%) | 3,643 (1.9%) |
| 65 to 74 Years | 5,475 (10.1%) | 3,441 (5.5%) |
| 75 Years and over | 6,793 (21.0%) | 6,889 (16.3%) |
Disability Class: Vision Difficulty
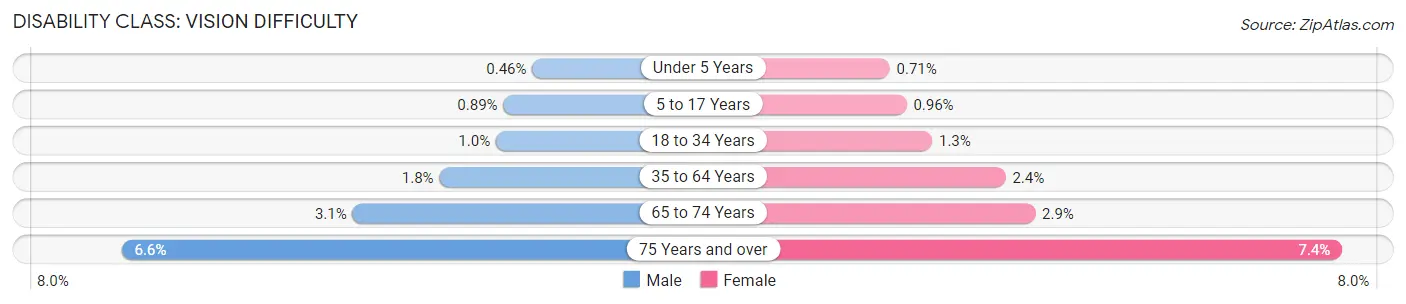
| Age Bracket | Male | Female |
| Under 5 Years | 125 (0.5%) | 188 (0.7%) |
| 5 to 17 Years | 686 (0.9%) | 719 (1.0%) |
| 18 to 34 Years | 1,031 (1.0%) | 1,422 (1.3%) |
| 35 to 64 Years | 3,296 (1.8%) | 4,717 (2.4%) |
| 65 to 74 Years | 1,692 (3.1%) | 1,796 (2.9%) |
| 75 Years and over | 2,118 (6.6%) | 3,138 (7.4%) |
Disability Class: Cognitive Difficulty
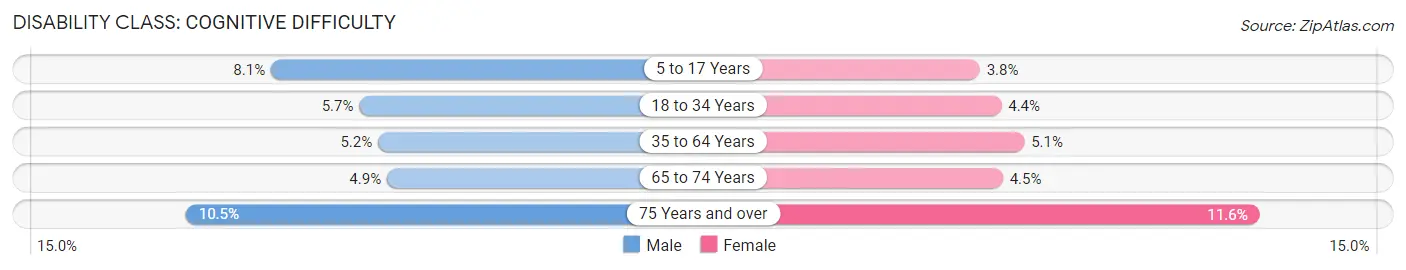
| Age Bracket | Male | Female |
| 5 to 17 Years | 6,298 (8.1%) | 2,885 (3.8%) |
| 18 to 34 Years | 5,865 (5.7%) | 4,713 (4.4%) |
| 35 to 64 Years | 9,218 (5.2%) | 9,851 (5.1%) |
| 65 to 74 Years | 2,655 (4.9%) | 2,798 (4.5%) |
| 75 Years and over | 3,394 (10.5%) | 4,915 (11.6%) |
Disability Class: Ambulatory Difficulty
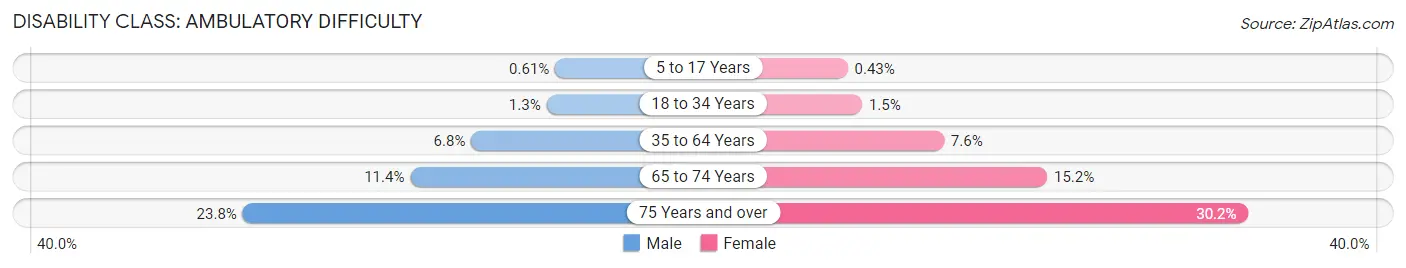
| Age Bracket | Male | Female |
| 5 to 17 Years | 474 (0.6%) | 323 (0.4%) |
| 18 to 34 Years | 1,294 (1.3%) | 1,598 (1.5%) |
| 35 to 64 Years | 12,229 (6.8%) | 14,698 (7.6%) |
| 65 to 74 Years | 6,146 (11.4%) | 9,525 (15.2%) |
| 75 Years and over | 7,690 (23.8%) | 12,753 (30.2%) |
Disability Class: Self-Care Difficulty
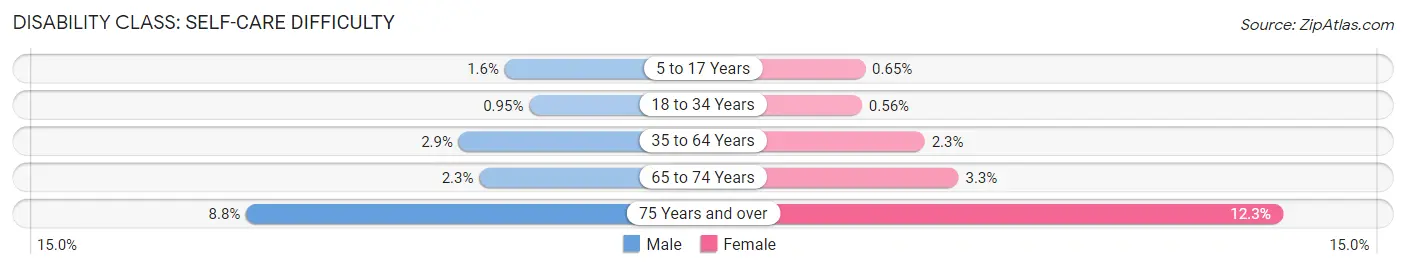
| Age Bracket | Male | Female |
| 5 to 17 Years | 1,263 (1.6%) | 489 (0.6%) |
| 18 to 34 Years | 977 (0.9%) | 597 (0.6%) |
| 35 to 64 Years | 5,193 (2.9%) | 4,474 (2.3%) |
| 65 to 74 Years | 1,263 (2.3%) | 2,028 (3.3%) |
| 75 Years and over | 2,854 (8.8%) | 5,186 (12.3%) |
Technology Access in Delaware
Computing Device Access in Delaware
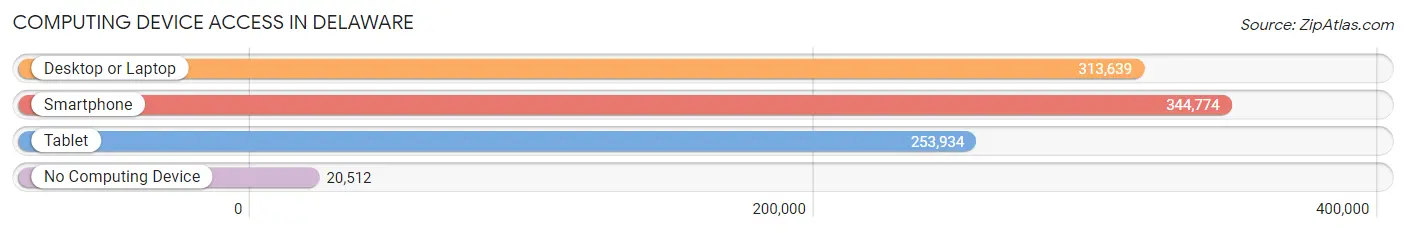
| Device Type | # Households | % Households |
| Desktop or Laptop | 313,639 | 80.6% |
| Smartphone | 344,774 | 88.6% |
| Tablet | 253,934 | 65.3% |
| No Computing Device | 20,512 | 5.3% |
| Total | 389,000 | 100.0% |
Internet Access in Delaware
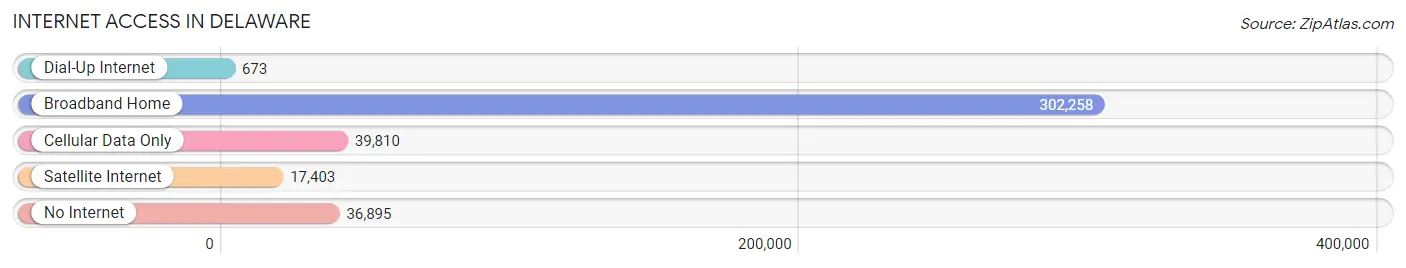
| Internet Type | # Households | % Households |
| Dial-Up Internet | 673 | 0.2% |
| Broadband Home | 302,258 | 77.7% |
| Cellular Data Only | 39,810 | 10.2% |
| Satellite Internet | 17,403 | 4.5% |
| No Internet | 36,895 | 9.5% |
| Total | 389,000 | 100.0% |
Delaware Summary
Delaware is the second smallest state in the United States, located in the Mid-Atlantic region of the country. It is bordered by Pennsylvania to the north, Maryland to the south and west, and the Atlantic Ocean to the east. Delaware is known as the “First State” because it was the first of the original 13 colonies to ratify the Constitution of the United States.
History
The area that is now Delaware was first inhabited by Native Americans, including the Lenape, Nanticoke, and Susquehannock tribes. The first European settlers arrived in the area in 1631, when the Dutch established a trading post near present-day Lewes. The area was then claimed by the Swedish and the Dutch, before being taken over by the English in 1664.
In 1704, the three lower counties of Pennsylvania (which included present-day Delaware) declared their independence from Pennsylvania and formed the “Lower Counties on the Delaware.” This area was then governed by the Proprietary of the Lower Counties on the Delaware, a position held by William Penn’s sons.
In 1776, Delaware became the first state to ratify the Constitution of the United States, and it was admitted to the Union as the first state on December 7, 1787. During the Civil War, Delaware remained in the Union, although it was a slave state. After the war, Delaware was the first state to ratify the Thirteenth Amendment, which abolished slavery.
Geography
Delaware is located in the Mid-Atlantic region of the United States, bordered by Pennsylvania to the north, Maryland to the south and west, and the Atlantic Ocean to the east. The state is divided into three counties: New Castle, Kent, and Sussex.
The state has a total area of 1,982 square miles, making it the second smallest state in the country. The state’s highest point is Ebright Azimuth, located at 447 feet above sea level. The state’s lowest point is sea level, along the Atlantic Ocean.
The state’s climate is generally mild, with hot, humid summers and cool, wet winters. The average annual temperature is around 60°F.
Economy
Delaware’s economy is largely based on services, manufacturing, and agriculture. The state’s largest industries include chemical production, financial services, food processing, and tourism.
The state’s agricultural products include poultry, dairy products, soybeans, corn, and vegetables. The state is also home to several large chemical companies, including DuPont and W.L. Gore & Associates.
Delaware’s unemployment rate was 4.2% in 2019, slightly lower than the national average of 3.7%. The state’s median household income was $62,852 in 2019, slightly higher than the national average of $61,937.
Demographics
As of 2019, Delaware had a population of 973,764, making it the 45th most populous state in the country. The state’s population is largely concentrated in the northern part of the state, near Wilmington.
The state’s racial makeup is as follows: White (63.2%), Black or African American (22.2%), Hispanic or Latino (7.7%), Asian (3.2%), and other (3.7%). The state’s largest ancestry groups are German (17.3%), Irish (13.3%), English (12.3%), and Italian (4.7%).
Delaware’s religious makeup is as follows: Protestant (47.2%), Catholic (25.2%), Other Christian (7.2%), Other (2.2%), and Unaffiliated (18.2%). The state’s largest religious denominations are Baptist (17.2%), Methodist (10.2%), and Presbyterian (7.2%).
Conclusion
Delaware is a small state located in the Mid-Atlantic region of the United States. It is known as the “First State” because it was the first of the original 13 colonies to ratify the Constitution of the United States. The state’s economy is largely based on services, manufacturing, and agriculture, and its largest industries include chemical production, financial services, food processing, and tourism. Delaware’s population is largely concentrated in the northern part of the state, near Wilmington, and its largest ancestry groups are German, Irish, English, and Italian.
Common Questions
When was Delaware Incorporated?
Delaware was Incorporated into the Union on Dec 7, 1787.
What is the Total Area of Delaware?
Total Area of Delaware is 2,489 Square Miles.
What is the Total Land Area of Delaware?
Total Land Area of Delaware is 1,949 Square Miles.
What is the Total Water Area of Delaware?
Total Water Area of Delaware is 539 Square Miles.
What is the Average Elevation in Delaware?
Average Elevation in Delaware is 60 Feet.
What is the Highest Elevation in Delaware?
Highest Elevation in Delaware is 450 Feet.
What is the Lowest Elevation in Delaware?
Lowest Elevation in Delaware is 0 Feet.
What is the Population Density in Delaware?
Population Density in Delaware is 509.8 People per Square Mile.
What is Per Capita Income in Delaware?
Per Capita income in Delaware is $42,180.
What is the Median Family Income in Delaware?
Median Family Income in Delaware is $97,743.
What is the Median Household income in Delaware?
Median Household Income in Delaware is $79,325.
What is Income or Wage Gap in Delaware?
Income or Wage Gap in Delaware is 24.3%.
Women in Delaware earn 75.7 cents for every dollar earned by a man.
What is Family Income Deficit in Delaware?
Family Income Deficit in Delaware is $10,747.
Families that are below poverty line in Delaware earn $10,747 less on average than the poverty threshold level.
What is Inequality or Gini Index in Delaware?
Inequality or Gini Index in Delaware is 0.45.
What is the Total Population of Delaware?
Total Population of Delaware is 993,635.
What is the Total Male Population of Delaware?
Total Male Population of Delaware is 482,909.
What is the Total Female Population of Delaware?
Total Female Population of Delaware is 510,726.
What is the Ratio of Males per 100 Females in Delaware?
There are 94.55 Males per 100 Females in Delaware.
What is the Ratio of Females per 100 Males in Delaware?
There are 105.76 Females per 100 Males in Delaware.
What is the Median Population Age in Delaware?
Median Population Age in Delaware is 41.4 Years.
What is the Average Family Size in Delaware
Average Family Size in Delaware is 3.1 People.
What is the Average Household Size in Delaware
Average Household Size in Delaware is 2.5 People.
How Large is the Labor Force in Delaware?
There are 505,419 People in the Labor Forcein in Delaware.
What is the Percentage of People in the Labor Force in Delaware?
62.3% of People are in the Labor Force in Delaware.
What is the Unemployment Rate in Delaware?
Unemployment Rate in Delaware is 5.4%.